BTCUSDT Analyst. We are close!Hello everyone! I want share my idea about Bitcoin.
In my last post honestly I didn't waiting bitcoin movement like this (I will link it in this idea) but what I saw from 1W support it exceeded my expectations.
My long open position was at 27500lvl but with that price movement I am waiting Fibonacci second level which is on 28700 (61.8). we have 2023 year high at 31000, I think there are not strong sellers. with that movement its possible to brake that resistance and show us new high.
On USDTD we have opposite picture, after pretty bullish trend there are massive price down movement which was my price prediction too (I will link in that idea).
We are close to real bullish scene on high timeframe bitcoin showing us pretty good bullish movement.
BE PATIENT!!!
Btcusdtlong

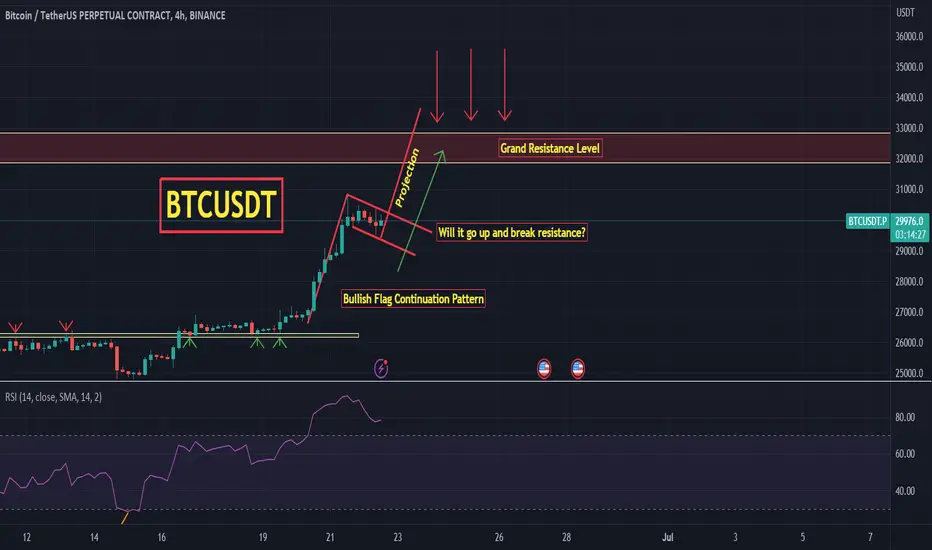
BTCUSDT Bull Flag 4H TFScript is going ballistic and approaching its previous grand resistance level. Bull flag shows continuation to upside with projection right above the resistance. It is not going to be easy fight but lets see what price action bring us. Will BTC break previous resistance and rally up? Next week will be crucial for crypto.

BTCUSD BUYAccording to my analysis of Bitcoin. There is a high possibility to rise with the breach of the descending channel, as well as the resistance at 26250. There is more rise in the coming days towards the level of 28000. good luck for everbody

BTCUSDT may head up towards 30633 zoneThe price is trading at LTF support. I think a long is favorable here towards 30633 area. The price is trading broke through the weekly resistance WR2 but came back inside the resistance zone and currently trading inside it. However, it seems the price is now ready to make another push upward at least towards the recent high it made.

BTCUSDT--20K or 30K ??Observations::
End of bearishness in the BTCUSDT.....
the crypto currency is now @ Golden zone...
It is going to reversal from this area ...
If the previous resistance acts as support, will observe the price is going and will to reach 30K again.
it forms a triangle pattern,

BTCUSDT Long TermJust as a heads up: BItcoin has made inverse Head and Shoulders, and pulled back to its Neckline. We can expect the target as shown on the chart. This is long term analysis, so we DO NOT expect to reach to that target very soon.

BTCUSDT Elliott Waves AnalysisHello friends.
Please support my work by clicking the LIKE button👍(If you liked). Also i will appreciate for ur activity. Thank you!
Everything on the chart.
2 options on the chart
now a rollback to the 27k area is likely (to retest the broken channel),
Fixing BTC above 30k will send the price to the 35k area.
Return under 26k - let's go test the 23k zone
In any case main target zone: 34-36k
SL: depending of ur risk
Good luck everyone!
Follow me on TRADINGView, if you don't want to miss my next analysis or signals.
It's not financial advice.
Dont Forget, always make your own research before to trade my ideas!
Open to any questions and suggestions.

BTCUSDT Analyst GET READY!!!Hello everyone. Today I want share my idea about Bitcoin.
Last week we saw fake out and then bounce from Fibonacci LVL which was on 25300, the bounce what we are looking now is pretty strong, it retest support and with low but green candle going up, it don t need lot talk what I am looking Bitcoin will show us soon power.
With bitcoin last strong move USDT Dominance came down for retest one of the most strong support (I will link in this post my price prediction of USDT Dominance) it bounce a little from support and came down slowly, which for me its not confirmation and buyer is not active at the zone.
Most I am looking to USDT Dominance, because trend identify is much easier there, with USDT Dominance movement I am making bitcoin price movement prediction.
For Bitcoin I have 2 scene only, which will give me entry point for long position. brake down trendline and then brake 27500 resistance or brake first 26250 support and second 25300, which will give me opportunity for open short position.
BE PATIENT AND YOU WILL WIN!!!
LOST TRADES ARE MORE IMPORTANT THAN WON TRADES!!!

BTC USDT SCENARIOS 2 scenarios
According to the trend lines created in the daily time frame, the blue trend line (TL1) will drop from 25500 to 24100-23850 and
then move towards 34000. In the second scenario (TL2),
Bitcoin will drop to 21100 and then reach 34000.
Blessings in your life :)

BTCUSDT LongThe Descending channel is now broken, we can expect the first target at the mid-line of the same channel, and the second target at the top of the channel.
Enjoy your trade, at your own risk management.

BTCUSD 1D falling wedge Hello i'm seeing this falling wedge on the
BTCUSD pair (bitstamp)
im expecting a strong bounce from 25200 25400 area
let me know what you think about this idea

BTCUSDT may move up to 26980The price has been rejected from daily resistance 1DR1. I think this push back from that resistance has created another small long opportunity. The price may move up to the hourly resistance 26980.

BTCUSDT ready to head up towards daily resistance 27066-27236Analysis: LTF
The last long trade idea almost reached to the target but did not quite hit it. I think the price action is suggesting another long opportunity with a target towards the daily resistance this time. The price has been consolidating for long in this range between 4 resistance 4HR1 and 4h support 4HS1. The price action has been very slow with very low volatility. And soon it might be ready for the upward move. The target as mentioned in the daily resistance around 27066-27236.

Bitcoin approaches next resistance level as price drive upAs you may already know, Bitcoin has been on a steady upward trend in recent weeks, and it looks like the next major resistance is near the $27,500 level. This is a significant milestone for Bitcoin, and a close above this resistance might spark bullish moves in the near term.
Furthermore, Bitcoin has already broken through the Fibonacci .23 level, which is a positive sign for investors. This means that the next major resistance at $27,500 is within reach, and it could be a great opportunity for you to add to your positions.
I encourage you to take advantage of this opportunity and consider adding to your Bitcoin positions. With the market looking bullish and the next major resistance within reach, now is the time to act.
Thank you for your time, and I wish you all the best in your Bitcoin investments.

Hello Btc, We meet again at LastBtc formed a harmonic Pattern on the consolidated at 24700 and is going to go test resistance

Target reached as predicted date (go back 27k before June 20)4h time frame
-
Despite we suffered some big vibration from many news.
We still successfully reached 27k with very exact time prediction as analysis on June 6th.

BTC ready to go back 27k in next 2weeks4h time frame
-
BTC still creating a falling wedge.
With this time structure.
We will see 27000 around June 20th.
Then can judge breakout wedge to 32000 or get rejection again.

BTCUSDT - Time for a bullish trup
my past idea
if you like the idea, please "Like" it. This is the best "Thanks!" for the author 😊 P.S. Always do your own analysis before a trade. Put a stop loss. Fix profits in installments. Withdraw profits in fiat and please yourself and your friends.

BTC - The importance of 25K25K - The second most important level after 30K (which BTC rejected from - link here )
25K is the neckline of inverted Head & Shoulders pattern, which if completed, could see BTC heading towards 34,5K (regular) or 40k (logarithmic) target.
After coming into contact with 30K level, BTC has drifted down in an descending channel or a falling wedge, making it's final little touch with the 25K level. A breakout from the wedge to the upside is the general outcome, but price of course can take a different direction, path marked with red color.
It is notable though, that the volume has dried up on Binance, the biggest exchange.
What are your thought on BTC's next direction?

SIMPLEST VIEW OF BTC #BTC UPDATE
On the daily timeframe chart, #BTC is still advancing inside the wedge pattern and is currently situated above a major trendline.
A potential bullish rally of about +20–25% might be anticipated if Bitcoin maintains its position above the trendline and successfully breaks out from the wedge to the upside.
However, a bearish rally towards 21.5k may materialize if Bitcoin loses the support of the major trendline.
Significant volatility is anticipated next week because of the US CPI and FOMC schedules.
For more quality Charts analysis, follow us.
I'm grateful.

BTCUSDT may hit daily resistance and then pullbackThe price is trading below the weekly and daily resistance confluence. All the relevant support and resistance levels are marked on the chart. I think it may still try to reach that resistance marked as 1DR1 before a significant pullback. A short will be favorable if the price hits that 1DR1. I will post the trade setup if the price reaches there and I am there to take the trade.

BTC IN BULLISH PHASEBTC again enter in bullish phase.The breakout of 4H channel done once its retested will go for LONG.
This is 4Hr TF analysis,See my previous post for 1D TF analysis.
If this post was useful,do like & share it to your friends.
