BTCUSDT likely to head for 28900This trade idea got triggered. Its a long shot but feels like its worth trying. I believe price is going to be higher from here. This was again a nice retrace to fill the long I was waiting for. Lets see where we go from here. I am targeting 28900.
Btcusdtlong

HelenP. I Bitcoin may break trendline and exit wedgeHi folks today I'm prepared for you BITCOIN analytics. Bitcoin dropped to level 27130, formed a support zone, re-tested it and, began to move up. The price rose to a resistance zone of 29800-30000, from which it rebounded, quickly fell to the support zone, and immediately rose and re-tested the resistance zone. Bitcoin continued its downtrend and reached support of 27860, after which it made a deep upward correction and continued to decline. For a long time, was created a downward wedge and now the price is traded inside. After rebounding from support of wedge, the price rose and re-tested the trendline that corresponds the wedge resistance. Recently, the price dropped, re-tested the support zone and rebounded. Bitcoin is now trading above the support area and may continue to rise. It seems to me that the price may break through the trend line and leave the wedge. Therefore, goals will be set at levels 27860 and 28850. If you like my analytics you may support me with your like/comment ❤️

BTC Getting ready to fill my scalp orderBTC will most probably touch my entry and have at least one leg up from there!
Nice R/R 😙
NFA

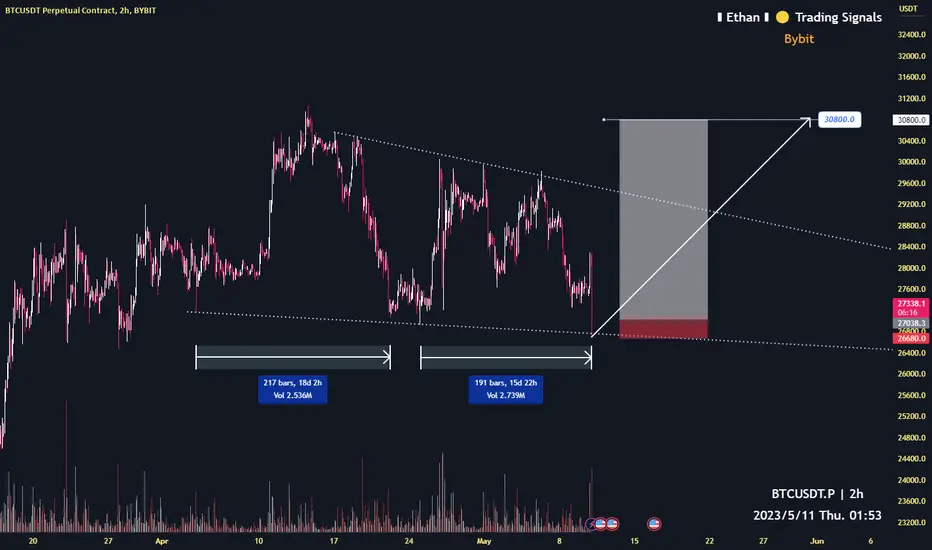
Bitcoin showing a low risk opportunity2h time frame
-
Bitcoin dumping rapidly and creating a descending wedge currently.
We can set SL a little bit lower than previous(26700), and aim at 30800 if this pattern continues to work.
This trade has great RR, do not miss it!
BTCUSDT seems to be getting ready for major up moveThis dip provided a nice long opportunity. It is difficult to post on time when the price moves so fast. But 26906 was a good level to long. And the price has already moved more than 1.5%. Did not mention that level in earlier posts as did not expect this to go there so quick. But anyways, I think this drop opens the path for more upside. There will some retrace now and might sweep that low, but I believe the next bigger move is to the upside. But lets monitor the price action a bit more to understand a bit more about the probability of the future path the price will take.

BTCUSDT Elliott Waves AnalysisHello friends.
Please support my work by clicking the LIKE button👍(If you liked). Also i will appreciate for ur activity. Thank you!
Everything on the chart.
Nothing has changed from my last idea.
Long confirmation - consolidation above dynamic resistance (white line on top) Then the target will be 33-36k.
Confirmation of the fall - breaking through 27k, then we go to the +-25k zone, there we will need to look at the structure of the fall and make some decision
Good luck everyone!
Follow me on TRADINGView, if you don't want to miss my next analysis or signals.
It's not financial advice.
Dont Forget, always make your own research before to trade my ideas!
Open to any questions and suggestions

BTCUSDT at dailly support, likely to head to 28176-28266The price has hit the daily support and likely to bounce from there. A long is favorable here. The target should be 28176-28266.

📈BTC analysis near release of CPI data📉BINANCE:BTCUSDT
COINBASE:BTCUSD
Hey everyone, first take a look at my previous BTCUSDT & ETHUSDT analysis and positions.
Bitcoin may experience growth near this month's CPI data release event if inflation conditions improve.
The trend is still bearish and the price takes another step for further correction with each rise
Don't forget to risk-free your position.
Please share ideas and leave a comment
let me know what's your idea.
CrazyS✌


HelenP. I Bitcoin has tested support of triangle and may to riseHi folks today I'm prepared for you BITCOIN analytics. After the price rebounded from the support zone 27350-27100 in early April, it continued the local uptrend, broke through the resistance zone 28800-29100 and rose to the level of 31000. Bitcoin ended the local uptrend, rebounded from resistance at level 31,000 and began to fall. For a long time, price created a descending triangle, in which it is still trading. After breaking down the resistance of the triangle, which corresponds to the trend line, the price could not fix in above, come back continued the local downtrend and broke through the current support zone. Bitcoin went down and re-tested zone 27350-29100, which is a support for the triangle and increased. Currently, the price is trading over the support zone and may continue to rise. It seems to me that Bitcoin can continue the local downtrend, but at first it can make a deep upward correction. The price can reach the resistance zone, so the targets will be set at 28150 and in the zone 28800-29100. If you like my analytics you may support me with your like/comment ❤️


Opportunity to do long BTC/USDTToday, Bitcoin continues to maintain a narrow volatile market. Judging from the structural trend, Bitcoin maintains a volatile upward trend. Recently, the K-line has appeared many times, announcing that the short-term decline is basically over. , Then the next step may be to go long at a low level.So in short-term trading, we can execute according to the following trading rhythm.
1.At present, the short-term support focuses on the position of 28600-28800, and the support area can consider going long BTC/USDT in small batches.
2.Further support is at the position of 28000-28200, and the support area is long BTC/USDT.
3.The pressure carried above is on the 29000-29200 line. If the resistance area can be broken through strongly, the increase is expected to continue, that is, the 29800-30000 position.
The above are the key areas of BTC that need to be paid attention to in the short term and the general trading rhythm, and I will announce the more detailed trading rhythm and entry position in my channel.If you want to grasp the detailed trading rhythm and master accurate trading signals, you can enter my channel.

BTCUSDT likely to head towards 29090This is another attempt for a long trade. It seems that price will find some support here and head towards the smaller time frame resistance around 29090 area.

BTCUSDT at 4h support, long favorable towards 29400The price has hit the 4h support area 4HS1. I think a long is favorable here. It is a bit of risky trade so small size with small stop loss range. Target should be 29400.

Btc Quick Update | Crypto Wolf BTCUSDT
Testing the triangle pattern support here. I am expecting a bounce back from this level towards 32,000, but in case of a breakdown, we will clearly see a downtrend towards 26,000
Dyor

BTC : Phase E, According to WYCKOFFBINANCE:BTCUSDT
Hi Traders, Investors and Speculators of the Charts 📈📉
Ev here. Been trading crypto since 2017 and later got into stocks. I have 3 board exams on financial markets and studied economics from a top tier university for a year.
The goal of looking at a chart from a Macro time frame perspective is to identify the current market phase / cycle. When we look at the BTCUSDT chart and overlay the Wyckoff Method Accumulation, it's clear that the price action is currently trading in Phase D, about to move to Phase E after the SOS. If you're looking for more details on Wyckoff Method Technicals , see here :
_______________________
📢Follow us here on TradingView for daily updates and trade ideas on crypto , stocks and commodities 💎Hit like & Follow 👍
We thank you for your support !
CryptoCheck

BTCUSDT likely to head to 29800 and aboveIt seems price would like to hit the top of the weekly resistance zone which is around 30000. Likely that a long is favorable here. I am in a long trade here targeting 29800.

BTC on long-term basisHello traders, after the current dump of BTC, I expect a retest back to the area of 30-31k, and then we can short it from there again and our last target is the area of 20,000..
enjoy trading <3

BTCUSDT at 4h support, likely to head to daily resistance againSo the price did hit the daily resistance as mentioned in the last post, however, could not breach it. The price has now fell down to 4HS2 level which is another long opportunity. Lets try this long from that support to the daily resistance.

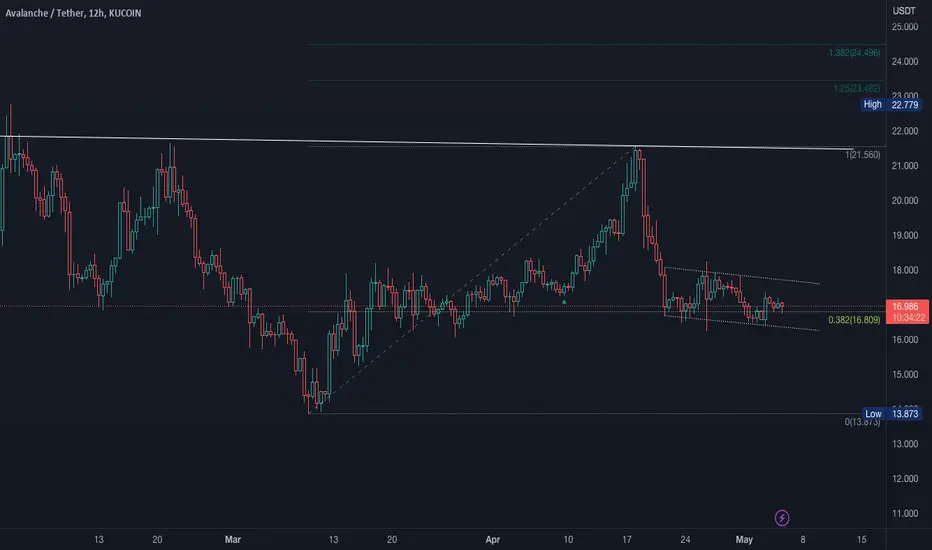
AVAX FLAG!KUCOIN:AVAXUSDT
AVAX sitting in a possible bear flag and looks like retesting the 382 (tempting!).
In consolidation at the moment. Break upwards will provide potential to 21.56 zone.
Break down, look for holding to 13.87 zone.
Uncertainty in US markets with potential of further bank collapses.
Bitcoin will run in this event providing upside to this potential setup.
Key: Let the market show you the direction.
Always having Plan A and Plan B scenarios so we can react once the markets provide an opportunity to execute our edge.
If you liked this idea or if you have your own opinion about it, write in the comments.
The information and publications are not meant to be, and do not constitute, financial, investment, trading, or other types of advice or recommendations.
BTCUSDT likley to head above daily resistance around 29360The price was pushed back from daily resistance and found support on 4h support area around 29050. I believe the price is going to push higher here. Not sure if it can break the resistance conclusively but there will be a fair attempt for the same.

BTCUSDT trading under daily and weekly resistanceThe price again hit the daily resistance overnight but got pushed down again and it is trading again below that resistance. But there is more case for the price to push up through the resistance rather than breaking down. I will observe it for while and then post a trade setup.
