SPX 500 - simple trade idea- daily 200 MA
- lower trendline of the broadening wedge
- 5750 is 0.382 fib from 5 aug 2024 to 19 feb 2025
you can expect a bounce around 5750 that could lead to new ATH around mid april/may
if close daily below the trendline maybe hard times ?
lets follow the arrows
Confidence 5/10 as i'm not trading stocks
Bullish Patterns

$BTC CME Futures Gap - Market Makers Flash Crash to FillI don't think I've ever seen market makers try to fill a CME Gap this fast in the history of CRYPTOCAP:BTC Futures.
I wonder WHY they want to fill it so fast 🧐
HODL ✊

YGG ANALYSIS🚀#YGG Analysis :
🔮#YGG is consolidating in a parallel channel.... currently falling from its resistance zone. It is trading above its major support zone and there maybe a small retest towards lower supprt level and after that we will see a bullish move📈📈
🔰Current Price: $0.2400
🎯 Target Price: $0.2900
⚡️What to do ?
👀Keep an eye on #YGG price action. We can trade according to the chart and make some profits⚡️⚡️
#YGG #Cryptocurrency #TechnicalAnalysis #DYOR

Falling Resistance Trendline Breakout on 2 hr Timeframe.Hello everyone, i hope you all will be doing good in your life and your Trading as well. Today i have analysed gold chart and found it has given breakout of falling resistance trendline, i am expecting momentum for upside in this. Probability is high it should travel towards our target area. The volume has been increasing, suggesting strong buying interest, and the RSI at 62.32 is in the bullish zone, confirming the upward momentum. Additionally, the MACD crossover adds further confidence to this bullish setup. The ideal entry point is when the price breaks above the resistance at 2,955.16 . Set the stop loss just below the support level at 2,860.96 to manage risk. For targets, consider aiming for 2,965.00 , 2,975.00 , and 2,985.00 , with the final target around 2,995.00 . If the breakout holds, this setup could present a strong uptrend continuation.
Disclaimer:- This analysis is for educational purposes only. Please trade responsibly and consult a financial advisor before making any decisions.
If you found this analysis helpful, don’t forget to like, follow, and share your thoughts in the comments below! Your support keeps me motivated to share more insights. Let’s grow and learn together—happy trading!

ETH, Next Stop => $2,750Hello TradingView Family / Fellow Traders. This is Richard, also known as theSignalyst.
📌 ETH rejected the lower bound of the falling channel and the $2,100 - $2,250 support zone.
What’s next?
ETH remains in a correction phase, and a move toward the upper bound of the channel at $2,750 is expected.
🏹 As it retests the support zone, we will be looking for new short-term long opportunities.
📚 Always follow your trading plan regarding entry, risk management, and trade management.
Good luck!
All Strategies Are Good; If Managed Properly!
~Rich

XRP - Strong Support Ahead!Hello TradingView Family / Fellow Traders. This is Richard, also known as theSignalyst.
📈XRP has been in a correction phase trading within the falling orange channel and it is currently retesting the lower bound of it.
Moreover, the green zone is a strong structure and round number $2.
🏹 Thus, the highlighted blue circle is a strong area to look for buy setups as it is the intersection of structure and lower orange trendline acting as a non-horizontal support.
📚 As per my trading style:
As #XRP approaches the blue circle, I will be looking for bullish reversal setups (like a double bottom pattern, trendline break , and so on...)
📚 Always follow your trading plan regarding entry, risk management, and trade management.
Good luck!
All Strategies Are Good; If Managed Properly!
~Rich

Bullish swing on DELL?🔉Sound on!🔉
📣Make sure to watch fullscreen!📣
Thank you as always for watching my videos. I hope that you learned something very educational! Please feel free to like, share, and comment on this post. Remember only risk what you are willing to lose. Trading is very risky but it can change your life!

03/03/25 Weekly outlookLast weeks high: $96,500
Last weeks low: $78,297.13
Midpoint: $87,398.56
What a week! In my last weekly outlook I proposed the idea that BTC was coiling up for a big move, the question was "which direction will the move be?" Well we got our answer, after, multiple weeks hovering around the $96K level bitcoin sold off a massive 18% to a low of $78.2k. This sell-off broke the weekly support area of $91K after a full 3 months of holding.
Now that we answered last weeks question I propose a new one, is $91K now a HTF resistance level? To answer that question a look at the weekly chart, despite such a severe sell-off this is not unusual in a bull market, 25-25% corrections happen multiple times during a large bullish trend. To add to that, the weekly close still managed to be above the $91K mini range floor, in essence a giant SFP on the weekly candle and therefore a continuation high would make sense from a TA point of view.
For the bulls the worry would be the inevitable backfilling of the wick on the weekly, for me this comes into play if we have acceptance back below $91K, entirely possible.
On Friday 7th March President Trump is holding a Cryptocurrency summit at the white house, this will include David Sacks (crypto & AI czar), Founders, CEOs and members of the digital assets group. This comes off the back of confirmation of the "Crypto Strategic Reserve" that will contain BTC, ETH, SOL, XRP & ADA and was announced yesterday. I do not believe in coincidences so the timing of this is very interesting to me, to announce this on a weekend with very thin orderbooks and low volume after such a big sell-off had to be done on purpose IMO. The timing would guarantee a swift rally, I also believe the sell-off could be related to this announcement too, if a market maker like the US government has the means to create a more optimal entry, they will do just that.
I could see the market being very cautious up until Friday, the $91K is a key S/R level and will determine if bitcoin backfills the weekly wick or moves up to weekly high.

GOLD BULLS ARE STRONG HERE|LONG
Hello, Friends!
GOLD pair is in the downtrend because previous week’s candle is red, while the price is clearly falling on the 12H timeframe. And after the retest of the support line below I believe we will see a move up towards the target above at 2,951.561 because the pair oversold due to its proximity to the lower BB band and a bullish correction is likely.
✅LIKE AND COMMENT MY IDEAS✅

CAD/JPY SENDS CLEAR BULLISH SIGNALS|LONG
Hello, Friends!
We are now examining the CAD/JPY pair and we can see that the pair is going down locally while also being in a downtrend on the 1W TF. But there is also a powerful signal from the BB lower band being nearby indicating that the pair is oversold so we can go long from the support line below and a target at 108.118 level.
✅LIKE AND COMMENT MY IDEAS✅

Can we go for a R/R2 Buy Position on AUSUSD?After the big drop seems that it'll have correction to 0.63...
This is only an idea...
Please manage your risk...

$SOL smashes through the EMA9 and SMA20 above $170CRYPTOCAP:SOL smashes through the EMA9 and SMA20.
Looking for the cross for confirmation.
As previously mentioned, that green box was critical to clear $170.
Need a cluster of closes above this.
My 4x LONG is happy rn 🥳

ada buy limit midterm"🌟 Welcome to Golden Candle! 🌟
We're a team of 📈 passionate traders 📉 who love sharing our 🔍 technical analysis insights 🔎 with the TradingView community. 🌎
Our goal is to provide 💡 valuable perspectives 💡 on market trends and patterns, but 🚫 please note that our analyses are not intended as buy or sell recommendations. 🚫
Instead, they reflect our own 💭 personal attitudes and thoughts. 💭
Follow along and 📚 learn 📚 from our analyses! 📊💡"

NQ1! BULLS ARE GAINING STRENGTH|LONG
Hello, Friends!
It makes sense for us to go long on NQ1! right now from the support line below with the target of 21,431.75 because of the confluence of the two strong factors which are the general uptrend on the previous 1W candle and the oversold situation on the lower TF determined by it’s proximity to the lower BB band.
✅LIKE AND COMMENT MY IDEAS✅

AUD/JPY BUYERS WILL DOMINATE THE MARKET|LONG
Hello, Friends!
Bullish trend on AUD/JPY, defined by the green colour of the last week candle combined with the fact the pair is oversold based on the BB lower band proximity, makes me expect a bullish rebound from the support line below and a retest of the local target above at 95.226.
✅LIKE AND COMMENT MY IDEAS✅

DXY to Retest $108 - Slight Pain May Lay AheadDXY fractal from 2017 is playing out nicely.
Looks like it will retest $108 mid-March and break $106 in early April (hopefully before).
This lines up perfectly with the Global M2 (12-Week Lead) liquidity injection.

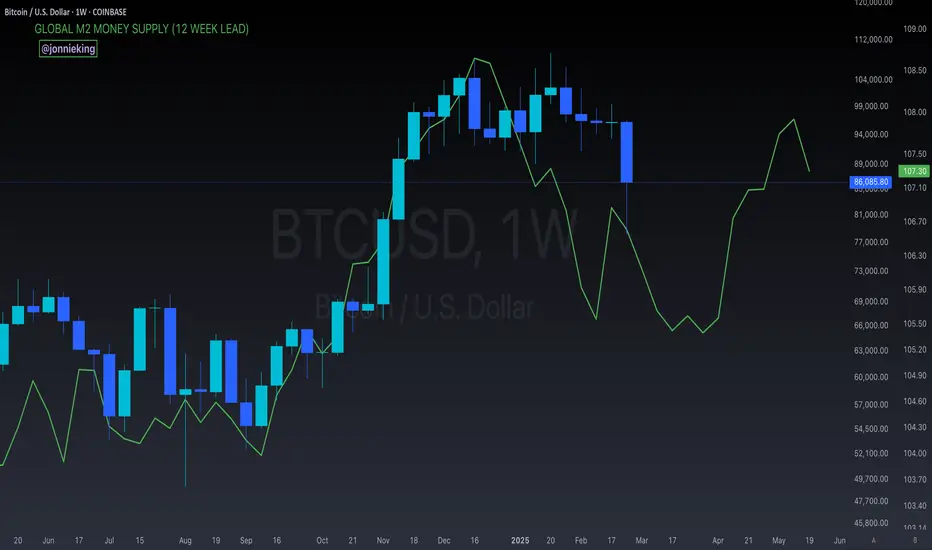
$BTC with Global M2 Money Supply (12-Week Lead)Shows a big liquidity injection coming in early April.
Might be a bit bumpy until then 🎢
Is it still a bull market? Or are we already in a bear market?If it's still a bull market, what phase are we in?
Of course, President Trump has complicated all this, as he is taking political and economic steps to stabilize the American economy. For example, the tariffs that he uses as a tool to achieve his goals faster. In other words, in trading terms, leverage. With those tariffs, he turned on the x100 lever and achieved in 2 days what could have taken several years to negotiate. And maybe another president wouldn't have succeeded at all.
Of course, this has a negative impact on the market, as investors don't know what to expect from the market. That's why they are withdrawing their money from the market in general. The same applies to the stock market.
Since America is the strongest economy in the world at the moment, this is also reflected in the world markets in general.
Of course, crypto is taking the most of this, as it is a relatively young market and is still perceived as very risky.
We are in a bull market phase, where we should be growing. But we are not growing because of such a strong fundamental. On the contrary, the market is bleeding. That's why everyone is arguing about whether we are still in a bull market.
When I look at the Bitcoin chart, it seems to me that we are probably not in a bull market anymore.

USDT.D Macro Update ( Alt Season ? )everything on the charts
I'm still holding my alts
For traders, this is one of the best charts in town (to find local tops and bottoms for potential swing opportunities)
This tells the whole story
If Invalidation occurs, I'll reconsider all my traders.
(not in the mood of writing much, check out the previous posts for more explanation + everything's on the chart)

BTC.D - Alt Season (Rotation from BTC to ALTS about to begin)only 3 charts you should care about from now = BTC.D , USDT.D and Total 2 (/3/others)
strong utility tokens will win from here
CRYPTOCAP:BTC is weak, (IT WILL DEFINITELY HAS ITS LAST RALLY THOUGH - check out my EW count and the target I've been speaking since 5th Aug)
either it consolidates here and complete its subwave 5 of macrowave 5 later or do it now and distributes later, the time for alts to shine has come...
Few more weeks of pain left. I don't recommend selling here, keep the HODL
but rotation has almost started... whales are taking profits on Bitcoin and time for our shitcoins to outperform from here...
PS. We might see new lows (than 3rd Feb) but the RR is not worth it, never sell in the middle (unless you are invalidated)
Look at the Macro chart for in-detailed analysis on BTC.D I did a few weeks ago

$BTC Macrolast idea remains intact—we are still bullish. Alts have held strong while BTC plunged. (I don’t own any BTC, and neither should you above $100K.)
I predicted the exact $15.5K bottom on X, as well as the August 5th crash and bottom. Unfortunately, I wasn’t on the charts in December and missed the biggest, clearest signal on USDT.D for a potential local top, which otherwise would have 2x'd my current portfolio but mistakes were made)
BTC taking the hits while alts hold steady is a strong sign that whales are taking profits from Bitcoin and preparing for "rotation".
Most traders believe the cycle is over—and there are valid reasons for that (some of them are):
- A monthly bearish engulfing candle
- A structure resembling the 2021 top, suggesting one last rally before the bear market
- Worst of all, double bearish divergence on the monthly, which worries me too
However, there are strong counterarguments.
The biggest? The cycle has never topped with BTC.D this weak. That’s why I’m still leaning toward a bullish scenario until proven otherwise.
Update on the above chart:
The parabola is intact with a beautiful reaction. That doesn’t mean we can’t still visit the red box—there’s only air between them—but I’m holding, and that remains my primary scenario.
Alts can make new lows, but RR isn’t worth it. As I’ve said before, the time to sell spot bags has passed. You don’t sell in between unless invalidation occurs.
Timing is everything. We failed to time this market, assuming it would mimic past cycles—but everyone was wrong. Traders won this cycle, while investors (except BTC holders) struggled... until now, at least.
ONLY DIFFERENCE BETWEEN BOTH SCENARIOS (MENTIONED ON CHART) FOR ALTS?
You have to wait way longer on the second scenario but both would take us to our goal.
Worst case? We break and HTF close on USDT.D - last hope, officially ending bull market!

USOIL BULLISH BIAS RIGHT NOW| LONG
Hello, Friends!
USOIL downtrend evident from the last 1W red candle makes longs trades more risky, but the current set-up targeting 73.32 area still presents a good opportunity for us to buy the pair because the support line is nearby and the BB lower band is close which indicates the oversold state of the USOIL pair.
✅LIKE AND COMMENT MY IDEAS✅

NZD/JPY BEST PLACE TO BUY FROM|LONG
Hello, Friends!
NZD/JPY pair is in the uptrend because previous week’s candle is green, while the price is evidently falling on the 1D timeframe. And after the retest of the support line below I believe we will see a move up towards the target above at 86.006 because the pair is oversold due to its proximity to the lower BB band and a bullish correction is likely.
✅LIKE AND COMMENT MY IDEAS✅
