$SOL Epic 18% Rally to End the Month!What an epic day for CRYPTOCAP:SOL today with an 18% rally!
Closed the month outside of that accumulation zone I mentioned in previous TA, which is very promising.
Looking for SOL to build a cluster this next week outside that range, and then make another leg up into the green zone to reclaim the EMA9.
Take it level by level 👍
Bullish Patterns

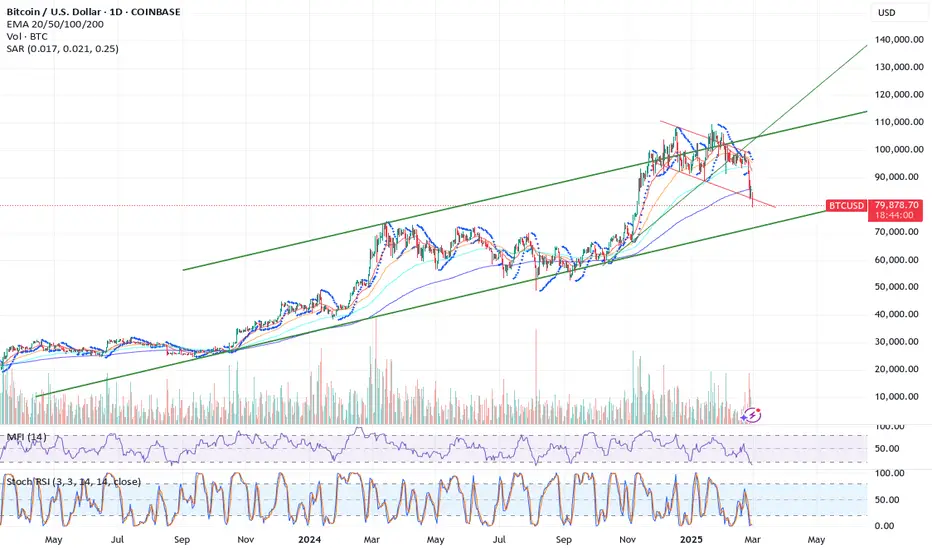
$BTC Critical Support Retest at 50WMA - Must Read!50WMA is a CRITICAL SUPPORT to watch for ₿itcoin.
Historically, if CRYPTOCAP:BTC closes below it for more than one week, it signals the beginning of the BEAR MARKET.
We’ve only seen BTC close beneath the 50WMA once in its history during a Post-Halving year, and that was in 2021, but then rallied to a new ATH.
People often ask me what would invalidate my bull market thesis;
this is one of them.
I’ll be watching this support very closely, and if BTC closes below it for more than 2 weeks, i’m probably selling a good portion of my stack until we get more clarity in the market.
However, this could very well have been the bottom of this correction.
BTC is known to have a big Q1 drawdown in Post-Halving years.
2013 was a massive -82% correction over a week.
2017 gave us two.
January -34% over 7 days.
March -33% over 14 days.
January 2021 gave us -31% over 14 days.
The current correction we’ve seen with BTC has been the longest over 35 days with -28%.
$75k would be a -31% correction, which would line up perfectly with the previous cycle.
That’s the line in the sand for me.
If we did see the bottom with this 28% correction, that would line up with the diminishing return theory.

BBRI BUY NOW 3350! Support level at 3050-3150BBRI is now probably trade in the end of its deep correction, as on the technical view, by the Elliot Waves count, it is now completing the WAVE 5 of C (it confirmed by the Bullish Divergence on MACD).
The price could be be a little lower on the next 1-5 trading days to the 3050-3150, which is the 78.6% fibonacci retracement from broken uptrend. It is really strong support and i believe i would not be broken.
For about 6-12 months ahead, aim for minimum target of 30% return from this level.
Are you going with me???
CHEEERRRSSS...

PERFECT ELLIOT WAVE CORRECTION DETECTED ON ADAUSDI believe last drop has just accomplished the end of wave C.
We are ready to go to the next impulse wave up!
LET'S GO ADAUSD..
CHEEERRRSSS...!!!

EUR/USD at a Pivotal Level – Will Bulls Push Higher?The EUR/USD pair is showing signs of a trend reversal after breaking above a long-term descending trendline. This breakout, coupled with an inverse head and shoulders pattern and RSI bullish divergence, signals strengthening bullish momentum. However, the price faces key resistance around 1.0500-1.0527, aligned with the 200 EMA.
A confirmed break above this level could push the pair toward 1.10+, while failure to do so may lead to a pullback before another attempt higher.

doge midterm buy"🌟 Welcome to Golden Candle! 🌟
We're a team of 📈 passionate traders 📉 who love sharing our 🔍 technical analysis insights 🔎 with the TradingView community. 🌎
Our goal is to provide 💡 valuable perspectives 💡 on market trends and patterns, but 🚫 please note that our analyses are not intended as buy or sell recommendations. 🚫
Instead, they reflect our own 💭 personal attitudes and thoughts. 💭
Follow along and 📚 learn 📚 from our analyses! 📊💡"

LONG $900BMorning fellas,
I have been getting some spite, and about 75% of people who follow me stopped liking or commenting on my posts just because I've been sold since $100k and calling non-stop for this drop.
The drop came, and the moonfellas out there finally gave in.
Now it's time to look for longs and nothing better than a few select alt coins. I'm thinking $888B to $900B should hold and then we fly. Check trajectory line.
You people need to stop only posting that it's going up to the moon, and be realistic about things. Buy blood not green, buy LINK at $7 and not $25. Buy dot at $2 and not $15, and so on.
Trade thirsty, my friends.

USDJPY - BULLISH SCENARIOHello Traders !
On Thursday 20 FEB, The USDJPY reached the support level (149.356 - 148.639) and failed to break it !
So, We have a bullish scenario:
If the price breaks and closes above the lower high (150.733 - 150.469),
We will see a bullish move🚀
_______________
TARGET: 153.700🎯

BTCUSD - Is this a bottom ?- Simple support channel trendline from sep 2023 and aug 2024
- daily rsi oversold like crazy
- 81k3 : 1 fib extension from low 2018 to high 2021 and low 2022
- 79204 : 0.5 fib retracement from low aug 2024 to ATH
- bullish div on lower timeframes
Those are strong bullish supports from high timeframes
watch out for another try from bears like 11 sep 2023 or 6 sep 2024 but I’m expecting more than a bounce from this

BITCOIN LONG FROM SUPPORT
Hello, Friends!
We are going long on the BITCOIN with the target of 92,210 level, because the pair is oversold and will soon hit the support line below. We deduced the oversold condition from the price being near to the lower BB band. However, we should use low risk here because the 1W TF is red and gives us a counter-signal.
✅LIKE AND COMMENT MY IDEAS✅

AUD/CHF BULLS WILL DOMINATE THE MARKET|LONG
Hello, Friends!
AUD/CHF is making a bearish pullback on the 1D TF and is nearing the support line below while we are generally bullish biased on the pair due to our previous 1W candle analysis, thus making a trend-following long a good option for us with the target being the 0.566 level.
✅LIKE AND COMMENT MY IDEAS✅

NZD/CHF SENDS CLEAR BULLISH SIGNALS|LONG
Hello, Friends!
The BB lower band is nearby so NZD-CHF is in the oversold territory. Thus, despite the downtrend on the 1W timeframe I think that we will see a bullish reaction from the support line below and a move up towards the target at around 0.510.
✅LIKE AND COMMENT MY IDEAS✅

EURCAD - Follow The Trend!Hello TradingView Family / Fellow Traders. This is Richard, also known as theSignalyst.
📈EURCAD has been in a correction phase and it is currently approaching the lower bound of the blue channel.
Moreover, the green zone is a strong support zone.
🏹 Thus, the highlighted blue circle is a strong area to look for buy setups as it is the intersection of support and lower blue trendline acting as a non-horizontal support.
📚 As per my trading style:
As #EURCAD approaches the blue circle, I will be looking for bullish reversal setups (like a double bottom pattern, trendline break , and so on...)
📚 Always follow your trading plan regarding entry, risk management, and trade management.
Good luck!
All Strategies Are Good; If Managed Properly!
~Rich
Disclosure: I am part of Trade Nation's Influencer program and receive a monthly fee for using their TradingView charts in my analysis.

INJ Long OpportunityMarket Context:
INJ has retraced into a strong support zone, presenting a high-probability long trade for a potential rebound.
Primary Trade Setup:
Entry: $13.00 - $12.00
Take Profit Targets:
$16.00
$18.00
Stop Loss: Below $11.30
Secondary Trade Setup (Deeper Support):
Entry: $10.00 - $9.50
Take Profit: Adjust based on price action
Stop Loss: Below $9.00
This setup targets a bounce from major support, with the potential for a stronger rally if bullish momentum returns. 🚀

Starbucks (SBUX) AnalysisCompany Overview:
Starbucks NASDAQ:SBUX is executing a strategic turnaround, focusing on barista wages, store renovations, and menu optimization to enhance efficiency and customer experience.
Key Catalysts:
Loyalty & Digital Engagement 📊
34.6M U.S. Rewards members now drive 57% of total sales.
Personalized offers and data-driven engagement are boosting customer retention and spending.
China Expansion & Growth Potential 🌏
Despite a 4% decline in same-store sales, Starbucks opened 169 new stores, reinforcing its long-term commitment to China.
The region remains a key growth driver, with opportunities for premiumization and digital adoption.
Financial Strength & Shareholder Returns 💰
SEED_TVCODER77_ETHBTCDATA:5B in share buybacks could increase EPS by 3-4% annually.
A SEED_TVCODER77_ETHBTCDATA:1B sustainability bond aligns with ESG-focused institutional investors.
Investment Outlook:
Bullish Case: We are bullish on SBUX above $97.00-$98.00, driven by loyalty growth, operational improvements, and capital efficiency.
Upside Potential: Our price target is $160.00-$165.00, reflecting strong turnaround execution and long-term expansion.
📢 Starbucks—Brewing Growth with Digital Innovation, Expansion, and Shareholder Returns. #SBUX #StockMarket #LoyaltyEconomy

BTC to $72k-$73k to test major supportWe tried to break out of this long term channel and we were rejected like a nerd on prom day. We were tracking a short/medium term descending channel and now we have broken out of that and fast heading for bottom of overarching ascending channel. another really bit of ominous sign is we lost our 200 day moving average, this also puts us at threat of a death cross over the next month or so. Also note the rest of the crypto market for the most part, looks worse than BTC, many are at multi year lows, many have broken their multi-year ascension, few charts look appealing in crypto right now... But we are still inside that long term ascending channel and therefore, still in a bullish trend overall but a lot of things are piling up against it.
So we will look to catch support at around $72- FWB:73K and then hopefully climb back up this channel. If we break the bottom of this two year ascending channel the lows could be a lot lower. The only thing that makes this a little shaky right now is that Ethereum just broke its two year ascending pattern, could it be a sign of whats to come for BTC?
Stay vigilant, personally I would not consider a long before we test that bottom of channel, and even there I would urge tight stop losses for those trying to take advantage of the situation. That also stands for any crypto, never trade any alts and such without also watching BTC, when BTC is unhappy, generally the rest of the market is even more unhappy.
As always, my posts are informational, DYOR.
BTC At Critical Support on 200DMA + RSI Way Oversold₿itcoin testing critical support on the 200DMA 🚨
Last time it closed under on July 4, 2024 it ranged for 101 days.
RSI hasn't been this oversold since August, 2023.
Last time BTC was at this RSI level and closed under the 200DMA it ranged for 60 days.
HOWEVER, the only time BTC has ever closed under the 200DMA on a Post-Halving year was in May 2021, where it then went on to rally to another new ATH.
I'm personally buying here 💯

LONG ON NAS100Nas is oversold and has rejected a major demand area.
I will be buy nas to the next resistance level

NASDAQ Potential UpsidesHey Traders, in today's trading session we are monitoring NAS100 for a buying opportunity around 20650 zone, NASDAQ is trading in an uptrend and currently is in a correction phase in which it is approaching the trend at 20650 support and resistance area.
Trade safe, Joe.

USDCHF Potential UpsidesHey Traders, in today's trading session we are monitoring USDCHF for a buying opportunity around 0.89000 zone, USDCHF is trading in an uptrend and currently is in a correction phase in which it is approaching the trend at 0.89000 support and resistance area.
Trade safe, Joe.

ADA Long OpportunityMarket Context:
ADA has retraced into a key support zone, offering a strong risk-to-reward opportunity for a potential bounce.
Trade Details:
Entry Zone: $0.63 - $0.69
Take Profit Targets:
$0.84 - $0.86
$0.96 - $1.00
Stop Loss: Just below $0.60
This setup anticipates buyers stepping in at support, with the potential for upside continuation if momentum strengthens. 🚀

GOLD BUYERS WILL DOMINATE THE MARKET|LONG
Hello, Friends!
GOLD is trending up which is obvious from the green colour of the previous weekly candle. However, the price has locally plunged into the oversold territory. Which can be told from its proximity to the BB lower band. Which presents a classical trend following opportunity for a long trade from the support line below towards the supply level of 2,947.627.
✅LIKE AND COMMENT MY IDEAS✅

On a Different SKALE: SKL Analysis!Hello TradingView Family / Fellow Traders. This is Richard, also known as theSignalyst.
📈SKL has been in a correction phase trading within the falling red wedge pattern and it is currently retesting the lower bound of it.
Moreover, the green zone is a strong support.
🏹 Thus, the highlighted blue circle is a strong area to look for buy setups as it is the intersection of support and lower red trendline acting as a non-horizontal support.
📚 As per my trading style:
As #SKL is around the blue circle, I will be looking for bullish reversal setups (like a double bottom pattern, trendline break , and so on...)
📚 Always follow your trading plan regarding entry, risk management, and trade management.
Good luck!
All Strategies Are Good; If Managed Properly!
~Rich
