GBP/USD Double Top (11.03.2025)The GBP/USD Pair on the M30 timeframe presents a Potential Selling Opportunity due to a recent Formation of a Double Top Pattern. This suggests a shift in momentum towards the downside in the coming hours.
Possible Short Trade:
Entry: Consider Entering A Short Position around Trendline Of The Pattern.
Target Levels:
1st Support – 1.2784
2nd Support – 1.2724
🎁 Please hit the like button and
🎁 Leave a comment to support for My Post !
Your likes and comments are incredibly motivating and will encourage me to share more analysis with you.
Best Regards, KABHI_TA_TRADING
Thank you.
Chart Patterns

GOLD ROUTE MAP UPDATEHey Everyone,
PIPTASTIC day on the markets today with our chart idea playing out as analysed. Yesterday we had the break below 2901 bearish target, opening the first level of the retracement range at 2878, which just fell short by a few pips. This then provided the support for the bounce all the way into 2922 completing our Bullish target. We were able to take the ride up all the way from the retracement range, inline with our plans to buy dips
We are now looking for a lock above 2922 for a continuation or failure to lock will see price reject into the lower Goldturns for support and bounce, also keeping in mind the small gap left on the retracement range
We will keep the above in mind when taking buys from dips. Our updated levels and weighted levels will allow us to track the movement down and then catch bounces up.
We will continue to buy dips using our support levels taking 30 to 40 pips. As stated before each of our level structures give 20 to 40 pip bounces, which is enough for a nice entry and exit. If you back test the levels we shared every week for the past 24 months, you can see how effectively they were used to trade with or against short/mid term swings and trends.
BULLISH TARGET
2922 - DONE
EMA5 CROSS AND LOCK ABOVE 2922 WILL OPEN THE FOLLOWING BULLISH TARGET
2947
EMA5 CROSS AND LOCK ABOVE 2947 WILL OPEN THE FOLLOWING BULLISH TARGET
2968
BEARISH TARGETS
2901 - DONE
EMA5 CROSS AND LOCK BELOW 2901 WILL OPEN THE FOLLOWING RETRACEMENT RANGE
2878 - 2851
EMA5 CROSS AND LOCK BELOW 2851 WILL OPEN THE SWING RANGE
SWING RANGE
2820 - 2796
As always, we will keep you all updated with regular updates throughout the week and how we manage the active ideas and setups. Thank you all for your likes, comments and follows, we really appreciate it!
Mr Gold
GoldViewFX

Will Solana drop 26% before finding support at $90?Hello and greetings to all the crypto enthusiasts, ✌
All previous targets were nailed ✅! Now, let’s dive into a full analysis of the upcoming price potential for Solana 🔍📈.
Solana remains in a downward channel, with a projected additional decline of at least 26% in the short term. A key support level at $90 is expected to be retested before any sustainable upward momentum can develop. The $100 mark serves as a significant psychological resistance, influencing market sentiment. Along the way, temporary bullish movements and short-lived green candles are natural fluctuations within the broader downtrend.📚🙌
🧨 Our team's main opinion is: 🧨
Solana is in a downtrend, likely dropping another 26% to retest $90, with $100 as key resistance, while brief upward moves are expected. 📚🎇
Give me some energy !!
✨We invest hours crafting valuable ideas, and your support means everything—feel free to ask questions in the comments! 😊💬
Cheers, Mad Whale. 🐋

Bitcoin Teeters on $80K Edge: Will It Hold or Fold?Bitcoin is currently priced at $81,145, reflecting a volatile recovery after dipping to $78,000 recently. This movement comes amid a broader cryptocurrency market downturn, with the total market cap dropping 4.4% in the last 24 hours, dragging down major altcoins and fueling a cautious mood among traders. The lack of strong bullish momentum suggests Bitcoin may struggle to push higher unless market sentiment shifts significantly.
Technical Indicators and Key Levels
Technically, Bitcoin is hovering near a pivotal support at $80,000, a level with both psychological and historical significance. The price is trading below the 20-period moving average of around $81,500, signaling a short-term bearish tilt. The Relative Strength Index (RSI) at 45 shows neutral momentum, with no immediate signs of exhaustion in either direction. Resistance looms at $82,000, a barrier that previously halted upward moves. A decisive move above this level could spark optimism, but failure to defend $80,000 risks further declines.
Potential Scenarios and Trading Considerations
Two scenarios dominate the 1-hour chart. A hold above $80,000, followed by a break past the 20-period moving average, could pave the way for a push to $82,000, especially if volume picks up to validate the move. On the flip side, a drop below $80,000 might accelerate selling, targeting $78,000 or even $75,000, particularly if volume surges on the downside. Given the current volatility, traders should prioritize tight stop-losses and avoid excessive leverage to manage risks effectively.
Broader Context and Final Tips
Despite short-term uncertainty, Bitcoin’s long-term uptrend remains intact, as historical patterns suggest resilience over time. However, external triggers, like regulatory updates or economic data such as upcoming US inflation figures, could sway the market in either direction. Traders should monitor volume closely for confirmation of any breakout or breakdown and focus on how Bitcoin reacts at $80,000 support and $82,000 resistance. Staying disciplined, keeping risk in check, and adapting to real-time developments will be critical in this setup.
Note: Volume spikes are your cue, watch them to confirm any significant price action.

Ethereum Set to Drop 15%: $1,750 Target Ahead, Stay Alert!Hello and greetings to all the crypto enthusiasts, ✌
All previous targets were nailed ✅! Now, let’s dive into a full analysis of the upcoming price potential for Ethereum 🔍📈.
Ethereum is currently navigating within a downward channel, with the possibility of establishing a parallel channel. Based on technical indicators, there is a projected 15% decline toward the identified support level on the chart. This forecast aligns with prevailing market trends and resistance points. The primary target for Ethereum in this scenario is $1,750, and it’s crucial for investors to remain vigilant and adjust their strategies as market conditions evolve.📚🙌
🧨 Our team's main opinion is: 🧨
Ethereum is in a downward channel, and I’m expecting at least a 15% drop to the support level, with a target of $1,750, so investors should stay alert and adjust accordingly. 📚🎇
Give me some energy !!
✨We invest hours crafting valuable ideas, and your support means everything—feel free to ask questions in the comments! 😊💬
Cheers, Mad Whale. 🐋

XAU/USD: Another Fall Ahead ? (READ THE CAPTION)By analyzing the 2-hour timeframe for gold, we see that the price remains range-bound with no clear directional trend. Currently, gold is trading around the $2900 level, and if it fails to break above $2913 again, we can expect a downward correction. Potential targets for this correction are $2870, $2861, and $2853. Keep an eye on price reactions at each of these key levels, as all three could present opportunities for buy positions!
Please support me with your likes and comments to motivate me to share more analysis with you and share your opinion about the possible trend of this chart with me !
Best Regards , Arman Shaban

S&P500 - Donald Trump Is Crashing Markets!S&P500 ( TVC:SPX ) is starting a correction:
Click chart above to see the detailed analysis👆🏻
Since Donald Trump was elected the markets have been super volatile and clearly not too easy to trade. But now it seems like bears are slowly taking over the entire U.S. stock market after we just saw a drop of -10% within a couple of days and a correction becomes more and more likely.
Levels to watch: $6.100, $4.800
Keep your long term vision,
Philip (BasicTrading)

Bitcoin can fall to buyer zone and then start to growHello traders, I want share with you my opinion about Bitcoin. A while ago, the price entered a downward channel, where it immediately rebounded from the resistance line and dropped to the resistance level, which aligned with the seller zone. After that, BTC bounced back up, rising to the resistance line of the channel before falling to the support line. However, it quickly climbed back to the seller zone before continuing its decline within the downward channel. Later, the price reached the 99000 resistance level, reversed, and dropped to the support level, which coincided with the buyer zone. Eventually, it broke through this level, exiting the downward channel. After that, Bitcoin started trading within a triangle pattern, where it made a sharp upward impulse from the support line to the resistance line, followed by a correction to the 84400 support level. Recently, BTC rebounded from this level and attempted to grow but failed, and now it is trading near the support line of the triangle. In my view, Bitcoin could decline to the buyer zone, breaking out of the triangle pattern before beginning a new upward movement. Based on this, my target is set at 93000. Please share this idea with your friends and click Boost 🚀

Cup and handle pattern in weekly timeframeThe target of this pattern is 4.5 $
It's on weekly timeframe.
15 cent is strong support.

Bitcoin will reach at $221,0001. Overview of the Chart
Asset: Bitcoin (BTC) / USD
Timeframe: Daily (D)
Platform: TradingView
Date Range: Approximately mid-2023 to March 11, 2025
Current Price (as of Mar 11, 2025): $76,697.39 (shown in the top right corner)
2. Price Movement
Historical Trend: From mid-2023 to late 2024, Bitcoin shows a steady uptrend with some corrections. The price rises from around $25,000–$30,000 to a peak near $100,000 by late 2024.
Recent Action: After hitting a high around $100,000 in late 2024, the price corrects downward, dropping to around $75,000–$80,000 by early 2025. The current price as of March 11, 2025, is $76,697.39, indicating a slight recovery or stabilization after the correction.
3. Technical Patterns
Ascending Triangle
Formation: The chart shows an ascending triangle pattern from mid-2024 to late 2024. This pattern is characterized by:
A flat resistance line around $95,000–$100,000 (the horizontal line where the price struggles to break through multiple times).
An ascending support line (sloping upward), indicating higher lows as buyers step in at progressively higher prices.
Breakout: In late 2024, the price breaks above the resistance of the ascending triangle, reaching a high near $100,000. This breakout is typically a bullish signal, often leading to a continuation of the uptrend.
Target Calculation: The target for an ascending triangle breakout is often calculated by measuring the height of the triangle (from the base to the resistance) and projecting it upward from the breakout point. The height of the triangle appears to be roughly $30,000 (from the base around $65,000 to the resistance at $95,000). Adding this to the breakout point of $95,000 gives a target of approximately $125,000. However, the price only reached around $100,000 before correcting, suggesting the breakout may not have fully played out or was interrupted by market conditions.
Trendline
Upward Trendline: A long-term upward trendline (drawn in orange) connects the higher lows from mid-2023 onward. This trendline has acted as support during the uptrend.
Current Position: As of March 11, 2025, the price is testing this trendline around the $75,000–$80,000 level. This is a critical area to watch, as a bounce from this trendline would confirm continued bullish momentum, while a break below could signal a deeper correction.
4. Support and Resistance Levels
Support:
The long-term trendline around $75,000–$80,000 is a key support level.
If this trendline fails, the next significant support could be around the base of the ascending triangle, near $65,000.
Resistance:
The previous all-time high around $95,000–$100,000 is now a resistance zone. The price struggled to break above this level multiple times before the breakout and may face selling pressure if it approaches this zone again.
5. Price Action Analysis
Post-Breakout Correction: After breaking out of the ascending triangle, Bitcoin hit a high near $100,000 but failed to sustain the momentum, leading to a correction. This is not uncommon after a breakout, as markets often pull back to retest previous resistance (now support) or other key levels like the trendline.
Current Position: The price is at a critical juncture as of March 11, 2025. It’s testing the long-term trendline support around $76,000. The fact that it’s holding above this level (at $76,697.39) is a positive sign for bulls, but confirmation of a bounce with strong volume would be needed to signal a resumption of the uptrend.

Bitcoin - Bulls vs Bears: Who Will Win This Battle?Market overview:
Daily Timeframe
The daily chart is the foundation of this analysis, providing a macro perspective on Bitcoin’s current market structure. Price is trading between two critical zones, one acting as support and the other as resistance. These levels have historically played a significant role in Bitcoin’s price action, making them key areas to watch for potential breakouts or breakdowns.
Currently, Bitcoin has tested the lower support zone multiple times, showing that buyers are actively defending this level. However, each bounce has been met with selling pressure near the previous support-turned-resistance zone, which indicates indecision in the market. This price action suggests that Bitcoin is in a consolidation phase, where liquidity is building before a larger directional move.
There are two potential scenarios that will determine the next major trend:
Bullish Breakout:
If Bitcoin breaks above the resistance zone (the green-marked area on the chart), it would indicate a shift in market sentiment, with buyers taking control. This move would confirm that the recent downside movement was a temporary correction rather than a trend reversal. A clean breakout, followed by a successful retest of the level as support, would provide an ideal confirmation for a long position, targeting higher resistance levels.
Bearish Breakdown:
If Bitcoin loses the current support zone, it would confirm that sellers remain in control. A daily close below this level would likely trigger increased selling pressure, leading to a move towards lower support zones. In this case, a short position would be favored, with potential downside targets in mind.
Since price is still within this range, waiting for a confirmed breakout or breakdown is crucial before committing to a directional trade. Acting too soon, without confirmation, could lead to getting trapped in false breakouts or liquidity grabs.
4-Hour Timeframe – Liquidity Sweep & Bullish Reversal Signs
Looking at the 4-hour chart, Bitcoin has recently swept a major low, a move often associated with liquidity grabs. However, price did not close below this level, suggesting that the move was intended to trap sellers rather than initiate a true breakdown.
Liquidity sweeps occur when market makers push price below a previous low to trigger stop-losses and induce panic selling before reversing the price direction. This failure to break lower could be a sign that Bitcoin is gearing up for an upside move, but further confirmation is required.
1-Hour Timeframe – Key Level for a Bullish Breakout
The 1-hour chart further supports the bullish case, as it also shows a liquidity sweep of recent lows, similar to what was observed on the 4-hour timeframe. This confluence strengthens the idea that Bitcoin may be preparing for a move higher.
A key resistance level has been marked with a black line on the chart. This level represents the most recent structural high that must be broken and flipped into support to confirm bullish momentum.
Trading plan for a long position:
Break Above the Key High – Price must first move above the marked resistance level to signal strength.
Retest & Hold as Support – A successful retest of this level as new support would indicate that buyers are in control.
Entry for a Long Position – Once support is confirmed, a long position can be considered, targeting higher resistance levels.
If Bitcoin fails to break this level, the bullish thesis weakens, and attention should shift back to the daily support zone for potential bearish continuation.
Upcoming Bitcoin-Related News & Events to Watch
While technical analysis provides clear trade setups, macroeconomic events can heavily influence Bitcoin’s movement. Some key fundamental catalysts to watch in the coming days include:
CPI & Inflation Data (March 12, 2025) – Higher-than-expected inflation could negatively impact risk assets like Bitcoin, while lower inflation numbers could support a bullish breakout.
FOMC Meeting & Interest Rate Decision (March 20, 2025) – The Federal Reserve’s stance on interest rates will be crucial. A more dovish tone could provide a bullish tailwind for Bitcoin, while hawkish policy could lead to downside movement.
Final Thoughts
The daily range is the most critical structure to watch, whichever level breaks first will determine the trade setup.
The 4-hour liquidity sweep suggests potential bullish momentum but still needs confirmation.
The 1-hour key high must be broken and flipped into support before looking for long positions.
Macro events like CPI and Fed decisions could heavily impact Bitcoin’s movement.
__________________________________________
Thanks for your support!
If you found this idea helpful or learned something new, drop a like 👍 and leave a comment, I’d love to hear your thoughts! 🚀
Make sure to follow me for more price action insights, free indicators, and trading strategies. Let’s grow and trade smarter together! 📈

XRPUSDT: A Massive Move Is Coming – But Will It Be Up or Down?Yello, Paradisers! Are we about to see an explosive breakout in XRP, or is a deeper pullback lurking around the corner? Let’s break it down.
💎XRPUSDT has formed a falling wedge alongside a bullish divergence, signaling a potential upside move. Adding to the bullish case, we also see an inverse head & shoulders pattern forming underneath – a combination that significantly increases the probability of a breakout.
💎For a high-probability bullish confirmation, we need a breakout and candle close above the falling wedge.
💎That said, if price retraces deeper, we should be watching the major support zone for a potential bounce. A bullish I-ChoCH on lower timeframes will serve as the key confirmation for a reversal.
💎The invalidation level? If XRPUSDT breaks down and closes candle below the major support zone, this bullish setup will be completely invalidated.
🎖Stay sharp, Paradisers. The next move will decide everything! As always, discipline and patience will separate the winners from the crowd. Be strategic, trade smart, and wait for the highest probability setups.
MyCryptoParadise
iFeel the success 🌴

GOLD → Strong consolidation. What could happen?FX:XAUUSD is consolidating in the range of 2926 - 2890. The market is generally bullish, but there is a high probability of a short / long-squeeze before the strong news, which will be on Wednesday.
Markets are waiting for data on inflation and employment in the U.S., which may affect the Fed's decisions. Despite a weaker dollar and expectations of monetary easing, Fed chief Jerome Powell remains cautious.
Gold demand is supported by China, which is increasing purchases, as well as growing fears of stagflation in the US. However, traders are keeping an eye on new economic data and the impact of Chinese tariffs on US goods
Technically, the focus is on 2926 - 2890. The ideal scenario in a bull market would be a false break of the support at 2893 - 2890 and further growth due to the change of imbalance in the market after liquidation and liquidity capture. But, based on the current situation (strong range) there is a high probability of short-squeeze or long-squeeze.
Resistance levels: 2926, 2942
Support levels: 2893, 2890
At the moment the emphasis is on 2926. Formation of pre-breakout consolidation, further breakout and price consolidation above the resistance can provoke a bullish impulse.
But the difficulty is that the support has not been tested yet. If the price approaches 2926 very quickly, a false breakout could be made and in that case the price could go down to 2890 to retest the liquidity zone before storming 2926 for further upside.
Regards R. Linda!


USDCAD Eyes on BoC Interest Rate DecisionUSDCAD Eyes on BoC Interest Rate Decision
On Friday, the Bank of Canada reported a contraction in employment data. However, it was positive that the unemployment rate remained unchanged at 6.6% from the previous month, and the average hourly wages for February were higher than the previous month. Overall, the Canadian economy is performing well.
Despite this, USDCAD is expected to advance further in the coming days. On Wednesday, March 12, the BoC will announce its interest rate decision. The market anticipates a rate cut of 25 basis points, bringing the rate down to 2.75% from the current 3%2.
This expectation is causing CAD weakness ahead of the news. The price may test our target areas soon.
If this does not happen by Wednesday, trading could become riskier.
You may find more details in the chart!
Thank you and Good Luck!
❤️PS: Please suppo rt with a like or comment if you find this analysis useful for your trading day❤️
Disclosure: I am part of Trade Nation's Influencer program and receive a monthly fee for using their TradingView charts in my analysis.

#BTC Weekly Update!#BTC failed to break above resistance (old news, I know).
For now, the 50-Week EMA is holding as support. We’re likely to bottom around $70K, which aligns with the CME gap and FVG across multiple timeframes.
Patience is key.
Do hit that .like button if you like these short, spot on updates.
Thank you
#PEACE

Hellena | GOLD (4H): LONG to resistance area at 2955 (Wave 3).As in the last forecast - I insist that the five-wave movement is not over yet. Therefore, I believe that the price will reach at least the resistance area at 2955.837.
The correction wave “2” is either already completed or will be completed soon.
Manage your capital correctly and competently! Only enter trades based on reliable patterns!

Gold is on a relentless hunt for the $2,720 levelGold is on a relentless hunt for the $2,720 level, navigating through a well-defined ascending channel where the upper boundary has acted as long-term resistance and the lower boundary as dynamic support. The price has respected this structure, with multiple touches reinforcing its integrity. However, a recent double top near the upper boundary signals potential bullish exhaustion, increasing the probability of a downside move. If the price remains below this key level, further declines are likely, with $2,720 emerging as a crucial support zone—aligned with the golden pocket on the Fibonacci retracement, making it a prime area for a reaction.
The Alternative Scenario: The New Economy's Bullish Case
Despite the bearish structure, gold in the new economy presents an alternative bullish outlook. A smaller bullish channel has formed between $2,789 and $2,855, suggesting that buyers are still in control within this range. If this mini uptrend holds, it could fuel another breakout attempt above recent highs, invalidating the bearish scenario and positioning gold for a renewed push toward higher levels.
For now, gold is at a crossroads, with $2,720 as the primary target on the downside—but if buyers defend this level or sustain the new bullish channel, the uptrend may persist in the evolving economic landscape.

11.03.25 Morning ForecastPairs on Watch -
OANDA:XAGUSD
FX:NZDCAD
FX:GBPNZD
A short overview of the instruments I am looking at for today, multi-timeframe analysis down to what I will be looking at for an entry. Enjoy!

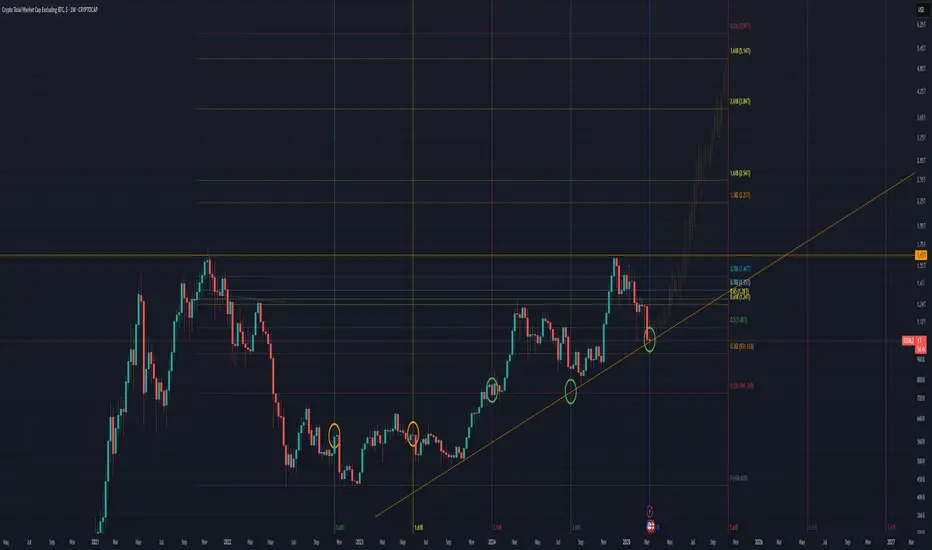
The Official Start of Alt Season (Only Up For 217days)I dare to say that it’s the official start of alt season. Over the next 217 days, we are going only up...
ONLY IF WE HOLD THE LINE.
So, throughout this technical analysis (TA), you will see some very important charts that we need to hold the line on. If the line is broken, there is no alt season for me; the line in the sand will be drawn.
The main chart above is currently TOTAL2, which means the total crypto market cap WITHOUT BTC.
What you’re about to see here on these charts is nothing short of amazing. The chart on the left is my new secret weapon for knowing when alts have bottomed. As you can see, every time we hit the top of this resistance on this chart, it marks a major alt bottom. So far, it has been happening once a year since 2022.
As of this week, we have gotten the 4th hit.
The stars are once again aligning. Finally, once I see everything lining up, I know that there’s an extremely high chance that I will be correct. What are the chances that we hit the top of this resistance for the 4th time on the week of the Fibonacci time sequence you see on the main chart, which also happens to be the bottom of this diagonal support? Again, too many things are lining up here for me.
This time, the Fibonacci sequence I’m following failed to give us anything on the first two hits, but the third (2.618) showed a nice pivot, and the fourth (3.618) showed us the August 2024 alt crash, which is a very important date and event because it mirrored the COVID crash of the last cycle in many ways. So far, then, we have a 50% hit rate on this sequence. We shall see if this week’s Fibonacci count is the actual bottom and pivot of the year.
The most important date for me is the one after October 13th, 2025. This has very much piqued my interest because this is exactly when I think the altcoin market will top this year.
Why October? Well, if you take a look at my Bitcoin TAs, I think September 2025 will be the Bitcoin cycle top this year, and what normally happens is the altcoin market rallies 20–30 days after BTC has topped. Let’s take a look:
As you can see, Bitcoin topped in April 2021, and 28 days later, the alt market topped.
In the 2017 bull market, the same thing happened: Bitcoin topped, and 22 days later, the altcoin market topped.
My thesis for Bitcoin is that we are currently starting the final Wave 5 that will top in mid-September. As you can see, my Fibonacci time sequence has a hit on this timeframe, which is also 1,050 days from the cycle low—the exact length the last two cycles have taken from bottom to top. So if Bitcoin tops in Mid September 2025 its very much possible that 20-30days after that alt market will top which line up with Mid October !
The ascending triangle technical target is about a 5 trillion market cap at the 3.618 level, which is the Fibonacci level we topped out at last cycle.
Many of the greatest rallies have started at this RSI level.
The Wyckoff Spring indicator fired off for the third time in ETH history. This is a real-time signal; it has no lag.
Could this be the spring?
Conclusion
I’m 99% sure this is the bottom as long as this diagonal support is not broken. That’s the only condition here. If it holds, a V-shaped recovery is likely, and expect only up for 217 days.
ADA Ready for PUMP or what ?The price has formed a Triangle on the daily time frame, and if it breaks out, it can drive the price up to around $1.5 .
Give me some energy !!
✨We spend hours finding potential opportunities and writing useful ideas, we would be happy if you support us.
Best regards CobraVanguard.💚
_ _ _ _ __ _ _ _ _ _ _ _ _ _ _ _ _ _ _ _ _ _ _ _ _ _ _ _ _ _ _ _
✅Thank you, and for more ideas, hit ❤️Like❤️ and 🌟Follow🌟!
⚠️Things can change...
The markets are always changing and even with all these signals, the market changes tend to be strong and fast!!

SHIB Experiences Token Burns: What's Next?Shiba Inu (SHIB) is currently trading at $0.00001166. This price reflects a sharp decline from $0.00001541 on March 10, aligning with a broader cryptocurrency market downturn that saw the total market capitalization drop by 4.4% over the past 24 hours. SHIB’s current price sits below its 50-day SMA ($0.00001647) and 200-day SMA ($0.00001939), signaling a bearish trend in the medium to long term. Recent social media posts on X note a significant token burn rate, with over 15 million SHIB burned in the last 24 hours, reducing supply, a factor that could bolster the price over time. However, for the short-term 1-hour timeframe, volatility and market sentiment are driving the action.
Technical Indicators and Key Levels
On the 1-hour chart, SHIB is testing a key support zone around $0.00001100, with additional support levels at $0.00001051 and $0.00001001 if the downward pressure continues. The price is likely below short-term moving averages (e.g., 20-period or 50-period), reinforcing the bearish momentum in this timeframe. The Relative Strength Index (RSI) was recently reported at 31.80, hovering near oversold territory (below 30), which could suggest a potential bounce if buying interest picks up. On the upside, resistance levels to watch include $0.00001278, $0.00001403, and the recent high of $0.00001541. Breaking these levels would require a shift in market dynamics, likely accompanied by a surge in trading volume.
Potential Scenarios and Trading Considerations
Two primary scenarios emerge for SHIB on the 1-hour chart. Bullish Case: If the price holds above $0.00001100 and attracts buyers, it could rally toward $0.00001278 or even $0.00001403, especially if volume increases on upward moves. However, the broader market’s bearish sentiment might limit gains, so any recovery could be short-lived. Bearish Case: If selling pressure breaks $0.00001100, SHIB could slide toward $0.00001051 or $0.00001001, particularly if high volume confirms the downtrend. The recent token burns add a positive long-term narrative, but their impact is unlikely to dominate this short timeframe. Traders should also monitor broader market catalysts—such as shifts in crypto sentiment, that could influence SHIB’s next move.
Final Tips
In this volatile setup, timing is critical. Watch the $0.00001100 support closely, a hold or break here will dictate the short-term direction. Look for volume spikes to confirm any breakout above $0.00001278 or breakdown below $0.00001100. Given the market-wide downturn, risk management is essential, use tight stop-losses and avoid chasing momentum without confirmation. Stay alert for news or whale activity that could jolt the price, and let the chart guide your decisions.
Potential Price Movements
Bullish Scenario: A move above $0.00001278 could target $0.00001403.
Bearish Scenario: A drop below $0.00001100 may test $0.00001051 or lower.
Note: Volume confirmation is key, watch for spikes to validate price action.

ES Daily Update - RSI oversold, MFI is not quite there yetHey look, I'm back.
TBH, I got a day job and took a break from day trading, but the Trump tank lured me back into the market the past month, lol. Bit of a rough restart the first week, but made $10k each of the past 3 weeks including today.
I figured something like this was gonna happen today so I carried TSLA puts from Friday. As you can see, futures left an open gap last night, so that caused me to get out of my puts waaaay too early, got into calls too early as well, lost all my profit for the day but made it up in the last hour and bailed, lol. $10k swing 3 times for a lot of heartburn.
Daily RSI hit oversold as did the 3hr, but it looks like MFI needs to hit oversold before we get a pump to fill that open gap. So far, everything is just dumping the Trump pump from November.
Not planning on shorting anything again until the open gap fills, will take another shot at going long if 3 hr RSI and MFI hit oversold again tomorrow or Wed. There's also that Friday afternoon pump that's worth playing if indicators line up.
Sorry, no premarket updates, I'm on east coast time zone and at work at 9:30.
