XAUUSD: Market Analysis and Strategy for December 26th.Gold prices surged to 4532 before encountering resistance, demonstrating strong bullish sentiment. A significant gain at the close today would likely fuel a continued upward trend next week, with new highs being reached. Moving averages remain in a bullish alignment, Bollinger Bands are trending upwards, and moving average support is shifting upwards. The MACD/KDJ indicators are crossing upwards, indicating ample upward momentum. Support levels to watch today are 4490/4482, while resistance is currently focused on the intraday high around 4532.
On the 1-hour chart, prices are consolidating at high levels, but the current structure still favors the bulls. The slowing upward momentum aligns with recent European session consolidation patterns. Support on the 1-hour chart is around 4496. Trading suggestion for today: Wait for support confirmation and buy on dips.
Trading Strategy:
BUY: 4478~4470
If a rapid pullback occurs, breaking below 4460,
BUY ZONE: 4448~4440
More Analysis →
Commodities

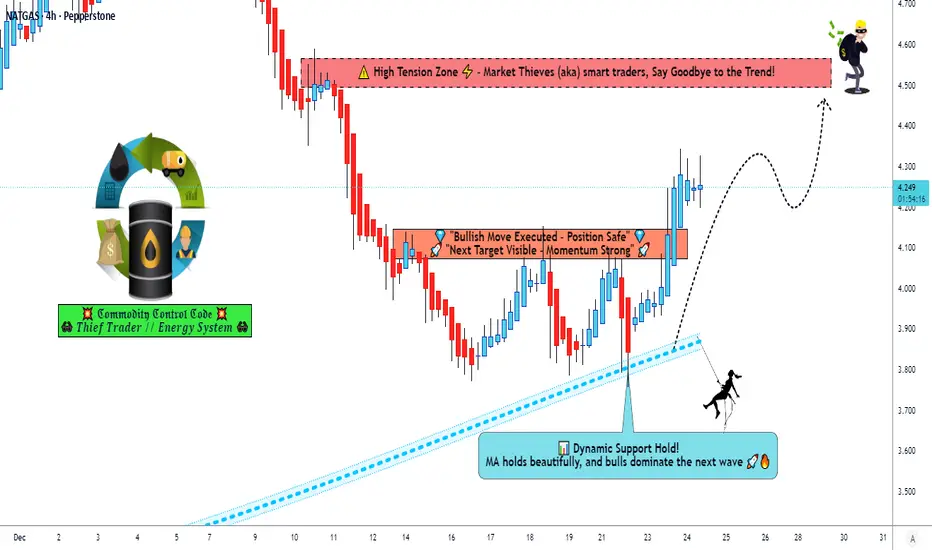
XNG/USD Trade Guide | Bullish Momentum Building🔥 XNG/USD (NATURAL GAS) — Bullish Trade Opportunity | Day / Swing Setup
📌 Asset Overview
Asset: XNG/USD — Natural Gas
Market: Energies | Commodities
Trading Style: Day Trade / Swing Trade
📈 Trade Plan — BULLISH BIAS
🟢 Primary Bias: Bullish continuation
🟢 Market Structure: Demand strength holding above key zones
🟢 Volatility: Expanding (energy markets active)
🎯 Entry Strategy
💡 Entry:
➡️ YOU CAN ANY PRICE LEVEL ENTRY
➡️ Flexible execution based on your own confirmation model
➡️ Suitable for both scalpers & swing traders
🛑 Risk Management
🚨 Stop Loss: 3.900
⚠️ This is thief SL
📝 Risk Note:
Dear Ladies & Gentlemen (Thief OG’s),
I am NOT recommending to follow only my SL.
✔️ Adjust stop loss based on your strategy, risk appetite, and account size.
✔️ Capital protection comes first.
💰 Profit Objective
🎯 Target: 4.500
📊 Target Logic:
Strong resistance zone ahead
Overbought conditions expected near highs
Trap probability increases → book profits & escape smartly
📝 TP Note:
Dear Ladies & Gentlemen (Thief OG’s),
I am NOT recommending to follow only my TP.
✔️ Secure profits based on your plan & market behavior.
🔗 RELATED PAIRS TO WATCH (Correlation Watchlist)
Keep an eye on these $-denominated energy & USD drivers:
🛢️ Energy Correlation
USOIL ( BLACKBULL:WTI ) → Strength supports energy sentiment
UKOIL ( BLACKBULL:BRENT ) → Confirms global energy demand tone
💵 USD Correlation
DXY (U.S. Dollar Index)
🔻 Weak USD = 🔺 Natural Gas supportive
🔺 Strong USD = ⚠️ May slow upside momentum
🏭 Energy Equity Proxy
Energy sector indices / producers
Institutional inflows into energy stocks often align with NG strength
🌍 FUNDAMENTAL & ECONOMIC FACTORS TO CONSIDER
🔥 Natural Gas–Specific Drivers
🌡️ Weather Outlook (US & Europe):
Colder-than-normal forecasts = higher heating demand → bullish NG
🏭 Storage Levels:
Lower-than-average inventories support upside pricing
🚢 LNG Export Demand:
Strong U.S. LNG exports tighten domestic supply
💼 Macro & Economic Factors
🏦 Federal Reserve Policy:
Rate cut expectations → weaker USD → supportive for commodities
📊 US Economic Data (GDP, PMI):
Strong growth = higher industrial energy demand
🌍 Geopolitical Energy Risks:
Supply disruptions amplify volatility & upside spikes
🧠 TRADER’S NOTE
✔️ This setup is directional, not predictive
✔️ Let price action confirm your execution
✔️ Manage risk like a professional, not a gambler
📌 If this analysis helps your trading, support it with a 👍 Like, 💾 Save, and 🗨️ Comment — it helps the idea reach more traders.
Platinum’s Nuclear Breakout Is Loading | The Chart Doesn’t LiePlatinum (XPTUSD) — Long-Term Structural Analysis Integrating Elliott Framework, Institutional Order Flow, and Macro Cycles
Platinum’s multi-decade price behavior continues to display a well-ordered impulsive structure consistent with classical Elliott Wave theory, supported by recurring institutional accumulation patterns and strict adherence to Fibonacci geometry. The asset has progressed through a full secular cycle, characterized by deep corrective retracements into high-probability value zones and expansions that consistently terminate at key Fibonacci extension thresholds—behavior typical of markets driven by institutional liquidity flows rather than retail speculation.
Elliott Structure & Fibonacci Alignment
The historical impulse demonstrates strong proportionality across waves.
The initial secular Wave 1 advanced precisely into the 1.618 extension , confirming a minimum impulse threshold.
Wave 2 retraced cleanly to the 0.618 retracement , an area frequently associated with long-horizon institutional repositioning.
The subsequent Wave 3 extended toward the 2.618 level , consistent with the most statistically probable long-cycle expansion target.
Wave 4 repeated the symmetrical 0.618 retracement , reflecting renewed accumulation in a structurally discounted region .
The current multi-year breakout sequence is consistent with an emerging Wave 5 , with a macro-projection aligning toward the 3.618 extension , a historically validated termination zone for commodities in late-cycle impulsive phases.
Macro Market Structure
Platinum has spent an extended period in re-accumulation following a prolonged distribution phase that began after the prior secular peak. Internal structure has now transitioned from compression to early expansion, evidenced by successive breaks of multi-year structural highs and sustained acceptance above formerly capped liquidity zones. This structural shift suggests the market is transitioning from long-term value consolidation into a new secular markup phase.
Institutional Order Flow & Smart Money Dynamics (ICT/SMC Framework)
Price behavior across multiple cycles reveals consistent liquidity targeting:
Corrective waves repeatedly returned to deep discount regions within the 0.618–0.786 “golden pocket,” an area historically associated with institutional accumulation and mitigation of long-horizon order blocks.
Liquidity sweeps above major multi-year highs followed by sustained displacement signal a structural shift in institutional intent.
Current price action demonstrates displacement from an extended accumulation base, confirming that the dominant flow is now upward, with liquidity pools above the historical consolidation range serving as primary targets.
Price Action Context
The market has decisively exited its multi-year equilibrium, printing higher-high/higher-low structures consistent with early-stage impulsive behavior. Breaks of internal liquidity layers reinforce the expectation of continued expansion toward higher-order liquidity pools, aligning with the projected Wave 5 trajectory.
Fundamental Alignment
Underlying fundamentals - including tight supply dynamics, structural deficits within the PGM basket, and tailwinds tied to hydrogen economy applications - reinforce the technical outlook. The confluence of cyclical tightening, inventory compression, and strategic industrial demand supports a durable long-term appreciation phase.
What do YOU think happens next?
Breakout or fake-out? Drop your prediction below!
👇 We are replying to every comment - let’s talk charts .
Smash the 👍 if this helped, hit 🔔 to catch the next setup,
and FOLLOW for more high-probability wave + SMC plays.
⚠️ Disclaimer
This content is for educational and informational purposes only and does not constitute financial, investment, or trading advice. All analyses reflect personal opinions based on publicly available data and chart structures. Markets involve risk, and you should always perform your own research or consult a licensed financial professional before making any trading decisions. Past performance does not guarantee future results.
#Platinum #XPTUSD #CommodityTrading #Breakout #Wave5 #ElliottWave #SmartMoney #SMC #ICT #PriceAction #ParabolicMove #BullishSetup #MarketCycle #Fibonacci #Metals #Macro #TechnicalAnalysis #ChartAnalysis #TradingSignals #TraderCommunity #Investing

XAUUSD Maintains Support – Buyers Eye $4,560Hello traders! Here’s my technical outlook on XAUUSD (Gold, 2H) based on the current chart structure. Gold continues to trade within a well-defined ascending channel, confirming a sustained bullish market structure. After a prolonged consolidation phase (range) on the left side of the chart, price successfully broke above resistance, signaling a shift in control from sellers to buyers. This breakout marked the beginning of the current impulsive bullish leg. Following the breakout, price accelerated higher and is now approaching the Seller / Resistance Zone around 4,500–4,510, where selling pressure has started to appear. The recent pullback is bringing price back toward the Buyer Zone near 4,430, which aligns with the previous breakout level and the midline/support of the ascending channel. This confluence makes the area a key demand zone to watch. Structurally, the pullback remains corrective, with price still holding above channel support and the broader bullish trend intact. My scenario: as long as Gold holds above the 4,430 Buyer Zone, the bullish structure remains valid. A strong reaction from this area could trigger another push toward the 4,560 (TP1) and potentially higher if a clean breakout occurs. A decisive breakdown below the buyer zone would signal a deeper correction. For now, buyers remain in control while price respects the ascending channel. Please share this idea with your friends and click Boost 🚀

GOLD is bullish now & many Traders don't see it !!!The price on the 4h timeframe is within an ascending triangle, which can be promising. If the price breaks this pattern with bullish candles, it could easily rise by the distance of AB=CD.

XAUUSD - Gold still rising?!Gold is trading above the EMA200 and EMA50 on the 1-hour timeframe and is trading in its medium-term ascending channel. Maintaining the current support level will lead to a continuation of the upward movement of gold towards 4560, while its loss will pave the way for a correction to around 4440.
The release of the **final U.S. economic growth data for the third quarter** once again drew market attention to the growing gap between **strong economic momentum** and **persistent inflation pressures**. The **4.3% GDP growth rate**—the fastest pace in nearly two years—initially paints a robust picture of the U.S. economy. However, a deeper look at the underlying details of the report suggests that **the path of monetary policy in the year ahead is far more complex than headline GDP figures alone might imply**.
The U.S. economy has not only avoided a meaningful downturn, but has continued to maintain momentum, supported by **household consumption** and **targeted investment activity**. What makes this report particularly significant from an analytical perspective is the **coexistence of solid growth with stubborn inflation**, a combination that leaves the Federal Reserve in a difficult position. Under these conditions, the central bank is constrained—unable to confidently pursue further rate cuts, yet also lacking sufficient justification for renewed monetary tightening.
Meanwhile, **consumers remain the backbone of U.S. economic growth**. A **3.5% increase in household spending** indicates that despite a gradual cooling in the labor market and ongoing pressure from higher living costs, a substantial portion of demand—especially in service sectors such as **healthcare and travel**—continues to show notable resilience. For policymakers, this sends a clear signal: **domestic demand has not weakened enough to justify an aggressive easing of interest rates**.
By contrast, **declining spending on durable goods**, including automobiles, points to the early emergence of more cautious behavior among certain income groups. This divergence in consumption patterns is likely to **widen further in 2026**, gradually exposing downside risks to economic growth.
On a separate front, **Donald Trump** outlined his views on monetary policy and the qualities of the next Federal Reserve chair in a post on the “Truth Social” platform. He stated explicitly that **any individual who disagrees with his views would never be appointed as Fed chair**.
Trump also clarified his expectations for the future head of the central bank, saying:
“I want the next Federal Reserve chair to cut interest rates even when the market is performing well.”
He went on to emphasize that he favors a market that **rises on good news and falls on bad news**. Concluding his remarks, Trump expressed an unconventional stance on inflation, arguing that **inflation either resolves itself naturally or can be addressed by raising interest rates if necessary**.
At the same time, American economist **Peter Schiff** reiterated a series of stark warnings, stating that:
* The era of **U.S. dollar dominance is nearing its end**;
* **Gold is becoming the primary reserve asset for central banks**;
* The decline of the dollar could be **more severe than that of other fiat currencies**;
* The U.S. economy is heading toward a **historic collapse**.
According to Schiff, the United States has long benefited from the **“privilege of the dollar’s global reserve status,”** but in his view, **that train is now approaching its final stop**.

XAUUSD/GOLD – 1-Hour Timeframe Tradertilki AnalysisGuys, Gold is approaching the critical level of 4,524, standing at a key decision point. A candle close above this level is the most important condition for confirming bullish momentum.
If the price closes above 4,524, my first target will be 4,555 and the second target will be 4,600.
In this scenario, buyers take control and the market may continue its upward momentum. A potential pullback into the support zone could offer better risk-reward opportunities.
However, the most crucial condition for the continuation of the bullish move is a clear candle close above 4,524.💰
These targets for XAUUSD-Gold remain valid as long as the price does not fall below the 4,424 level. Achieving the targets may take time because this is not scalping, but a swing analysis.❗️
My friends, I share these analyses thanks to each like I receive from you. Your likes increase my motivation and encourage me to support you in this way.🙏✨
Thank you to all my friends who support me with their likes.❤️

XAU/USD | Golf going strong! (READ THE CAPTION)Gold reached a new ATH! I believe all of you are aware of it. Gold went as high as 4497, but faced a little bit of correction and it's being traded at 4488. There are no indications whatsoever for gold to stop going higher. Next targets for Gold: 4500, 4514 and 4532.

As a common idea in gold...!It seems like a common idea that gold has a chance to reach the desired price range on the chart to reach higher targets and start to fluctuate upwards again!?
Or should we wait for certain events in the election of influential people in larger economies or wait for the decision-making of warmongers and warlords who consider the blood of ordinary people as the leach of their impure and worthless life! I recommend watching the movie "Lord of War" for sure.
Good luck

XAU/USD)Bullish trend analysis Read The captionSMC Trading point update
Technical analysis of XAUUSD (Gold) – 1H chart using trend structure + SMC + Fibonacci OTE.
⸻
Market Context
• Overall bias: Bullish
• Price is respecting a rising channel
• Market structure still shows higher highs & higher lows
• Recent drop is a healthy pullback, not a trend reversal
⸻
Why Price Is Pulling Back
• Price reacted near short-term resistance (0 level)
• Profit-taking + liquidity sweep caused a retracement
• Pullback is heading into a discount zone within an uptrend
⸻
Key Buy Zone (Blue Area)
~4,465 – 4,480
This zone has strong confluence:
• SMC demand / order block
• Fib OTE zone (0.705 – 0.79)
• EMA 50 support
• Rising trendline support
• Clear reaction level (green arrow)
This is where buyers are expected to defend the trend.
⸻
Fibonacci Logic
Measured from the recent impulse low → high:
• 0.5 / 0.62 → shallow retracement
• 0.705 – 0.79 → institutional rebalance zone
Textbook area for trend continuation entries
⸻
Trade Idea (Continuation Long)
Buy on confirmation inside demand
• Entry: 4,465 – 4,480
• Stop Loss: Below demand & trendline (~4,450)
• Targets:
• TP1: 4,500 (internal structure high)
• TP2: 4,525
• Final TP: 4,551 (marked target point / liquidity above highs)
Risk–Reward: ~1:3 or better
⸻
Confirmation Triggers (Important)
Only enter if you see:
• Bullish engulfing or strong rejection wick
• Lower-TF CHoCH
• Failure to close below the demand zone
• Momentum expansion after tapping the zone
⸻
Invalidation
• 1H close below ~4,450
• Acceptance below trendline + EMA 50
If this happens → bullish idea is invalid, and price may seek the lower support.
⸻ Mr SMC Trading point
Summary
This setup is a high-probability bullish pullback:
• Trend intact
• Fib OTE + demand
• Clear upside liquidity target
Please support boost this analysis

GOLD - Hunting for liquidity ahead of growth. Focus on 4475FX:XAUUSD reached a new historic high of around $4,525. However, profit-taking is causing a correction, with the 4,475-4,470 range being the area of interest in the bull market.
The dollar is weakening, with the market anticipating two rate cuts in 2026. Geopolitical risks are supporting demand for safe-haven assets. Positive US GDP data for Q3 (+4.3%) did not support the dollar due to expectations of a slowdown in growth in Q4.
The dollar index has hit its lowest level since early October. Today, US jobless claims data will be released, which may increase volatility. The overall positive sentiment in the stock markets is holding back more active growth in gold.
The upward trend in gold continues. Any significant correction is likely to be seen as a buying opportunity, given the Fed's accommodative monetary policy and geopolitical uncertainty.
Resistance levels: 4500, 4525
Support levels: 4475, 4470, 4466, 4452
Focus on the current trading range of 4475-4525. A false breakdown of support could attract buyers waiting for favorable prices. I do not rule out a retest of 4452-4442 before growth (against the backdrop of aggressive profit-taking).
Best regards, R. Linda!

Gold Hits ATH Before Christmas — Is a Correction Coming?🎄🎄🎄 Merry Christmas, Traders! 🎄🎄🎄
Wishing you a joyful Christmas filled with good vibes, calm markets, tight stop-losses, and charts that respect your levels😄.
May you spend this season with your family, loved ones, and everyone who truly matters — away from stress, noise, and overtrading.
Enjoy the holidays, protect your capital,and come back refreshed for the new trading year.
Best wishes to all my followers — thank you for being part of this journey ✨
-----------------------------
Historically, Gold has not printed all-time highs during the Christmas period.
Most ATHs have occurred during macro stress events, not holiday sessions.
As we approach Christmas, the market typically sees:
Lower trading volume
Reduced institutional participation
More range-bound and slower price action
This period is usually characterized by consolidation or mild directional moves, rather than strong breakouts.
Important trends and decisive moves in Gold often emerge after the holidays, when liquidity returns and institutional positioning resumes in early January.
-----------------------------
Currently, gold is moving near a resistance zone($4,506-$4,494) and, over the past few days, it has consistently formed new all-time highs (ATHs).
From a classic technical perspective, gold, after experiencing a strong decline in momentum yesterday, seems to have formed a symmetrical triangle. A break below the lower line of this triangle could lead to a short-term downward movement for gold.
From an Elliott Wave perspective, it appears that gold has completed wave 5, and we should now expect corrective waves. Given the intensity of the downward momentum, these corrective waves could be quite significant.
I expect gold to decline from the resistance zone($4,506-$4,494) and the lower line of the symmetrical triangle, at least down to the support zone. Considering the approach of Christmas, trading volume is likely to be low, so larger targets might be more relevant after the holiday season.
First Target: Support zone($4,478-$4,466)
Second Target: Support zone($4,43-$4,426)
Stop Loss(SL): $4,514
Points may shift as the market evolves
💡 Please respect each other's opinions and express agreement or disagreement politely.
📌 Gold Analyze (XAUUSD), 15-minute time frame.
🛑 Always set a Stop Loss(SL) for every position you open.
✅ This is just my idea; I’d love to see your thoughts too!
🔥 If you find it helpful, please BOOST this post and share it with your friends.

XAUUSD: Bearish Rejection at Resistance – Targets Set?Gold is currently showing signs of exhaustion after a strong push higher. We are seeing a clear rejection from the overhead supply zone, and the technical structure suggests a potential corrective move toward deeper support levels.
Technical Breakdown:
Resistance/SL Zone: The market has found significant selling pressure around the 4,530 – 4,536 area. This serves as our primary resistance and the invalidation point (SL) for the bearish thesis.
Price Action: After a sharp rally on the 25th, the price is now carving out lower highs. The current "Ask" price at 4,515 sits right below a minor pivot, suggesting the bears are taking control in the short term.
The Path: I am looking for a move lower to test the immediate Support (4,500 psychological level). If that fails to hold, the ultimate target is the Strong Support zone anchored near 4,480.
Trading Plan:
Bearish Bias: As long as we remain below the 4,536 high.
Target 1: 4,500 (Minor Support).
Target 2: 4,480 (Major Demand Zone).
Stop Loss: A daily close above 4,537 invalidates this setup.
What do you think? Will Gold find buyers at the 4,500 level, or are we heading straight for the 4,480 liquidity? Let me know your thoughts in the comments!

Natural Gas on January 26I expect to see short to 3$ at long term.
Nearly targets are 3.75 /3.5/ 3.2
Principal is simple if the SL reached we wanting until it's goes back at the price reached and open the same position. The direction is considered is only on Short scenario

SELL GOLDIn todays session we are ,omitoring GOLD for shorts. I know it has wrecked sellers but we are in major squeeze to the upside.Ou short entry is at 4412 stops above 4452 and targets bewlo 4181. First sign of the drop is LODNON IS BEARISH, NEW YORK IS BEARISH. Keep it locked and enjoy the holidays.
Always risk what you can afford to loose.

EURUSD: bullish pressure🛠 Technical Analysis: On the 4-hour (H4) timeframe, EURUSD is exhibiting strong bullish momentum within a well-defined ascending structure. The price is currently being guided by a steep Ascending Support Line, which has remained intact since the "Global bullish signal" was triggered in early December.
The pair is currently consolidating just below a major horizontal Resistance zone (1.18000 – 1.18080). As noted on the chart, buyers are consistently putting pressure on this level. The analysis suggests a high probability of an upward breakout, likely fueled by the "accumulation of sellers' stop losses" situated just above this resistance area. The moving averages (SMA 50, 100, and 200) are all trending upward, providing dynamic support and confirming the overall bullish bias.
———————————————
❗️ Trade Parameters (BUY)
———————————————
➡️ Entry Point: Confirmation of an H4 candle close above the resistance (approx. 1.18080).
🎯 Take Profit: 1.18626 (Next major liquidity level).
🔴 Stop Loss: 1.17718 (Below the immediate support and ascending trendline).
⚠️ Disclaimer: This is a potential trade idea based on current analysis; market conditions and price direction are subject to change based on news factors and volatility.

XAU/USD – Bullish Structure Holds, Focus on Buy the DipMarket Context
Gold remains in a bullish environment, trading within an ascending structure. The recent pullback appears to be a technical retracement after an impulsive move, not a trend reversal.
From a fundamental perspective, expectations of a more accommodative Fed continue to weigh on the USD, keeping gold supported on dips. This backdrop favors trend-following BUY strategies rather than aggressive SELLs.
Technical Structure (H1)
Overall structure remains Higher High – Higher Low
Price is holding above the ascending trendline
No confirmed bearish Break of Structure
Current phase = rebalancing / pullback within uptrend
Key Zones on Chart
OBS BUY Zone: 4,483 – 4,475
Deeper Support: 4,457
Near Resistance: 4,515
Upper Resistance / Target: 4,534
Major Supply: 4,566
Trading Plan – MMF Style
Primary Scenario – Trend Continuation BUY
Wait for price to pull back into the OBS BUY zone (4,483 – 4,475)
Look for bullish reaction / structure hold on lower timeframes
This zone aligns with demand + trend support
Targets
TP1: 4,515
TP2: 4,534
TP3: 4,566 (expect reaction / profit-taking)
Alternative Scenario
If price breaks above 4,534 with acceptance
→ Expect a push toward 4,566, but avoid chasing at premium
Invalidation
A H1 close below 4,457 would weaken the bullish structure and shift bias to neutral.
Summary
Gold remains bullish as long as structure support holds. The priority is to buy pullbacks at key demand zones, manage risk near resistance, and avoid emotional entries at the highs.

GOLD ANALYSIS 12/26/20251. Fundamental Analysis
a) Economic factors:
• USD: Mild technical rebound after a period of weakness, mainly driven by year-end profit-taking sentiment → creates short-term corrective pressure on gold.
• US equities: Stable, no major risk shock → not generating strong safe-haven flows.
• FED: Expectations of rate cuts in the medium–long term remain unchanged, but in the short term the Fed maintains a cautious tone → gold is prone to short-term volatility.
• TRUMP: US political factors still pose potential volatility toward 2026, but no immediate trigger yet.
• Gold ETF (SPDR): Added 3.71 tons → price base remains supported. However, large holdings may see partial profit-taking, leading to short-term pullbacks → look to buy on dips.
b) Political factors:
• No new geopolitical escalation → not enough momentum for a strong breakout, but still provides a supportive base for the long-term uptrend.
c) Market sentiment:
• Mild risk-on sentiment at year-end, capital focuses on portfolio rebalancing → gold corrects and consolidates, not a trend reversal.
⇒ Fundamental conclusion:
Short-term corrective pressure, while the medium–long-term trend still supports BUY on pullbacks to support zones.
2. Technical Analysis
Main trend: Clear uptrend, higher high – higher low structure remains intact.
Current price:
• Moving within an ascending channel after rejecting the ATH zone at 4525.
Short-term MAs:
• Price is ranging around the MAs → market is pausing, waiting for new momentum.
RSI:
• RSI has rebounded from lower levels, not overbought, no strong bearish divergence.
Implication:
This is a pullback within an uptrend, not a breakdown.
RESISTANCE: 4480 – 4500 – 4525
SUPPORT: 4468 – 4448 – 4430
3. Previous session market behavior
• Price formed a new ATH, then was strongly rejected at the upper trendline.
• The US session saw profit-taking → gold corrected toward lower support.
• Buying interest returned well at the channel bottom → no signs of distribution yet.
⇒ Yesterday’s market indicates:
Sellers are not strong enough to break the trend; buyers still control the lower zones.

Silver- Monthly TFLook at how far we are extended above the 21 SMA on the monthly TF, the same is the case for any TF- weekly included. Usually such huge divergences even out, the last time we were at $50 peak in 2011, it was similar and we know what happened. It may not play out the same over the next 14 years, but we have to be wary especially if holding bags and in gains or if trying to enter now, which has more risk v reward imho

Crude Oil – Sell around 58.90, target 57.00-56.00Crude Oil Market Analysis:
The recommended strategy for today is to sell crude oil. Recent crude oil price fluctuations have been relatively small, and the fluctuations are mostly within a consolidation phase. The recommended strategy is to sell, as chasing this range-bound market is not advisable. Wait for a rebound to a higher point before considering selling. Today, pay attention to the levels around 58.90 and 59.50.
Fundamental Analysis:
These past few days have been a holiday, with few major data releases. However, the escalating US-Venezuela relations and the worsening Russia-Ukraine situation are providing short-term geopolitical support, significantly benefiting gold prices.
Trading Recommendation:
Crude Oil – Sell around 58.90, target 57.00-56.00

XAUUSD: This Is a Breakout PreparationXAUUSD – 1H |
Structure: Strong impulsive rally followed by bullish consolidation below previous high → classic continuation pattern.
Key Zone: Former resistance ~4,350–4,380 flipped into strong support. Price keeps respecting this base.
Momentum: Higher highs & higher lows intact → buyers still in control. No distribution signal yet.
Next Objective: Clean continuation opens the path toward 4,700 (new ATH projection).
Macro Drivers (Supporting the Move):
Fed rate-cut expectations in 2025 keep real yields pressured.
USD lacks strong upside momentum, reducing headwinds for gold.
Ongoing geopolitical & fiscal uncertainty sustains safe-haven demand.
➡️ Bias: Bullish continuation. Pullbacks into support are buy-the-dip, not reversal signals

Gold Continues to Maintain Its Bullish Streak Into Year-EndHello everyone,
Today, OANDA:XAUUSD is taking a pause during the Christmas holiday period, currently trading around 4,479 USD. Although slightly lower than the previous session, gold continues to hold a strong high-price base after a powerful rally, driven by rising safe-haven flows, escalating geopolitical tensions, and expectations that the Fed may cut interest rates in 2026.
On the chart, price has broken out of the previous sideways range and formed a clear bullish structure. At the moment, gold is consolidating within the 4,450–4,525 range, with 4,520–4,525 acting as the nearest resistance (weak high)—a zone where liquidity may be drawn before the market commits to its next direction.
From a scenario perspective, as long as price holds above key support, any pullbacks are considered healthy, and the uptrend remains dominant. A decisive break above 4,525 could open the door toward 4,600 USD and beyond, especially if supportive factors such as low interest rates and ongoing geopolitical risks persist.
The preferred strategy at this stage remains buy-biased, focusing on patience, confirmation-based entries, trading in line with the trend, and avoiding FOMO.
What’s your view on the current XAUUSD trend? Feel free to leave a comment.
Wishing you a peaceful and joyful Christmas!

XAUUSD ATH Sell Analysis 4530 - 4130This sell from 4,530 down toward ~4,130 is a straightforward “extension then correction” setup. Price pushed into a fresh high at 4,530 right at the upper boundary of the rising channel, but instead of building acceptance above that level it looks like an exhaustion print. In my framework, this is also exactly where my 5-wave model count completes. The impulse ends at 4,530 so I’m not treating the next move as a trend failure, but as the expected corrective phase that typically follows a completed count. The logical magnet for that correction is the heavy volume cluster / prior consolidation near 4130 where price previously spent time and transacted heavily. That zone is where I expect the market to rebalance, fill the thin area left by the late stage expansion, and potentially stabilize before the next directional decision.
Invalidation for the correction idea would be sustained price acceptance as we are in discovery and continuation above 4530
For now I expect price rejections and potential ABC top formations
