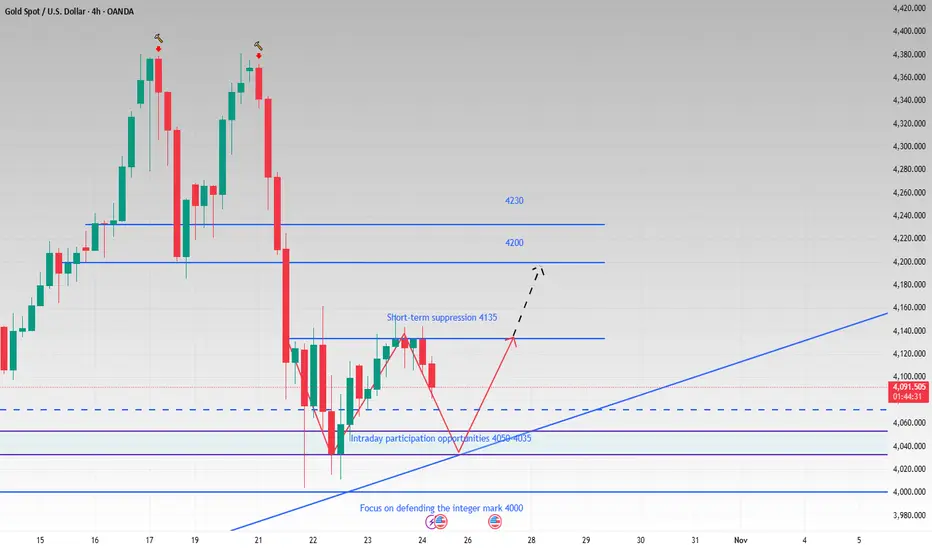
When everyone is bearish, I am looking for buying opportunities#XAUUSD OANDA:XAUUSD
Looking at the hourly chart, the gold price is fluctuating slowly downwards during the day. Although the bears have regained control of the market in the short term, from the perspective of the 4H cycle, we are still above the rising trend line. Therefore, our bullish attitude in the medium and long term remains unchanged. Any pullback before a significant break below the trend line should be considered a bullish entry opportunity.
In the short term, gold still has room to fall. Don't blindly chase the rise and sell the fall at this time. Wait patiently for it to fall back to the support and stabilize before participating in the transaction. As time goes by, the support points on the short-term trend line are constantly moving up. If the gold price in the European and American markets retreats to 4055-4040, we can try to go long on gold in batches with a light position, with the target looking at 4090-4115.
Commodities

4H see W shape. Support is not broken and it is still bullish.Although gold has experienced a temporary pullback today, we remain bullish as long as the price remains above the upward trend line. While the hourly chart shows a downward trend, with moving averages diverging downward and technical indicators like the MACD forming a death cross, it appears that bears have regained control of the market in the short term.
But from the 4H perspective, if the short-term decline continues and it can effectively rebound after touching the trend line and move out of the W-shaped structure, then gold will be expected to hit the 4135-4145 pressure again, and then gradually hit the 4160, 4200 and other periodic resistance levels until the bulls return. As time goes by, the support points on the short-term trend line are constantly moving up. If it falls back to 4050-4035, try to go long on gold in batches with light positions, and the target is 4090-4130.
OANDA:XAUUSD
SILVER (XAGUSD) – SELL Signal📉 SILVER (XAGUSD) – SELL Signal
🔹 Entry: 48.064
🎯 Final Target: 47.994
🛡️ Stop Loss: (Set based on your risk management)
Analysis:
Silver is facing resistance around 48.064 and showing signs of bearish momentum. If sellers stay active, price could move down toward 47.994. Look for confirmation from bearish candles before taking entry.
📊 Trend: Bearish Bias Developing
💬 Share your views below & follow for more Silver trade setups!
#Silver #XAGUSD #SellSignal #BearishTrend #ForexSignals #TradingView

Time for GOLD To DROP! (XAUUSD is heading to the downside!)For many weeks gold (XAUUSD) has been sky rocketing to the upside, however there have been many new signals indicating that it could be a bearish move to the downside. Nothing keeps going up forever! Gold has broken major support levels including the trendline that has been holding it up for weeks. It has also been struggling to break above the fibonacci level of 0.50! Time to sell!
Comparison: Gold’s Triple Top vs. EthereumLet’s take a look at the charts. Gold formed a triple top before breaking out strongly, and the current Ethereum structure looks strikingly similar, only moving much faster.
The gold chart you see here developed over 15 years, while Ethereum’s pattern has taken shape in just 4 years.
When a resistance level is tested multiple times, it often eventually breaks.
I’m sharing this analysis to help you recognize recurring patterns across markets. History doesn’t repeat itself perfectly, but it often rhymes.

GOLDThe era of cheap gold ends
From 1919 to 2015, the price of gold due to Gold Fixing. The price was set by London Gold Market Fixing Limited. On March 20, 2015 fixing ceased to be installed according to the old methodology and was replaced by electronic auctions LBMA Gold Price.
Initially, the "golden five" consisted of the following companies
1.N M Rothschild & Sons
2.Mocatta & Goldsmid
3.Pixley & Abell
4.Samuel Montagu & Co
5.Sharps Wilkins
What now?
Thirteen market participants are accredited to participate in LBMA Gold Price trading:
Bank of China
Bank of Communications
China Construction Bank
Goldman Sachs International
HSBC Bank USA NA
ICBC Standard Bank
JPMorgan Chase
Morgan Stanley
Société Générale
Standard Chartered
The Bank of Nova Scotia - ScotiaMocatta
The Toronto Dominion Bank
UBS
These banks all belong to the same families.
Most of the gold has already been bought and there is no point in keeping it at this level.
In a period of instability, investors will seek refuge for their assets. And gold will not be a bad refuge for long term.
WE WILL BE GOLD BEFORE THE PORN, WHILE GOLDEN IDEOLOGISTS WILL EXIST . Rothschild's

Could Gold Recover After Yesterday's CrashGold saw its biggest single-day drop since the infamous 2013 crash. Back then, I was inexperienced, but with some luck and perhaps a bit of reckless bravery, I managed to secure a tidy profit. Unfortunately, my more experienced self missed most of yesterday’s move :)
Now that gold has reached the double-top target near 4000, a short-term bounce could be on the way. However, volatility remains high, making gold a risky trade at the moment.
My plan is to enter around current levels, targeting a recovery toward the 61.8% retracement of the recent drop. It’s a calculated gamble, but the risk-reward ratio looks acceptable, at least for me.

GOLD recovers ahead of US CPI data, key data dayArticle summary:
“Gold rebounded in the Asian session on October 24, trading around $4,139/ounce, as safe-haven flows surged amid renewed geopolitical tensions and investors awaited September US CPI data, which could determine the Federal Reserve’s monetary policy moves in the short term.
The recovery momentum was reinforced by expectations of an early Fed rate cut, along with the impact of Washington’s new oil sanctions on Russia and escalating US-China trade tensions. Meanwhile, technically, gold held support around $4,100, suggesting the medium-term uptrend remains intact.”
OANDA:XAUUSD maintained its recovery momentum in the Asian session on October 24, trading around $4,139/ounce, after rising sharply in the Thursday session thanks to the return of safe-haven flows amid fresh geopolitical developments. The move came as global markets await key US inflation data (September CPI), which is seen as key to shaping the direction of the Federal Reserve's monetary policy in the short term.
Economic data
The US Bureau of Labor Statistics (BLS) will release its September Consumer Price Index (CPI) tonight.
Forecasts show the US core CPI rising 0.3% month-on-month and remaining at 3.1% year-on-year, suggesting persistent inflationary pressures despite signs of cooling energy prices.
The market has all but priced in a 25 basis point rate cut by the Fed at its policy meeting next week. In a low-interest-rate environment, gold, a non-yielding asset, tends to benefit from lower opportunity costs.
“Gold’s goal is to continue its rally ahead of the CPI data,” says Valeria Bednarik of FXStreet.
Political and Geopolitical Events
Gold prices rebounded after the US imposed new sanctions on two major Russian energy companies, Lukoil and Rosneft. This is the first sanctions of President Donald Trump's second term and is seen as a significant escalation in the pressure campaign against Moscow.
According to Jorge Leon, Director of Geopolitical Analysis at Rystad Energy, "This move marks a major and unprecedented escalation in Washington's campaign against Russia."
The sanctions could impact global oil supplies, indirectly increasing the appeal of gold as a hedge against risks in an uncertain environment.
In addition, US-China tensions have also resurfaced as the White House considers restricting China’s use of US software, retaliating against Beijing’s rare earth export controls and raising port fees for US-flagged ships. These signals reinforce the “selective risk-off” sentiment in global markets.
In short, the current developments suggest that gold is repositioning itself in a medium-term bull cycle, as the market simultaneously assesses geopolitical risks and the prospect of Fed easing.
If CPI data reinforces the case for a Fed rate cut at the upcoming meeting, gold could retain its appeal as a key safe-haven asset in the fourth quarter.
Technical Outlook Analysis OANDA:XAUUSD
Technical analysis:
Gold prices are maintaining a technical recovery after a strong correction from the peak of 4,379 USD/ounce. Currently, the price is trading around 4,118 USD, approaching the Fibonacci support zone of 0.618 (4,110 USD), an important milestone to determine the short-term supply-demand balance.
On the daily chart, gold is still in the medium-term uptrend channel formed since mid-August, with the MA21 average line (4,000 USD area) continuing to act as a dynamic support base. RSI has reached the 50 area and is showing signs of forming a slight bottom, reflecting the weakening selling momentum.
In terms of patterns, the candlestick cluster of the last 2 days shows a "hammer - recovery confirmation" pattern, suggesting that demand is reappearing at the technical bottom.
Trend Assessment:
If the $4,100 zone holds, there is a high probability that gold will enter a bullish consolidation phase towards the $4,200 mark. However, a break of the $4,000 zone would open up a deeper correction towards the $3,950 area.
In the context of lower interest rate expectations and geopolitical tensions that have not yet subsided, the medium-term trend of gold remains bullish, although the current recovery is more technical than a fundamental breakout.
SELL XAUUSD PRICE 4221 - 4219⚡️
↠↠ Stop Loss 4225
→Take Profit 1 4213
↨
→Take Profit 2 4207
BUY XAUUSD PRICE 4057 - 4059⚡️
↠↠ Stop Loss 4053
→Take Profit 1 4065
↨
→Take Profit 2 4071

GOLD Sell Signal (XAUUSD)📉 GOLD Sell Signal (XAUUSD)
🔹 Entry: 4140
🎯 Final Target: 4095
🛡️ Stop Loss: (Set according to your risk plan)
Analysis:
Gold is facing strong resistance around 4140, showing signs of bearish momentum. If sellers stay active below this level, price could move down toward 4095. Wait for confirmation with bearish candles or a break below intraday support before entering.
📊 Trend: Bearish Bias Developing
💬 Share your thoughts below & follow for more GOLD setups!
#Gold #XAUUSD #SellSignal #ForexSignals #BearishSetup #TradingView

GOLD Free Signal! Sell!
Hello,Traders!
GOLD SMC based setup forming after price mitigated the horizontal supply area and showed clear rejection. Smart money is likely offloading long positions here before targeting liquidity below recent equal lows.
-------------------
Stop Loss: 4,188$
Take Profit: 4,093$
Entry: 4,139$
Time Frame: 3H
-------------------
Sell!
Comment and subscribe to help us grow!
Check out other forecasts below too!
Disclosure: I am part of Trade Nation's Influencer program and receive a monthly fee for using their TradingView charts in my analysis.

The market is bearish, but I am firmly bullish.#XAUUSD OANDA:XAUUSD
From the perspective of the 4H cycle, the gold price is still above the rising trend line, and we remain bullish on intraday trading. As time goes by, the lower defense gradually moves up to around 4030. Holding this position, the trend remains bullish. The current gold rebound is slightly weak, and there may be another decline in the short term. Continue to pay attention to the support of 4100-4090 below. If it falls back to the support again and is not broken, we can consider going long on gold with a light position. The first target is 4130-4140, with a stop loss. If the short-term support is lost, look for opportunities below again.

Stop!Loss|Market View: NZDUSD🙌 Stop!Loss team welcomes you❗️
In this post, we're going to talk about the near-term outlook for the USDCAD currency pair☝️
Potential trade setup:
🔔Entry level: 0.57463
💰TP: 0.56839
⛔️SL: 0.57955
"Market View" - a brief analysis of trading instruments, covering the most important aspects of the FOREX market.
👇 In the comments 👇 you can type the trading instrument you'd like to analyze, and we'll talk about it in our next posts.
💬 Description: The New Zealand dollar continues to trade in a mid-term downtrend. Currently, this currency pair, as a commodity currency, is one of the most promising buying instruments for the USD, with further strengthening expected in the near future. Current prices are favorable for potential selling, but a false breakout near 0.57550 is possible, which would provide an even more reliable sell signal.
Thanks for your support 🚀
Profits for all ✅
❗️ Updates on this idea can be found below 👇

NO TRADE ZONE FOR GOLD!!!I was Looking for price to proceed with being bullish but it decided to breakdown. I'm not ready to buy again just yet. Need to see a full sweep on levels first. I think im going to sit on hands for the rest of the week.

Bullish potential detected for BGLEntry conditions:
(i) higher share price for ASX:BGL along with swing up of indicators such as DMI/RSI.
Depending on risk tolerance, the stop loss for the trade would be:
(i) below the long-term support level of $0.98 (from the open of 7th January), or
(ii) below the rising 30 day moving average (currently $0.94).

Gold (XAU/USD) Analysis – October 24, 2025Gold (XAU/USD) Analysis – October 24, 2025: Short-Term Retracement Before Another Drop?
Gold continues to move within a corrective structure after rejecting the upper Fibonacci zone around $4,280 – $4,300, showing signs of lower highs and declining momentum on the H1 chart. The recent price action suggests that buyers are losing strength, and the market might be preparing for another leg down.
On the technical side, price is currently hovering near $4,070, after forming a short-term base pattern. If this pullback extends higher, the area around $4,160 – $4,200 will likely act as a strong resistance zone — a potential region for sellers to step in.
Conversely, a clear rejection here could open the way for a deeper move toward the $4,000 – $3,980 support area, completing the projected harmonic swing.
Key levels to watch:
Resistance: $4,160 – $4,200
Support: $4,000 – $3,980
Fibonacci zone: 61.8% retracement aligns with $4,190
EMA trend: Price remains below EMA50, confirming short-term bearish bias
Trading strategy:
Wait for a retracement to the $4,160 – $4,200 zone to look for short setups with confirmation (bearish candle or RSI divergence). Target $4,000 area for potential take profit, with stops above $4,230.
Intraday traders may also scalp minor pullbacks as long as price stays below $4,200.
The overall structure remains bearish unless gold breaks and closes above $4,230, which would invalidate the current downside scenario.
Remember — patience is key in this consolidation phase. Wait for clear signals before entering.
If you find this analysis helpful, follow to get daily gold trading insights and strategies.

Gold Likely to Rise FurtherPEPPERSTONE:XAUUSD is demonstrating a well-structured movement within an ascending channel, where each price bounce is well-controlled, and every retracement follows a consistent pattern. The strength of the buyers is becoming increasingly evident, with technical dynamics becoming more organized and fluid.
After breaking through a key resistance level, the price is now retesting this level. If this level holds as solid support, the market is likely to continue its bullish momentum towards 4,500, which serves as the natural target aligned with the upper boundary of the ascending channel.
As long as the price remains above this support level, the upward trend will continue. However, if the price fails to hold and drops below this level, the trend structure will be at risk, and the likelihood of a technical correction towards the lower boundary of the channel will increase.
In this well-organized market condition, consistency and discipline in analysis are crucial. Carefully identify key points, wait for strong confirmation, and allow the trend to move in the predetermined direction.

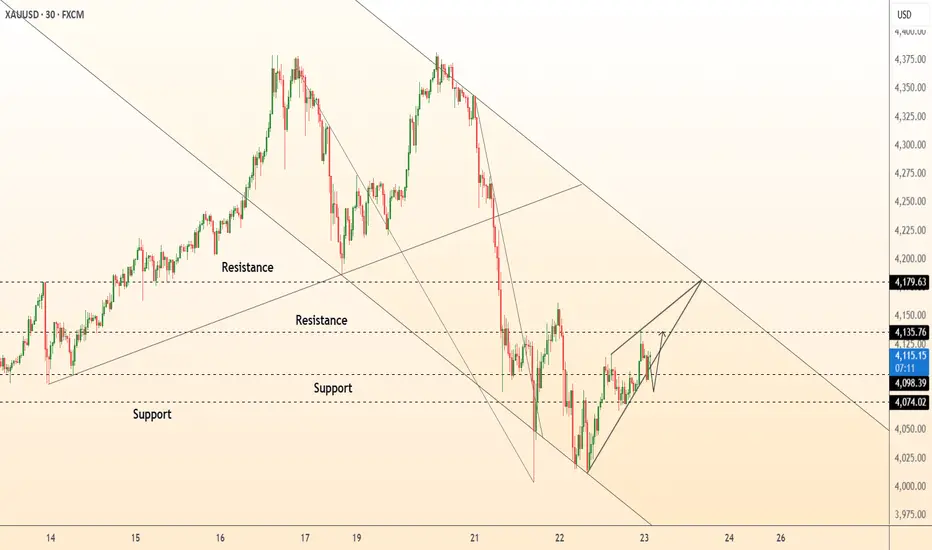
DeGRAM | GOLD rebounded in a descending channel📊 Technical Analysis
● XAU/USD is consolidating between 4,074 and 4,179, forming a short-term ascending structure within a broader descending channel.
● Price action suggests a potential breakout attempt above 4,135 toward 4,179, supported by higher lows and tightening range momentum.
💡 Fundamental Analysis
● Gold gains traction as traders anticipate weaker U.S. PMI data, which could limit dollar strength and revive demand for safe-haven assets.
✨ Summary
● Long bias above 4,100; targets 4,179. Technical compression and macro softness support short-term bullish continuation.
-------------------
Share your opinion in the comments and support the idea with a like. Thanks for your support!
XAUUSD: Market Analysis and Strategy for October 23Gold Technical Analysis
Daily Resistance: 4380, Support: 4000
4-Hour Resistance: 4185, Support: 4015
1-Hour Resistance: 4160, Support: 4065
Gold prices have fluctuated significantly recently. A trading institution recently reviewed the historical trends of gold prices after nine consecutive weeks of gains and concluded that a 20%-40% correction is typical over the next year, with the exception of 1970. Investors should be prepared for a potential multi-month decline of 20%-40% and manage their funds accordingly. However, the long-term bull market logic for gold remains solid. Factors such as the restructuring of the global monetary and credit system, the trend of de-dollarization, continued gold purchases by central banks, and structural imbalances in supply and demand constitute the core support for gold's rise.
This view also aligns with the forecasts of many international investment banks for gold prices next year. This year's insane rally is undoubtedly unsustainable. The simple reason is that there is no such thing as a stock that only rises and never falls in the trading market.
As for the future market trend, I personally believe that after the rebound, gold will fall below 4000 points, perhaps even back to the 3750-3850 range. This would be a very good place to buy the dip. It also represents the 50% and 61.8% golden ratios of the upward trend from the August low of around 3311. Furthermore, 4000 points is a key psychological support level for retail traders; a break below this level would prompt many undecided traders to exit.
For today's trading, follow a sideways range, selling high and buying low. Focus on the upper resistance levels of 4160/4185 and the lower support levels of 4065/4015.
BUY: 4065 near
BUY: 4015 near
SELL: 4160 near
SELL: 4185 near
More Analysis →

GOLD REBOUNDS AS INVESTORS BUY THE DIP AFTER ETF SELL-OFFGOLD | Prices Rebound Despite ETF Outflows 💰
Gold prices recovered after an earlier dip triggered by the largest single-day ETF outflow in five months, signaling profit-taking and a technical correction.
Despite investor caution, the metal maintains bullish momentum while trading above 4101, supported by safe-haven demand amid uncertainty ahead of U.S.–China trade talks.
Technically, as long as gold trades above 4101, upside targets remain 4124 → 4163 → 4189.
A clean 1H close below 4075 would shift momentum bearish, opening room toward 4053 and 4011.
Pivot Line: 4101
Resistance: 4124 – 4163 – 4190
Support: 4075 – 4053 – 4011

Copper breaks outNice breakout from a triangle continuation pattern in copper prices today. It looks like the metal has found a good base around $5.000 now and after a few days trying to test waters below this level, where the bears failed to exert pressure, prices have now broken higher. Good sign about global growth, apparently. We have seen stronger Chinse data this week. Can we now see a push towards the range highs again? Key levels to watch shown on the chart.
By Fawad Razaqzada, market analyst with FOREX.com

GBPJPY HIGH POTENTIAL SHORTFull Analysis & Trade Idea by Team 1602. Throughly analyze and produced by Team 1602.

Buy Pressure Building on GoldGold is displaying signs of buyer re-entry after a period of controlled downside movement. The recent liquidity sweep around the lower range indicates that short-term selling pressure has been largely absorbed, creating favorable conditions for a potential upward expansion.
Market activity suggests renewed interest from institutional participants accumulating within the current price zone. The consolidation phase appears to be forming a base, signaling the possibility of a directional shift as liquidity gradually migrates upward. Increasing momentum on the lower end of the range reflects confidence returning to the market, setting the stage for a possible continuation toward higher valuation areas.
The outlook remains constructive as long as current accumulation behavior sustains, with market sentiment leaning toward a recovery-driven advance in the near term.

XAU/USD – Gold eyes breakout towards 4370 and 4550 zonesGold (XAU/USD) is showing signs of a potential bullish reversal after consolidating around the 4110–4120 support zone. The market has been forming a short-term ascending structure on the 1H timeframe, suggesting accumulation before a possible breakout.
Technical outlook:
Key support: 4110 – 4100
Immediate resistance: 4160
Major resistance zones: 4370 and 4550
Indicators: RSI recovering from mid-range, price holding above short-term trendline, EMA cluster flattening around 4140 indicating potential energy build-up.
If bulls can push the price decisively above 4160, it may trigger a momentum move towards 4370, with an extended target at 4550, aligning with the upper Fibonacci retracement zone from the last major swing high.
However, failure to hold above 4100 could invalidate the bullish scenario and bring the price back to test 4050 or even 3980.
Trading strategy:
Buy zone: 4115 – 4125 (confirmation after breakout above 4160)
Take profit: 4370 / 4550
Stop loss: below 4095
This setup favors short-term swing traders watching for a trend continuation after a period of accumulation.
Stay disciplined with your entries and risk management—momentum confirmation above 4160 will be crucial before entering.
Follow for more daily setups and advanced Fibonacci-trendline strategies on Gold.
