Wheat in Focus: How Ukraine, China, and Weather could move WheatWheat is one of the world’s most widely traded agricultural commodities, essential for food and animal feed. Prices are heavily influenced by global supply and demand, with major producers including the U.S., Russia, the EU, Canada, Australia, and Ukraine. Weather conditions, geopolitical events, and large importer activity can all create significant volatility in the market. Let’s break it down.
1. What Drives Wheat Prices
Supply Factors
Wheat supply is heavily shaped by the major exporting regions—Russia, the EU, Australia, the U.S., Canada, and Ukraine. Weather is the biggest swing factor: drought, heat stress, floods, or winterkill can quickly tighten global supply and spark rallies. Crop progress reports and yield updates show how each production cycle is developing, while geopolitics—especially in the Black Sea—can disrupt export flows overnight. Input costs like fertilizer and fuel influence how much farmers plant, and currency moves affect which exporters are most competitive. Together, these factors determine how much wheat the world can actually deliver to the market. To summarize:
Major producers: Russia, EU, Australia, U.S., Canada, Ukraine
Weather: drought, heat stress, winterkill, floods
Crop progress: planting pace, crop conditions, yield expectations
Geopolitics: Black Sea tensions, export bans, sanctions, port disruptions
Input costs: fertilizer, fuel, logistics
Currency impact: strong USD usually weighs on wheat prices
Demand Factors
Demand for wheat is driven by global food consumption, animal feed needs, and the buying behavior of major importers such as China, Egypt, and Indonesia. Economic conditions matter because stronger economies consume more food and feed. Price relationships with other grains like corn and rice can shift demand toward or away from wheat. Changes in trade flows—such as China sourcing more from the U.S. instead of the Black Sea—can quickly redirect global shipments. These factors help traders understand whether demand is strengthening or weakening relative to available supply. To summarize:
Global consumption (food + feed use)
Large importer buying: China, Egypt, Indonesia, Turkey
Economic conditions in EM (Emerging Markets)
Substitution vs. corn/rice
Global trade flow shifts
2. Key Reports Traders Actually Need to Track
Instead of monitoring everything, wheat traders focus on the handful of reports that truly move price:
WASDE (Monthly) – The most important report in wheat trading. This is where global production, consumption, exports, and ending stocks get revised.
Wheat can rip or dump instantly on WASDE changes. If you track only one thing, track WASDE.
Weekly USDA Export Sales – This shows an immediate view of demand. Watch for:
Big purchases from China, Egypt, Indonesia
Surprising cancellations
Shifts from Black Sea to U.S. buying
It’s one of the fastest ways to spot demand changes ahead of price.
Crop Progress (Weekly, in season) – Important only during planting, growing and harvesting periods. The report tracks:
% planted
% harvested
Crop condition (% good/excellent)
Poor Conditions generally = bullish. Strong Conditions generally = bearish
Geopolitical headlines – In our opinion wheat is the most geopolitically sensitive commodity. Anything related to the following can cause immediate moves.:
Corridor shutdowns
Port attacks
Export bans
Ceasefire rumors
This is the intraday volatility driver that news traders capitalize on.
Weather in key regions (Daily / weekly) – Focus on the key regions of the U.S. Plains, Black Sea, Australia.
Drought in these regions generally = bullish. Good moisture generally = bearish.
Use simple sources like NOAA maps or short ag weather summaries (weather reports that impact agriculture).
CFTC COT (Weekly) – This is for context and is not used for trading signals. It shows whether funds are heavily long or short. Only the extremes matter:
Funds very short → short-covering rallies possible
Funds very long → risk of liquidation selloffs
This report is more relevant for swing and position traders.
3. Recent Market Drivers
Peace-proposal speculation:
Reports of a U.S. proposal involving Ukraine ceding Donbas triggered a fast selloff as markets priced in the possibility of Ukrainian exports normalizing.
Zelenskiy has stated he won’t accept territorial concessions, so a confirmed ceasefire remains unlikely unless U.S./EU pressure increases.
Market reaction:
Wheat dumped immediately on the headline, but the move didn’t sustain — traders want confirmation, not speculation.
China buying U.S. wheat:
Ongoing chatter that China is shifting some purchases to the U.S. (no official tonnage yet). This is a supportive demand story worth monitoring.
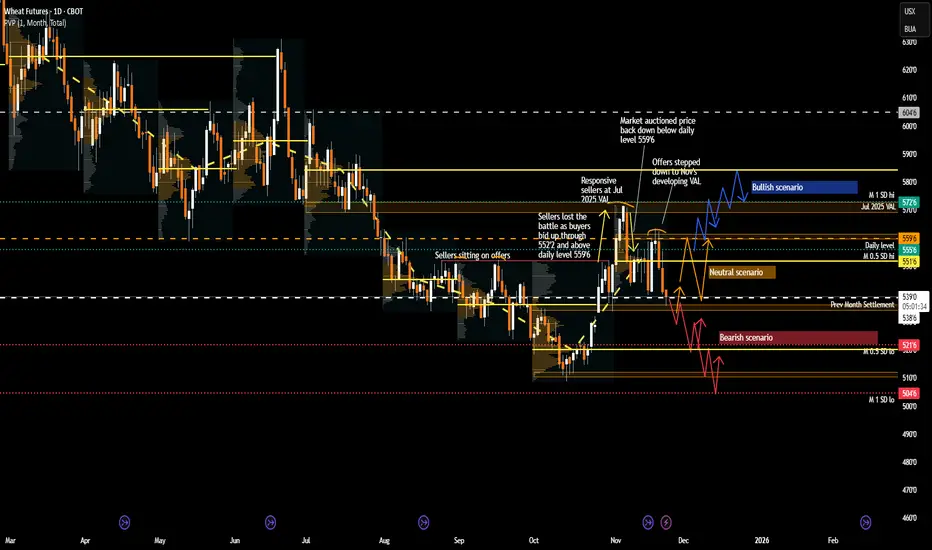
4. Chart Analysis: Recent Price Action and What to expect
The developing monthly VPOC for November 2025 has shifted higher, marking a potential change in market sentiment after three consecutive months of declining VPOCs. In addition, the developing VA for November appears unlikely to overlap with the previous month’s VA. This suggests that market conditions are changing and that the recent downward trend may be ending.
Market based out around 520 and rallied from mid-October to early November, breaking 552’4 (previous seller defense) and reclaiming back above 559’6 daily level.
This rally was likely supported by the potential U.S.–China trade deal and initial Chinese wheat purchases in early November.
However, sellers stepped in at 570 (July’s VAL + monthly 1SD high), offering price back below 559’6. Market is now rotating inside a developing range between 559’6 and the 540–535’6 zone (October settlement/LVN) to establish value.
Bearish Scenario
A break and acceptance below 540 opens the door toward:
520 (October’s VPOC + monthly 0.5SD low)
510 (October low)
504’6 (monthly 1SD low)
Catalyst: Any news of confirmed progress toward a Russia–Ukraine ceasefire → removal of war-premium → likely downside.
Bullish Scenario
If market accepts back above 559’6, sets up a move toward:
570 (July VAL / M 1SD high) — expect sellers here.
585’6 (July VPOC) if 570 is cleared
Catalyst: Headline reversal or escalation in the conflict between Russia and Ukraine.
Neutral Scenario
Without fresh catalysts, expect continued range rotation between 559’6 and 540, with the market establishing value in this zone.
5. Conclusion
Wheat remains a headline-driven and weather-sensitive market, where geopolitical developments, major buyer activity, and crop conditions can quickly shift sentiment. Traders should monitor key reports and technical levels while staying aware of global supply and demand dynamics. With multiple factors in play, range rotations and sudden spikes or drops are likely until a clear catalyst drives the market decisively.
What are your thoughts? Are you watching the headlines, weather, or technical levels for clues? Please share your insights below and give this post a boost so the rest of the community can join the conversation.
Glossary Index for technical terms used:
VAH (Value Area High)
VAL (Value Area Low)
VPOC (Volume Point of Control)
SD (Standard Deviation)
LVN (Low Value Node)
VA (Value Area)
Commodities
Gold Holds Firm at Elevated LevelsGold is trading today around 4,340 USD, almost unchanged from the previous session, indicating that the market remains stable at high levels after the recent strong rally.
Notably, during the prior U.S. session, gold surged to 4,367 USD, marking a new all-time high, before undergoing a mild pullback toward the end of the session. This highlights that buying interest remains highly active whenever the market is supported by favorable catalysts.
The main driver behind this move came from weaker-than-expected U.S. manufacturing data. The December Philadelphia Fed Manufacturing Index plunged to -10.2, far below forecasts, reigniting concerns about economic health and immediately triggering safe-haven flows into gold.
The release of these disappointing manufacturing figures alongside the November CPI and weekly jobless claims created a convergence effect, pushing gold into positive territory and driving prices to new record highs.
Although some forward-looking indicators continue to suggest growth expectations over the next six months, persistent price pressures and signs of economic slowdown are reinforcing expectations of a more accommodative monetary policy. This continues to provide a solid foundation for gold’s medium-term bullish trend.

Natural Gas Stock Forecast | Oil | Dollar | Silver | GoldCatch the latest commodities trading insights! This week's market analysis includes a look at both sides of the coin for oil, gold and silver. Plus, get some helpful technical analysis and trading tips to guide your decisions.
AMEX:UNG Natural Gas stock Bulls NatGas Support & Resistance Guide
NYMEX:CL1! USO Oil Stock price Forecast
DXY US dollar Stock analysis
COMEX:GC1! Gold XAUUSD Stock price Forecast
COMEX:SI1! Silver XAGUSD stock analysis

Silvers Worth More than Oil! CAUTION!The last time silver traded above both oil and gold was during the Hunt Brothers’ attempt to corner the silver market (arguably the original anti-government Crypto Bros speculators with Lambos, if you think about it. LOL!)
What makes the current setup different is that this move is occurring without a concentrated speculative corner. Silver is outperforming both oil and gold amid systemic monetary stress, driven by broad market forces rather than manipulation.
A currency crisis is therefore one of my leading candidates for what could ultimately blindside markets. It is not the only risk I am monitoring — there are other developing factors and potential catalysts — but this signal stands out and deserves close attention in my view.
Consider what’s happening simultaneously:
The JPY is collapsing in value
The BOJ is raising rates
The Japanese 10-year yield has surged to ~2.0%
The carry trade is being margin-squeezed
Gold is exploding relative to oil
Oil is collapsing
Silver is now outperforming both oil and gold
Trump Starting A Trade war with the world
The DXY is down ~10% since Trump took office.
China has cut U.S. Treasury holdings roughly in half
Central banks are buying gold aggressively
These are not isolated events. They are anomalies clustering at the same time, signaling the same problem. CUERRENCY!
People may not be talking about this with their mouths on social media with silly memes, but they are speaking very loudly & clearly with their MONEY! It’s usually worth listening to what they are saying. The problem is that 99.9% of people don't know what to listen to in a crowded stadium when everyone is yelling and cheering.
That’s why I post observations like this, even if they seem boring or unexciting. I could be more popular by “just giving you the trade,” but context matters. This information is often more important than people realize — especially before it shows up in price. ;)
Here are some of my other posts that relate:
I maintain my position my GTFO and STFO!
CAUTION IS IN ORDER!
THANK YOU for getting me to 5,000 followers! 🙏🔥
Let’s keep climbing.
If you enjoy the work:
👉 Drop a solid comment
Let’s push it to 6,000 and keep building a community grounded in truth, not hype.

Bearish drop?WTI Oil (XTI/USD) could make a short-term pullback to the pivot and could reverse to the swing low support.
Pivot: 60.30
1st Support: 54.80
1st Resistance: 65.75
Dow Jones (US30) is falling towards the pivot, which is a pullback support and could rise to the 161.8% Fibonacci extension.
Pivot: 47,063.30
1st Support: 45,135.60
1st Resistance: 50,049.13
Disclaimer:
The opinions given above constitute general market commentary and do not constitute the opinion or advice of IC Markets or any form of personal or investment advice.
Any opinions, news, research, analyses, prices, other information, or links to third-party sites contained on this website are provided on an "as-is" basis, are intended to be informative only, and are not advice, a recommendation, research, a record of our trading prices, an offer of, or solicitation for, a transaction in any financial instrument and thus should not be treated as such. The information provided does not involve any specific investment objectives, financial situation, or needs of any specific person who may receive it. Please be aware that past performance is not a reliable indicator of future performance and/or results. Past performance or forward-looking scenarios based upon the reasonable beliefs of the third-party provider are not a guarantee of future performance. Actual results may differ materially from those anticipated in forward-looking or past performance statements. IC Markets makes no representation or warranty and assumes no liability as to the accuracy or completeness of the information provided, nor any loss arising from any investment based on a recommendation, forecast, or any information supplied by any third party

Bullish continuation on Gold?The is falling towards the pivot and could bounce to the 1st resistance, which is a swing high resistance.
Pivot: 4,244.05
1st Support: 4,140.68
1st Resistance: 4,379.38
Dow Jones (US30) is falling towards the pivot, which is a pullback support and could rise to the 161.8% Fibonacci extension.
Pivot: 47,063.30
1st Support: 45,135.60
1st Resistance: 50,049.13
Disclaimer:
The opinions given above constitute general market commentary and do not constitute the opinion or advice of IC Markets or any form of personal or investment advice.
Any opinions, news, research, analyses, prices, other information, or links to third-party sites contained on this website are provided on an "as-is" basis, are intended to be informative only, and are not advice, a recommendation, research, a record of our trading prices, an offer of, or solicitation for, a transaction in any financial instrument and thus should not be treated as such. The information provided does not involve any specific investment objectives, financial situation, or needs of any specific person who may receive it. Please be aware that past performance is not a reliable indicator of future performance and/or results. Past performance or forward-looking scenarios based upon the reasonable beliefs of the third-party provider are not a guarantee of future performance. Actual results may differ materially from those anticipated in forward-looking or past performance statements. IC Markets makes no representation or warranty and assumes no liability as to the accuracy or completeness of the information provided, nor any loss arising from any investment based on a recommendation, forecast, or any information supplied by any third party

GOLD FREE SIGNAL|SHORT|
✅XAUUSD reacts precisely from a premium ICT supply zone, delivering a bearish rejection after tapping buy-side liquidity. Displacement confirms bearish intent, with market structure shifting lower. Expect continuation toward resting sell-side liquidity below the range low.
————————————
Entry: 4,341.60$
Stop Loss: 4,357.00$
Take Profit: 4,317.96$
Time Frame: 2H
————————————
SHORT🔥
✅Like and subscribe to never miss a new idea!✅

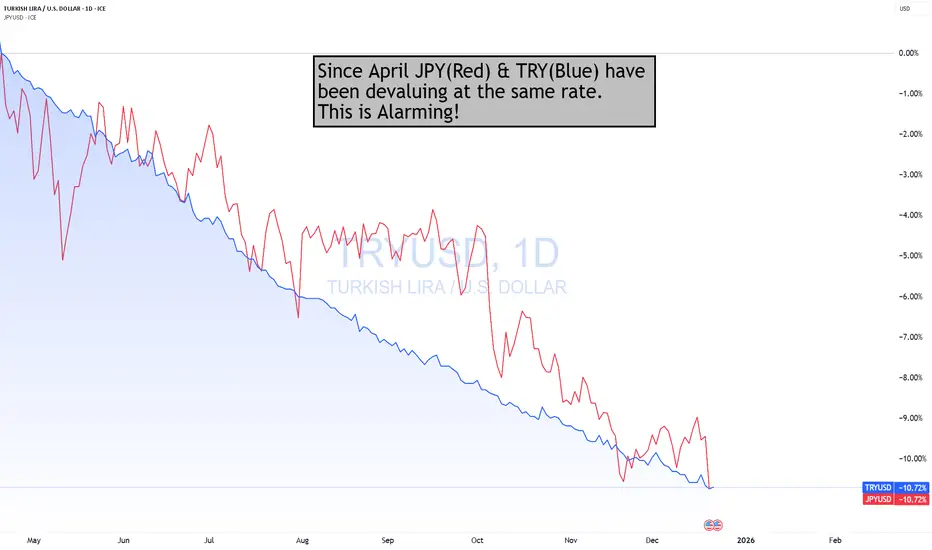
JPY Devaluing At The Same Rate As TRY Against $Since April, the JPY has been falling at the same rate as the TRY against the $. This is Alarming, should the trend continue.
This makes this even more interesting, is that the DXY since Trump took office, has dropped almost by the same amount!
What is important to also understand is that the JPY is 145 of the DXY. As such, if the JPY were to strengthen (all else being equal) the DXY would be down even more!
How would that help the "AFFORDABILITY HOAX" if the $ keeps devaluing, requiring more $s to buy the same amount of goods & services?
Now, does it make a bit more sense why Gold & Silver have soared this year?
I hate to keep harping on JPY, but it is important to all traders/investors in all asset classes, not just FX.
THANK YOU for getting me to 5,000 followers! 🙏🔥
Let’s keep climbing.
If you enjoy the work:
👉 Boost
👉 Follow
👉 Drop a solid comment
Let’s push it to 6,000 and keep building a community grounded in truth, not hype.
SILVER Bullish Bias! Buy!
Hello,Traders!
SILVER delivers a clean displacement through a key horizontal range, confirming bullish BOS and smart money continuation. The breakout holds above prior supply-turned-support, suggesting acceptance and strength, with upside liquidity resting at higher premium levels. Time Frame 2H.
Buy!
Comment and subscribe to help us grow!
Check out other forecasts below too!
Disclosure: I am part of Trade Nation's Influencer program and receive a monthly fee for using their TradingView charts in my analysis.

ASTER/USDT (4H) Chart Pattern...ASTER/USDT (4H) Chart Pattern– Targets (Based on the Chart)
The chart shows a strong downtrend with price trading below the descending trendline and a bearish continuation move.
📉 Bearish Targets:
Target 1: 0.60
Target 2: 0.45
Main Target: 0.25 – 0.20 (marked target zone)
🛑 Resistance / Invalidation:
Resistance: 0.82 – 0.85
A 4H close above 0.85 would weaken the bearish setup.
📌 Summary:
As long as price stays below the descending trendline, further downside toward 0.25–0.20 is expected.
If my want, I can also provide entry, stop-loss, and take-profit levels or a bullish alternative scenario.

SOL/USDT – 2H chart patternSOL/USDT – 2H chart pattern (Based on the Chart)
The chart shows a descending channel with a bearish breakdown. Based on that structure:
📉 Bearish Targets:
Target 1: 120.00
Target 2: 115.00
Main Target: 108.50 – 104.00 (marked target zone)
🛑 Resistance / Invalidation:
Resistance: 128.00 – 130.00
A strong close above 130 would weaken the bearish setup.
📌 Summary:
As long as price stays below the descending channel resistance, continuation to 108–104 is likely.
If my want, I can also give:
Exact entry / SL / TP
Scalp or swing setup
Bullish alternative scenario

Gold Key LevelsThese are Gold Key levels
4225.00
4238.01
4251.04
4264.09
4277.16
4290.25
4303.36
4316.49
4329.64
4342.81
4356.00
4369.21
4382.44
4395.69

SILVER: Short Trading Opportunity
SILVER
- Classic bearish formation
- Our team expects pullback
SUGGESTED TRADE:
Swing Trade
Short EURUSD
Entry - 67.212
Sl - 67.647
Tp - 66.419
Our Risk - 1%
Start protection of your profits from lower levels
Disclosure: I am part of Trade Nation's Influencer program and receive a monthly fee for using their TradingView charts in my analysis.
❤️ Please, support our work with like & comment! ❤️

USOIL: Short Trade Explained
USOIL
- Classic bearish pattern
- Our team expects retracement
SUGGESTED TRADE:
Swing Trade
Sell USOIL
Entry - 56.53
Stop - 56.72
Take - 56.20
Our Risk - 1%
Start protection of your profits from lower levels
Disclosure: I am part of Trade Nation's Influencer program and receive a monthly fee for using their TradingView charts in my analysis.
❤️ Please, support our work with like & comment! ❤️

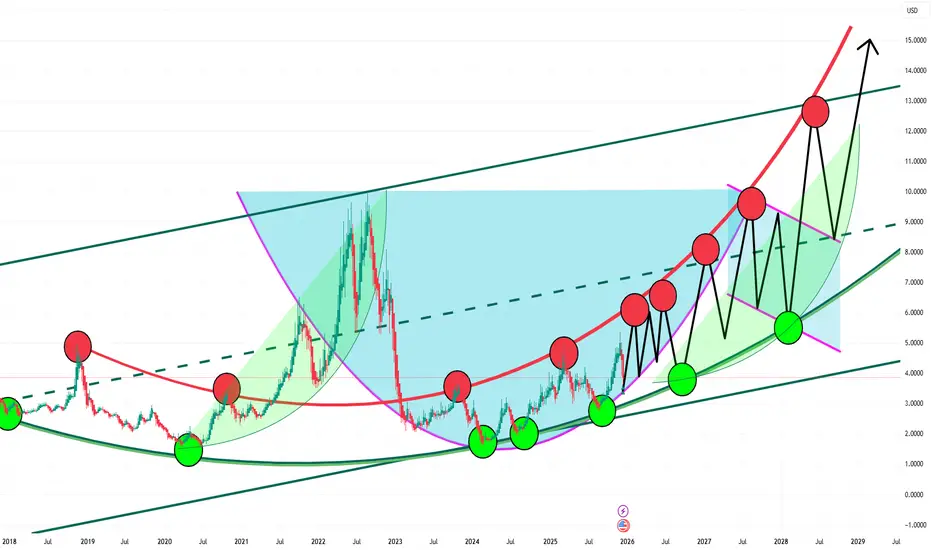
Fibonacci Time Zone Confirmation ((07.SEP.2026 and 27.MAR.2028))Fibonacci Time Zone confirmation of the optimal and lowest buying opportunities within the extended 10-year bullish channel, aligned with the formation of a cup pattern that is projected to complete in 2028, with 27.March.2028 appearing to represent the absolute low, the launch point, and a level from which price is not expected to return.

XAUUSD: Resistance Holds Strong - Support $4,270 Retest LikelyHello everyone, here is my breakdown of the current XAUUSD setup.
Market Analysis
XAUUSD is trading within a broader bullish structure, but the current price action shows signs of a short-term corrective phase after a strong impulsive move higher. Earlier, gold successfully broke above the Triangle Resistance Line, which marked the end of the previous bearish pressure and confirmed a shift in market control toward buyers. Following this breakout, price entered a Range phase, where the market consolidated and built liquidity before the next move. This consolidation was later resolved with a strong breakout above the Range, pushing XAUUSD into a higher price zone and confirming continued bullish momentum.
Currently, after the breakout, gold rallied sharply and reached the Resistance Zone around 4,350–4,360, where sellers began to react. This area has historically acted as a strong supply zone, and the current rejection indicates that selling pressure is increasing at these highs. At the moment, price is pulling back from the resistance and moving toward the Support Zone around 4,270, which aligns with the previous breakout structure and the rising Trend Line. This zone represents a key demand area where buyers previously stepped in.
My Scenario & Strategy
My scenario is short-term corrective as long as XAUUSD remains below the 4,350 Resistance Zone and continues to show rejection from this level. I expect price to retrace toward the 4,270 Support Zone, where the next reaction will be critical for short-term direction. A clean breakdown below the 4,270 Support Zone would signal a deeper correction and could open the path toward lower demand levels along the trend line.
However, if price reaches support and shows a strong bullish reaction, the broader bullish structure remains intact, and buyers may attempt another push toward the resistance highs. For now, the market is in a pullback phase, with 4,270 as the key level to watch for confirmation of either continuation or deeper correction.
That’s the setup I’m monitoring. Thank you for your attention, and always manage your risk.

0.5 Fibonacci Retracment version of the Cup0.5 Fibonacci Retracment version of the Cup within the limits of the extended blulish Channel
USOIL Is Bullish! Long!
Take a look at our analysis for USOIL.
Time Frame: 1D
Current Trend: Bullish
Sentiment: Oversold (based on 7-period RSI)
Forecast: Bullish
The market is on a crucial zone of demand 56.495.
The oversold market condition in a combination with key structure gives us a relatively strong bullish signal with goal 60.210 level.
P.S
Please, note that an oversold/overbought condition can last for a long time, and therefore being oversold/overbought doesn't mean a price rally will come soon, or at all.
Like and subscribe and comment my ideas if you enjoy them!

Trading plan for the last week of 20251️⃣ Trendline
Main ascending trendline (price channel):
The medium-term trend remains bullish. Price is moving within the channel and is currently in the upper half, → favor buying with the trend.
Upper trendline:
Dynamic resistance, aligning with Fibonacci extensions → high probability of volatility and profit-taking around this area.
2️⃣ Resistance
4,380 – 4,400:
Strong resistance zone, confluence of the upper trendline + Fibonacci 2.618 → a clear breakout and hold is required to open further upside momentum.
4,510:
Next upside target if price breaks and holds above 4,380 (higher Fibonacci extension zone).
3️⃣ Support
4,260 – 4,270:
Short-term support, demand zone + moving averages → losing this zone may trigger a deeper correction.
4,140 – 4,150:
Major support below, near the lower trendline of the ascending channel → strategic buy zone in line with the overall trend.
4️⃣ Fibonacci
Fibonacci retracement highlights:
0.382 – 0.5: Intermediate support during pullbacks.
2.618 – 3.618: Key resistance/target zones above, where price is likely to react strongly.
📈 TRADE SETUPS
BUY GOLD: 4,260 – 4,258
Stop Loss: 4,248
Take Profit: 100 – 300 – 500 pips
SELL GOLD: 4,400 – 4,402
Stop Loss: 4,412
Take Profit: 100 – 300 – 500 pips

Gold vs Uranium: Barter Valuation. Forecast to 2040❗️** Disclaimer: ** This idea is part of a larger comprehensive article on Uranium. To fully understand the context and the big picture, please refer to the main article at the link below:
☢️ Uranium: Defining the Future. 2025–2050 Vision & Forecast
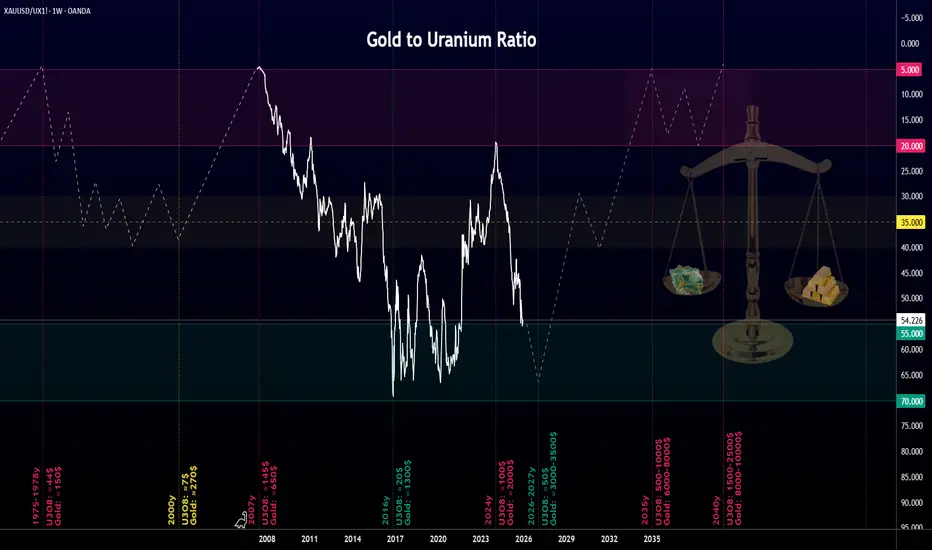
⚖️ Gold vs Uranium: Barter Valuation. Forecast to 2040
Investing in U3O8 is not a bet on temporary hype, but on a structural shift where energy sovereignty becomes more valuable than money. To assess the true value of uranium, undistorted by inflation, we use the barter GOLD/Uranium Ratio . This chart shows how many pounds (lb) of uranium can be purchased with one ounce (oz) of gold.
Historical Context and Ranges
For better visual perception, the chart is inverted and divided into three zones:
🔴 Red (5–20): Range of "expensive" uranium.
🟡 Yellow (approx. 35): Historical median. Equilibrium barter price.
🟢 Green (55–70): Range of "cheap" uranium.
Historically, the Au/U ratio spent the vast majority of its time in the 5–40 lb per oz range, fluctuating there for nearly half a century (from the 1960s-70s to 2016). After 2008, the orgy of serial QE (Quantitative Easing) led to severe distortions not only in the ⚖️ Gold/Uranium Ratio , but also in the ⚖️ Gold/Silver Ratio , ⚖️ Gold/Oil Ratio , and ⚖️ Gold/Sugar Ratio .
📊 Key marks highlighted on the chart demonstrate the volatility:
🔴 1976–78 (Ratio ≈3.5): At the peak of the first nuclear boom caused by the oil crisis, uranium was at the peak of strategic importance ($40–44 per lb), making the ratio minimal.
🟡 2000 (Ratio ≈36): This was the bottom of the "nuclear winter." The market was flooded with weapons-grade Uranium (Megatons to Megawatts). Uranium was at its cheapest ($7 per lb).
🔴 2007 (Ratio ≈4.4): The second speculative peak. Explosive growth fueled by the realization of scarcity. The price of uranium rose by +2000%, reaching an ATH of $148, once again making the ratio minimal (as in the 70s).
🟢 2016 (Ratio ≈69): This is the absolute historical maximum, where uranium ($20 per lb) was most undervalued relative to gold and the US dollar. This was the point of maximum strategic undervaluation.
🔴 2024 (Ratio ≈20): Since the Covid hysteria, the ratio sharply recovered to its normal historical values, first to the (🟡yellow) 35 area, and then down to 20:1. During this time, uranium prices rose by +500% from the $17.5 low (in 2016) to the $106 high (in 2024). After such a sharp rise, a correction in uranium prices followed from the 2024 peaks, with the ratio expanding again from 20 toward the 40-55 lb per oz area.
🟢 Forecast for 2026–2027 (Ratio ≈60): A temporary pullback. It is expected that against the backdrop of a global recession (2025–2026) and the ongoing correction (from $106 toward $50 per lb), uranium prices—along with gold—may temporarily decline. The ratio will expand again toward the borders of "cheap" uranium at 55–70:1 . The projected phase is a strategic "golden opportunity" to acquire the asset before the new cycle of atomic explosive growth.
🔴 Forecast to 2035–2040 (Ratio 5-20): The Culmination. In the 8–15 year horizon, when SMRs begin mass-powering Data Centers, the deficit will become critical and the hype (similar to today's AI) will hit its peak. The Au/U ratio will first return to its historically "fair" yellow 30-40, and then enter the red 5–20:1 range.
🧮 Technical Justification of Long-Term Targets
Let’s solve this math problem using the formula:
A/B = X
Where X is the unknown future price of uranium in USD, A is the expected price of gold, and B is the expected Gold/Uranium ratio.
If we conservatively assume that gold rises to $8,000 by 2035 (which is only +80-100% from current levels), and the Au/U ratio returns to 10–20:1, we get a uranium price in the $400–800 per lb range. If, at the culmination of the explosive growth, the GOLD/Uranium Ratio hits 5:1 (as observed in the final growth stages of 1977 and 2007), the price of U3O8 would reach $1,600 per lb. Therefore, long-term forecasts with bold targets of $500, $1,000, and even $2,500 per lb are not outrageous or impossible.
Consequently, the projected peak of the new growth cycle should be expected within the red zone (5-20), defined as the "expensive" uranium range relative to gold. This is simply mathematical confirmation that amidst rising inflation, severe scarcity, global logistics issues, ever-increasing demand from Data Centers, and the inflation of yet another Technocracy bubble, Uranium will return to the red zone over the next 7-10 years, positively impacting the cost of U3O8 in US dollars.
❗️ Disclaimer: This idea is part of a larger article on uranium with a forecast for 2025-2050. To fully understand the context and the big picture, please refer to the main article at the link below:
☢️ Uranium: Defining the Future. 2025–2050 Vision & Forecast
What to Expect From Gold on Monday?!
As Christmas Holidays are just around the corner, we see that
many instruments started to slow down and overall volatility dropped
significantly.
Gold remained relatively calm the last week too.
The price formed a narrow horizontal range on an hourly time frame,
respecting that from Tuesday.
I think that we will see a continuation of such a consolidation after the market opening.
Gold will likely stay calm at least till the release of the US Core PCE Price Index
after the NY Session opening.
Expect price movements within the range.
❤️Please, support my work with like, thank you!❤️
I am part of Trade Nation's Influencer program and receive a monthly fee for using their TradingView charts in my analysis.

XAUUSD 51st Record High of 2025 | Symmetrical Triangle BreakoutHistoric Context - A Record-Breaking Year
According to the Wall Street Journal and Dow Jones Market Data released December 19, 2025:
Gold futures have closed at record highs 51 times in 2025
Price has surged 66 percent year-to-date to 4387.30 USD per troy ounce
This is gold's best annual performance since 1979
Silver has soared 131 percent in 2025, hitting 14 record highs
Both metals are on pace for their biggest gains since 1979, the last year they hit this many records
This historic context is critical for understanding current price action. We are not in a normal market environment. Gold is experiencing a generational bull run driven by central bank accumulation, geopolitical uncertainty, and monetary policy expectations.
Current Market Context - December 20, 2025
Gold experienced volatility following the Federal Reserve December 18, 2025 policy decision. The central bank maintained its hawkish stance, projecting fewer rate cuts for 2026 than markets anticipated. Despite this headwind, gold recovered and hit another record high on December 19.
The resilience above 4300 USD despite hawkish Fed rhetoric demonstrates the strength of underlying demand from central banks and institutional investors.
Key Events This Week:
December 18: Federal Reserve held rates steady, projected only two rate cuts for 2026 versus market expectations of three to four
December 18: US Dollar Index surged following hawkish Fed commentary, initially pressuring gold
December 19: Gold recovered to close at 51st record high of 2025 at 4387.30 USD according to WSJ
December 19: CFTC COT report released showing strong speculative long positioning
December 20: Price consolidating near 4338 USD within symmetrical triangle pattern
Ongoing: PBOC and Chinese ETF buying continues despite record high prices
Ongoing: Physical demand weakness in India and China as discounts widen to multi-year highs
Technical Structure Analysis
Pattern Identification - Symmetrical Triangle
The 45-minute chart displays a textbook symmetrical triangle formation characterized by:
Converging trendlines with lower highs and higher lows
Decreasing volatility as price compresses toward the apex
Volume declining during the consolidation phase
Pattern duration of approximately 10-12 days
Apex convergence point approaching within the next 24-48 hours
Symmetrical triangles are continuation patterns approximately 55-60 percent of the time, but given the preceding choppy price action, this formation could break in either direction.
Triangle Boundaries
Upper Trendline (Descending Resistance):
Connects the highs from December 12-13 around 4380-4390 USD
Currently intersecting near 4355-4360 USD
A decisive close above this trendline signals bullish breakout
Lower Trendline (Ascending Support):
Connects the lows from December 9-10 and December 18-19
Currently providing support near 4300-4310 USD
A decisive close below this trendline signals bearish breakdown
Key Price Levels
Resistance Levels:
4355-4360 USD - Descending trendline resistance immediate
4380-4390 USD - Recent swing high and horizontal resistance
4400-4410 USD - Psychological resistance and previous rejection zone
4450-4475 USD - Major resistance from November 2025 highs
4500 USD - Psychological round number and measured move target
Support Levels:
4310-4320 USD - Ascending trendline support immediate
4280-4290 USD - Horizontal support from December lows
4250-4260 USD - Previous consolidation zone
4200-4220 USD - Major support and psychological level
4150-4175 USD - Secondary support if breakdown accelerates
Moving Average Analysis
Price is oscillating around the 20-period moving average indicating indecision
The 50-period moving average is relatively flat confirming the consolidation phase
The 200-period moving average on higher timeframes remains in uptrend supporting long-term bullish bias
A sustained move above the 20 and 50 MAs would confirm bullish momentum
A breakdown below both MAs would signal bearish continuation
RSI Analysis
RSI on the 45-minute timeframe is currently neutral oscillating between 45-55
No overbought or oversold conditions present
RSI is forming a similar compression pattern to price suggesting energy building for directional move
Watch for RSI to break above 60 for bullish confirmation or below 40 for bearish confirmation
Volume Analysis
Volume has been declining during the triangle formation typical behavior before breakout
Expect volume surge on the breakout candle to confirm validity
Low volume breakouts often result in false moves and should be treated with caution
Watch for volume at least 150 percent of average on breakout candle
Fibonacci Analysis
Measuring from the December low near 4200 USD to the December high near 4390 USD:
0.236 retracement: 4345 USD - Currently testing this level
0.382 retracement: 4317 USD - Aligns with triangle support
0.5 retracement: 4295 USD - Key level if support breaks
0.618 retracement: 4273 USD - Strong support zone
Current price action around 4338 USD is testing the 0.236 Fibonacci level, a relatively shallow retracement suggesting buyers remain interested.
CFTC Commitments of Traders Analysis - December 19, 2025
The latest COT report released December 19, 2025 provides critical insight into market positioning:
Gold Futures Only Positions as of December 9, 2025:
Open Interest: 432,569 contracts
Non-Commercial Long: 268,485 contracts ( 62.1 percent of open interest)
Non-Commercial Short: 44,599 contracts (10.3 percent of open interest)
Commercial Long: 63,707 contracts (14.7 percent)
Commercial Short: 326,286 contracts ( 75.4 percent )
Changes from December 2, 2025:
Open Interest increased by 14,079 contracts
Non-Commercial Longs added 7,154 contracts
Non-Commercial Shorts added only 828 contracts
Commercial Shorts added 10,791 contracts
COT Interpretation:
The positioning data reveals several important dynamics:
Speculators (Non-Commercial) are heavily net long with 62.1 percent long versus only 10.3 percent short
This represents a 6:1 long to short ratio among speculators - extreme bullish positioning
Commercial hedgers (producers and merchants) are heavily short at 75.4 percent, which is normal hedging behavior in a bull market
Open interest is increasing alongside price, confirming the uptrend has participation
The continued addition of speculative longs suggests momentum traders remain committed to the bull case
Warning Signal: Extreme speculative long positioning can precede corrections when longs begin to take profits. However, in strong trending markets, positioning can remain extreme for extended periods. The key is watching for a shift in the weekly changes - if longs start liquidating while price stalls, that would be a bearish signal.
Physical Demand Analysis - Asia Market Weakness
Reuters reported on December 19, 2025 that physical gold demand in Asia has weakened significantly due to record high prices:
India Market:
Dealers offering discounts of up to 37 USD per ounce to official domestic prices, up from 34 USD last week
Domestic gold prices hit fresh record of 135,590 rupees per 10 grams
Demand is roughly one quarter of normal levels according to PN Gadgil and Sons CEO
Wedding season jewelry purchases dampened despite being peak demand period
Demand expected to remain subdued as prices continue rising
China Market:
Bullion trading at discounts of up to 64 USD to global benchmark - highest in over five years
This is the widest discount since August 2020 during COVID-19 pandemic
Wholesale and retail demand described as incredibly weak by analyst Ross Norman
However, ETF buying and PBOC purchases continue despite weak physical demand
Other Asian Markets:
Singapore: Trading from 0.5 USD discount to 2.2 USD premium
Hong Kong: Trading from par to 1.8 USD premium
Japan: Discounts up to 6.0 USD, though retail shops out of gold bar stocks
Physical Demand Interpretation:
The divergence between weak physical demand and strong prices is significant:
Traditional price-sensitive buyers in India and China are stepping back at these levels
However, institutional demand (ETFs, central banks) is offsetting physical weakness
PBOC continues accumulating gold as part of reserve diversification strategy
This suggests the rally is being driven by institutional and speculative flows rather than traditional jewelry demand
A correction could occur if institutional buying slows, as physical demand is unlikely to provide support at current prices
Fundamental Analysis
Federal Reserve Policy Impact
The December 18, 2025 FOMC meeting delivered several key takeaways affecting gold:
Interest rates held steady as expected but forward guidance was more hawkish than anticipated
Dot plot projections showed median expectation of only two rate cuts in 2026
Fed Chair emphasized data dependency and willingness to maintain restrictive policy longer if needed
Inflation concerns remain despite progress with services inflation proving sticky
Labor market remains resilient reducing urgency for rate cuts
Implications for Gold:
Higher-for-longer interest rates are traditionally bearish for gold as they increase the opportunity cost of holding non-yielding assets. However, gold has shown remarkable resilience to rate expectations in 2024-2025, suggesting other factors are driving demand.
US Dollar Dynamics
The US Dollar Index strengthened following the hawkish Fed reaching multi-week highs
Dollar strength typically pressures gold prices due to inverse correlation
However the correlation has weakened in recent months as both assets attract safe-haven flows
Watch DXY price action for confirmation of gold direction
A reversal in dollar strength would provide tailwind for gold
Central Bank Demand
Central bank gold purchases remain a crucial support factor despite weak retail demand:
Global central banks have been net buyers of gold for consecutive years
PBOC (People's Bank of China) continues accumulating gold alongside Chinese ETF buying according to analyst Ross Norman
India central bank has increased gold reserves significantly
Emerging market central banks continue accumulating gold as reserve diversification from USD
This institutional and central bank demand is offsetting weak physical retail demand in Asia
Central bank buying provides structural floor under prices even when retail demand weakens
Geopolitical Factors
Safe-haven demand remains elevated due to:
Russia-Ukraine conflict continues with no resolution in sight
Middle East tensions remain elevated with ongoing regional instability
US-China relations remain strained with trade and technology disputes
Global election cycle creating policy uncertainty
Debt ceiling and fiscal concerns in major economies
These factors support gold safe-haven bid and help explain its resilience despite hawkish Fed policy.
Directional Bias Assessment
Arguments for Bullish Breakout:
Gold has hit 51 record highs in 2025 - momentum clearly favors bulls
Best annual performance since 1979 with 66 percent YTD gains
Long-term uptrend remains intact on daily and weekly timeframes
COT data shows speculators adding to long positions with 62.1 percent long exposure
Central bank and ETF demand continues despite weak physical demand
PBOC accumulation ongoing according to analyst reports
Geopolitical tensions maintaining safe-haven bid
Technical measured move target of 4480-4500 USD if triangle breaks higher
Arguments for Bearish Breakdown:
Extreme speculative long positioning (6:1 ratio) creates correction risk
Physical demand in India at one quarter of normal levels
China discounts at 64 USD - widest since August 2020
Hawkish Fed policy supporting stronger dollar and higher yields
Price has risen 66 percent in one year - mean reversion risk elevated
Holiday liquidity reduction could exacerbate any profit-taking
Technical measured move target of 4200-4220 USD if triangle breaks lower
My Assessment - Cautiously Bullish with Correction Risk:
The weight of evidence supports the bull case given the historic momentum and institutional demand. However, several warning signs warrant caution:
Extreme speculative positioning creates vulnerability to profit-taking
Physical demand weakness in Asia suggests price-sensitive buyers are exhausted
The rally is increasingly dependent on institutional flows rather than broad-based demand
Short-term (next 1-2 weeks): Neutral to slightly bearish. The combination of extreme positioning, weak physical demand, and holiday liquidity conditions creates correction risk. A pullback to 4280-4320 USD would be healthy and provide better entry for longs.
Long-term (1-3 months): Bullish. The structural drivers (central bank buying, geopolitical uncertainty, monetary policy expectations) remain intact. Any correction should be viewed as buying opportunity. Targets of 4500-4600 USD remain valid for Q1 2026.
Trade Framework
Scenario 1: Bullish Breakout Trade
Entry Conditions:
45-minute candle closes decisively above 4360 USD upper trendline
Volume on breakout candle exceeds 150 percent of 20-period average
RSI breaks above 60 confirming momentum
Ideally accompanied by dollar weakness DXY declining
Trade Parameters:
Entry: 4365-4370 USD on confirmed breakout
Stop Loss: 4330 USD below triangle midpoint
Target 1: 4400-4410 USD previous resistance
Target 2: 4450-4460 USD November highs
Target 3: 4500-4520 USD measured move target
Risk-Reward: Approximately 1:2.5 to first target
Scenario 2: Bearish Breakdown Trade
Entry Conditions:
45-minute candle closes decisively below 4300 USD lower trendline
Volume on breakdown candle exceeds 150 percent of 20-period average
RSI breaks below 40 confirming bearish momentum
Ideally accompanied by dollar strength DXY rising
Trade Parameters:
Entry: 4295-4300 USD on confirmed breakdown
Stop Loss: 4340 USD above triangle midpoint
Target 1: 4250-4260 USD horizontal support
Target 2: 4200-4220 USD major support
Target 3: 4150-4175 USD measured move target
Risk-Reward: Approximately 1:2 to first target
Risk Management Guidelines
Position sizing should not exceed 1-2 percent risk per trade given current volatility
Reduce position size during holiday period due to lower liquidity
Use hard stop losses do not move stops further from entry
Scale out of positions at each target level 33 percent at each target
Move stop to breakeven after first target achieved
Avoid holding large positions over weekend given geopolitical risks
Monitor DXY and Treasury yields for confirmation of gold direction
Be prepared for false breakouts wait for candle close confirmation
Invalidation Levels
Bullish thesis invalidated if:
Price closes below 4250 USD on daily timeframe
Triangle breaks down with volume confirmation
DXY breaks to new highs above 110
Bearish thesis invalidated if:
Price closes above 4410 USD on daily timeframe
Triangle breaks up with volume confirmation
DXY reverses sharply below 106
Conclusion
OANDA:XAUUSD has delivered a historic performance in 2025 with 51 record highs and 66 percent gains - the best year since 1979. The precious metal is currently consolidating within a symmetrical triangle near 4338 USD, setting up for the next directional move.
Key Data Points:
51 record highs in 2025 according to Dow Jones Market Data
66 percent YTD gains - best since 1979
COT shows 62.1 percent speculative long positioning (6:1 long/short ratio)
India physical demand at 25 percent of normal levels
China discounts at 64 USD - widest since August 2020
PBOC and ETF buying continues despite weak retail demand
Key Takeaways:
The symmetrical triangle is approaching its apex suggesting a breakout is imminent within the next 24-72 hours
Historic momentum (51 records) supports bullish bias but extreme positioning creates correction risk
Physical demand weakness in Asia is a warning sign that price-sensitive buyers are exhausted
Institutional demand (central banks, ETFs) is currently offsetting retail weakness
Short-term bias is neutral with correction risk; long-term bias remains bullish
Bullish breakout targets 4450-4500 USD; bearish breakdown targets 4250-4280 USD
Risk management is critical given extreme positioning and holiday liquidity conditions
The optimal approach is to wait for confirmed breakout with volume rather than anticipating direction. Given the extreme speculative positioning, any breakdown could trigger rapid profit-taking. Conversely, a breakout to new highs could accelerate as shorts cover.
Trade the breakout, not the anticipation. Let price confirm direction before committing capital.
This is not financial advice. Always conduct independent research and manage risk appropriately.

GOLD Will Go Down! Sell!
Hello,Traders!
GOLD rejects a well-defined horizontal supply zone after a sharp impulsive push, indicating smart money distribution at premium. The reaction shows bearish intent, with downside liquidity resting below recent structure likely to be targeted as price re-enters a corrective phase.Time Frame 2H.
Sell!
Comment and subscribe to help us grow!
Check out other forecasts below too!
Disclosure: I am part of Trade Nation's Influencer program and receive a monthly fee for using their TradingView charts in my analysis.
