Bitcoin’s Next Move Starts Here Key Levels MappedBTC is currently in a technically critical phase. Price is trading below a major dynamic trendline resistance after a confirmed bearish break, keeping the broader structure corrective rather than impulsive. Momentum remains capped unless bulls reclaim key dynamic levels.
The plan from here is straightforward and scenario-based:
A. If price retraces into the Immediate Dynamic Trendline (IDT) and gets rejected again, that rejection becomes a high-probability short trigger. In that case, downside continuation toward the Demand Pool Zone (DPZ) is expected to complete leg 5 of the corrective wave. This zone is where I would anticipate strong accumulation and a relief rally, targeting a move back into the Supply Pool Zone (SPZ).
B. Alternatively, if BTC breaks and holds above the IDT, momentum should accelerate to the upside, with the Supply Pool Zone remaining the primary upside target, exactly as mapped on the chart.
What happens at the Supply Pool is decisive. If bulls fail to hold price and we see a strong rejection, that would confirm distribution and could trigger a complete bearish expansion, opening the door to much deeper targets, potentially toward the $50k region.
Market is at a decision point.
Are you bullish or bearish from here?
Let’s discuss your view
Contains image

Market Panic: Gold or Crypto?When the market enters a state of panic, the question is no longer “How much profit can I make?” but rather “Which asset helps me survive and protect my capital?”
In moments like these, gold and crypto are often placed side by side. Both are seen as safe havens—but in very different ways, and that difference is the key to making the right decision.
1) Gold – Where Capital Flows When Confidence Breaks
Gold has existed for thousands of years with one core purpose: preserving value.
When inflation rises, geopolitical tensions escalate, or the financial system shows signs of stress, large capital tends to move into gold first.
Why gold performs well during crises:
High global liquidity, accepted across all markets
Relatively “orderly” volatility, suitable for defensive positioning
Often benefits when real interest rates fall and the USD weakens
In other words, gold won’t make you rich overnight, but it helps you avoid being washed away when the storm hits.
2) Crypto – An Asset Driven by Expectations and Emotion
Crypto represents a new generation of assets, where value is heavily influenced by future expectations, technology narratives, and speculative capital.
In normal or euphoric market conditions, crypto can rise very quickly.
But when panic sets in, the story changes.
Here’s the reality we need to face:
Crypto reacts extremely sensitively to “risk-off” sentiment
High leverage + thin liquidity during stress periods can trigger chain liquidations
In major shocks, crypto is often sold alongside growth stocks, rather than acting as a true safe haven
Therefore, crypto is not a defensive asset in the traditional sense—it is an asset of belief and market cycles.
3) When Should You Choose Gold? When Should You Hold Crypto?
The answer is not “which is better,” but what the market context is.
True panic (systemic risk, war, financial crisis):
➡ Gold is usually the preferred choice.
Capital seeks certainty, not stories.
Short-term crisis followed by monetary easing:
➡ Gold often leads the first wave,
➡ Crypto tends to recover more aggressively after a psychological bottom forms.
Stable markets with abundant liquidity:
➡ Crypto performs at its best.
4) My Perspective: Don’t Choose with Emotion
From my experience, the biggest mistake traders make during panic is choosing assets based on personal belief instead of capital flow and market behavior.
A professional trader asks:
Where is large capital taking refuge?
Is current volatility suitable for my trading style?
Is my goal capital preservation or outsized returns?
If your priority is safety and stability, gold is usually the more reasonable choice.
If you accept high risk in pursuit of high reward, crypto should only be approached after clear confirmation, not during extreme panic.

GBPUSD - Relief Rally Into Resistance? Sellers Watching Closely📉GBPUSD remains overall bearish on the higher timeframe. Price is still trading within a descending structure, and the broader trend continues to favor sellers rather than buyers.
The recent upside move is best viewed as a corrective bounce, not a trend reversal. Price is now approaching a key confluence zone, where the former structure, horizontal resistance, and the descending trendline align.
This is the type of location where trend-following shorts become interesting. I’m not interested in selling blindly, but rather in waiting for lower-timeframe bearish confirmation once price reacts at this resistance zone.
⚔️As long as price remains below the descending trendline and fails to reclaim the range above, the bearish bias stays intact. A clean break and hold above this resistance would be the only thing that forces a reassessment.
For now, this looks like sellers getting another chance at a better price.
Will this resistance cap the move once again, or do bulls finally break the structure? 🤔
⚠️ Disclaimer: This is not financial advice. Always do your own research and manage risk properly.
📚 Stick to your trading plan regarding entries, risk, and management.
Good luck! 🍀
All Strategies Are Good; If Managed Properly!
~Richard Nasr

Liquidity Sweep: All the Info You Ever Need to ConquerHi whats up guys, today lets try to do it in a bullet points instead of writing my stories.
• Liquidity is the reason price moves.
• Markets move toward areas where orders are stacked.
• Most orders sit above highs and below lows.
• That’s why price keeps attacking those areas again and again. 🧪 What a liquidity sweep really is
• A liquidity sweep is a move beyond a clear high or low.
• Its purpose is to trigger clustered stop losses.
• It is not personal and not about your stop.
• It is required so larger players can enter or exit positions. 🧪 Why most traders get caught
• Traders enter at obvious levels inside ranges.
• They usually use tight stop loss
• These areas become liquidity pools.
• Price must visit them before a real move starts. 🧪 Double tops and bottoms
• Repeated reactions are not strength.
• They are preparation.
• Every touch builds more resting stops.
• Triple tops and bottoms are even more attractive.
• Never enter before price runs into them. 🧪 How I read market structure
• I don’t focus on patterns in isolation.
• I focus on where liquidity is being collected.
• Structure is simply the path price takes to grab orders.
• The real move usually starts after the sweep.
1️⃣ USDCHF Sweep and Long - CIOD confirmation click picture👇https://www.tradingview.com/chart/USDCHF/2AbnD2TR-USDCHF-I-Daily-CLS-range-I-Key-Level-FVG-I-HTF-CLS/ 2️⃣ USDJPY Sweep andLong - CIOD confirmation - Click picture 👇https://www.tradingview.com/chart/USDJPY/j18Eh18R-USDJPY-Weekly-CLS-I-Key-Level-OB-Model-1/ 3️⃣ AUDUSD Turtle Sweep and short - CIOD confirmation click picture👇https://www.tradingview.com/chart/AUDUSD/YzC7vNOf-AUDUSD-I-Daily-CLS-range-I-Manipulation-I-Short/
📌 Up Trend - Trade Stop Hunt (LQ Sweep) buy below the lows
– Highs are broken
– Lows are respected
– Liquidity below is being cleaned 📌 Down Trend - Trade Stop hunts (LQ Sweep) sell above the highs
– Lows are broken
– Highs are respected
– Liquidity above is being cleaned 🧪 Stop hunts are not random
• Quick wicks at range extremes are intentional.
• Trendline breaks often appear before reversals.
• Breakout traders provide liquidity.
• The move after the stop hunt is what matters.
1️⃣ EURUSD Short Click picture below to see how price action formed 👇https://www.tradingview.com/chart/EURUSD/vgXOeYfG-EURUSD-Daily-Range-LQ-taken-Rates-cut-was-priced-in/ 2️⃣ GBPUSD Short Click picture below to see how price action formed 👇https://www.tradingview.com/chart/GBPUSD/FKtc84k9-GBPUSD-Daily-CLS-Liqudity-taken-Model-1-Oposing-side-target/ 3️⃣ USDCHF Long Click picture below to see how price action formed 👇https://www.tradingview.com/chart/USDCHF/WrvLuU3j-USDCHF-Daily-CLS-Model-Long-from-KL-rates-cut-is-priced-in/ It's effective because it capitalizes on the retail traders classic mistakes- FOMO and trading break out of the highs and selling the lows. While market makers are doing the opposite (don't get me wrong, Im also retail trader and you are too) trading so called smart money concepts doesn't make us smart money traders.
🧪 How I use stop hunts
• I never enter at the first touch of a level.
• I wait for price to go through it.
• Only after the sweep do I look for entries.
• This gives better timing and tighter risk.
📌 Bearish Scenario - (LTF view) - price (yellow has structured movements and should be crating AMD profiles on the edge of the range. We need to drop to LTF to read the structure. 📌 Bullish Scenario ITF view - Price should not have candle close below the range on the same timeframe otherwise setup is invalidated and new range created. 🧪 Where liquidity sweeps matter most
• Range highs and lows
• Previous week high or low
• Clear swing extremes
• Higher-timeframe key levels
• Daily and weekly ranges 🧪 CLS strategy connection
• Liquidity sweep is the foundation of my CLS approach.
• Fake breakouts create urgency and FOMO.
• Late buyers and sellers get trapped.
• I trade against that behavior.
🧠 Having mechanical system with backtested data is your EDGE.
💪 That is what makes you DISCIPLINED TRADER.
📌 Bullish continuation setups
Model 1 - Entry after manipulation - 50% target
Model 2 - Entry on pullback on level between 61.8 - 80% pullback 📌 Bearish Continuation setups
Model 1 - Entry after manipulation - 50% target
Model 2 - Entry on pullback on level between 61.8 - 80% pullback 🧪 Manipulation phase
• No manipulation means no institutional move.
• Liquidity must be taken first.
• Big candles after sweeps signal readiness.
• That is where opportunity appears.
🧪 Basic CLS workflow
• Define higher-timeframe trend
• Define the range near a key level
• Wait for price to sweep the high or low
• No candle close outside the range on that timeframe
• Enter only after manipulation
📌 Bullish LTF Range within HTF Range
Analyze HTF range and define models, then drop it to your TF and trade your ranges with the HTF range. Always follow the same process only on the LTF - Lower timeframe. 📌 BearishLTF Range within HTF Range
Analyze HTF range and define models, then drop it to your TF and trade your ranges with the HTF range. Always follow the same process only on the LTF - Lower timeframe. 🧪 Why this approach fixes psychology
• Rules remove hesitation
• Backtesting builds confidence
• Losses become expected data points
• Overtrading naturally disappears
🧪 Brief note on SMT
• Sometimes price moves without LQ sweep its because of SMT
• In other words Sweep has happen on correlated pair so it doesn't have to happen on the we are looking for.
• If it’s not at a key level, I ignore it.
📌 SMT EURUSD and GBPUSD Example
GU - just shallow manipulation but creates clean OB
EU - Deeper manipulation but OB created later.
🧪 Final perspective
• Liquidity is sweep / Stop hunt / manipulation is happening ona key levels where mostly traders enters false break to the wrong side and those who has been right are now taken out.
📌 Example of manipulation
Less informed traders bought early and other group of Turtles selling the break out of the lows, they are wrong on the lows. Sellers were used as liqudity and buyers are now trapped in the long where price reverse against them.
I promised myself I’d become the person I once needed the most as a beginner. Below are links to a powerful lessons I shared on Tradingview. Hope it can help you avoid years of trial and error I went thru.
📊 Sharpen your trading Strategy
⚙️ 100% Mechanical System - Complete Strategy
🔁 Daily Bias – Continuation
🔄 Daily Bias – Reversal
🧱 Key Level – Order Block
📉 How to Buy Lows and Sell Highs
🎯 Dealing Range – Enter on pullbacks
💧 Liquidity – Basics to understand
🕒 Timeframe Alignments
🚫 Market Narratives – Avoid traps
🐢 Turtle Soup Master – High reward method
🧘 How to stop overcomplicating trading
🕰️ Day Trading Cheat Code – Sessions
🇬🇧 London Session Trading
🔍 SMT Divergence – Secret Smart Money signal
📐 Standard Deviations – Predict future targets
🎣 Stop Hunt Trading
🧠 Level Up your Mindset
🛕 Monk Mode – Transition from 9–5 to full-time trading
⚠️ Trading Enemies – Habits that destroy success
🔄 Trader’s Routine – Build discipline daily
💪 Get Funded - $20 000 Monthly Plan
🛡️ Risk Management
🏦 Risk Management for Prop Trading
📏 Risk in % or Fixed Position Size
🔐 Risk Per Trade – Keep consistency
Adapt what is useful. Reject what is not. Add something of your own.
David Perk aka Dave FX Hunter

You Don’t Lose by Being Wrong — You Lose by OveranalyzingYour problem isn’t that you don’t understand the market.
In fact, most losing traders understand the market fairly well. They know what a trend is, where key levels sit, and which side the structure is leaning toward. But when it’s time to make a decision, they sabotage that edge with something very familiar: just a little more analysis.
At first, everything is clear. The chart tells a simple story.
Then doubt creeps in. You zoom into another timeframe. Add another zone. Add another tool. Not because the market demands it, but because you’re not ready to accept the risk of a decision. And with every extra layer of analysis, you don’t gain more certainty — you create another narrative.
This is the key point many traders miss:
the market hasn’t changed — the story in your head has.
When you overanalyze, you’re no longer reading the market; you’re negotiating with yourself. One timeframe says buy, another says wait. One level looks valid, another suddenly looks dangerous. In the end, you’re no longer searching for a good opportunity — you’re searching for reasons to delay or reverse a decision. And by the time you enter, you’re either late or lacking conviction.
Overanalysis also destroys your sense of informational weight.
On a chart, not all data carries equal value. A price level in the right context is worth more than ten minor signals. But when everything is marked, everything looks “important,” and you lose sight of what’s actually worth risking money on. The market needs prioritization, not enumeration.
Here’s an uncomfortable truth:
Many traders overanalyze not because they’re curious, but because they’re afraid to commit. They fear being wrong, so they look for more confirmation. But the market doesn’t reward the trader with the most confirmations. It rewards the trader who accepts risk at the right location. Every time you delay a decision through analysis, you move yourself further away from that location.
I only started trading better when I realized this:
analysis is not meant to make decisions certain — it’s meant to make them reasonable.
Beyond that point, what matters is discipline and acceptance of outcomes. The market doesn’t require you to be right 100% of the time. It only requires that you don’t break your own structure.
If you often find yourself “right on direction but wrong on results,” try cutting back on analysis. Not to oversimplify the market, but to clarify what truly matters. When the picture is already clear, adding detail doesn’t make it better — it just makes you hesitate.
And in trading, hesitation is often more expensive than being wrong.

Rambling off about Mitsubishi Heavy IndustriesAs you can see by the title of this idea it will be me writing about a company i think is interesting. It might end up being a lengthy read but I don't know how much I will manage to write before I get bored or covered all the topics I think are important from an investors point of view because I want to try and stay on topic when I write my ideas as best I can. Don't think that this is some kind of trading advice because its not, actually it makes me upset when people ask me to tell them if I think the price of a stock or index will go up or down. I can say that I wouldn't buy it if I didn't think it would go up, but I don't know when it will go up.
Looking at the valuation of the stock first, it appears to be quite overvalued and I'm going to hold off on buying it for awhile. There's a few reasons why I am going to wait to buy it, the first reason actually is because I only wanted to allocated 1 or 2 percent of my portfolio to the stock and for some reason right now it is prohibited to open a new position on the depository receipts. I would already start buying the stock if this was not the case but there's nothing I can do except wait for the trading permission to be available again. Like I said the stock is also very overvalued right now, there's really not any realistic room for upside in the near future. Granted that would not have stopped me from buying it, I probably would have still bought it if the OTC exchange would have allowed me because I just want to own the stock and price is not the most important thing to me when making these decisions.
I have started expanding my knowledge beyond most conventional ideas and have made my way into the Japanese stock market. Since I worked in the industries for a majority of my life I can't help but find the Japanese stock market incredibly interesting to me. I feel like a lot of the companies are major industrial entities in the world, I think most people might overlook the importance of some of the companies that trade on the Tokyo stock exchange. Mitsubishi Group is actually a vast conglomerate company which expands across hundreds of companies. Mitsubishi Heavy Industries is responsible for managing its business operations in sectors like aerospace, defense, energy and heavy machinery, which also happen to align with my personal preference of companies that I like to invest in.
As you can see I have added some photos to my idea and I'm not trying to offend anyone when I posted photos of airplanes but this is one of the core business operations of the company and I have to say what I want to. That being said I also added some other photos of Mitsubishi products. The company is famously an engineering company at its core, I don't want to write too much about the history of the company even though I probably can dedicated several paragraphs to just that.
I am going off topic a little bit here so I am going to go back on topic and now write about some of the ways Mitsubishi Heavy Industries uses capital in their business. This is a key element for every investor to pay attention to when deciding whether they will buy shares of a stock or not. Since the company is a conglomerate it will be pretty straight forward, there's really nothing special about how they utilize capital, pretty much the same as other conglomerate companies. I wrote an idea about Berkshire Hathaway some time ago and I think that is a text book example of how an ideal conglomerate company would want to utilize capital. Mitsubishi is a little different though because they are actually an industrial company and not a financial company like Berkshire. So its like comparing apples to oranges essentially.
It would be safe to assume the business model for Mitsubishi Heavy Industries is so incredibly complicated and need I say, unpredictable but I would also use words like reliable or necessary. Since I worked in heavy industries for along time I know it well and its easy for me to interpret the things I think will make the company money over a long period of time. I am starting to feel like it would make me bored to try and write about the specific elements of capital allocation now. In all seriousness I really just like the company and that's why I decided to write this idea today. I will probably keep exploring the Japanese stock market and might come up with more random ideas to share.

Lingrid | GOLD Price Action Continues Range-BoundOANDA:XAUUSD remains supported above the trendline after rejecting lower prices, with recent pullbacks failing to break the higher-low sequence. Price is compressing beneath the upper resistance band, suggesting absorption rather than distribution, while the broader structure still favors continuation within the ascending channel. Momentum has cooled, but selling pressure appears contained so far.
If buyers continue to protect the 4,300 support cluster, gold could gradually push back toward the 4,360 resistance area, where a breakout attempt may emerge. Sustained acceptance above that zone could open room for a renewed extension higher.
➡️ Primary scenario: support holds at 4,300 → advance toward 4,360.
⚠️ Risk scenario: a decisive breakdown below may weaken the bullish structure and shift focus back to deeper support.
If this idea resonates with you or you have your own opinion, traders, hit the comments. I’m excited to read your thoughts!

XAU Near All-Time Highs Bullish Continuation or Fake Breakout?Hello and respect to all TradingView followers 🙌
Hope you’re having profitable trades and disciplined risk management 📊💚
🟡 Gold Market Overview (XAUUSD)
Gold has always been considered a safe-haven asset, especially during periods of economic uncertainty, inflationary pressure, and geopolitical tensions.
Recently, gold has maintained a strong bullish structure across all timeframes, attracting both long-term investors and short-term traders 📈
At the moment, price is very close to its All-Time High (ATH). However, a new historical high has not been confirmed yet, making this zone extremely critical and decision-making for the market ⚠️
📊 Technical Analysis
🔼 Bullish Scenario
Overall market structure remains bullish on all timeframes
Price is holding above dynamic support (ascending trendline)
If price breaks and firmly closes above the ATH resistance, we can expect:
Continuation of the bullish trend
Formation of new All-Time Highs
Entry into price discovery mode 🚀
📌 Key confirmation: strong candle close above resistance + sustained momentum
🔽 Bearish (Corrective) Scenario
Despite the bullish trend, momentum weakness is visible near the ATH zone
If price fails to break the resistance and we see:
Rejection from resistance
Or a fake breakout
then a healthy correction becomes likely
Potential downside targets:
Nearest static support zones
And in a deeper pullback, the dynamic support (ascending trendline)
🔹 Such a move would be considered a normal correction within a larger bullish trend, not a trend reversal 🔄
🧠 Summary
Overall trend: Bullish
Current price location: Near All-Time High
Market condition: Sensitive zone + momentum weakness
Trading approach: Wait for confirmation — breakout or rejection
⚠️ Disclaimer
This analysis is for educational purposes only and not financial advice.
Always manage your risk properly and follow your own trading plan 💼📉
📣 Poll Question
❓ Do you think gold will successfully print new All-Time Highs?
🔘 Yes, after a confirmed breakout
🔘 No, a deeper correction comes first
Share your thoughts in the comments 👇👇
🏷️ Tags
#Gold #XAUUSD #TechnicalAnalysis #PriceAction
#SupportResistance #ATH #TradingView
#Forex #Commodities #SmartMoney
#BullishTrend #MarketStructure #TradingPsychology 💹
XAUUSD Near All-Time Highs Bullish Continuation or Fake Breakout?

Gold vs Real Estate: Which Is Safer?Gold vs Real Estate: Which One Truly Keeps Your Money Safe in Uncertain Times?
When markets turn unstable, the first question that always comes up is: “ How do I keep my money safe ?”
Almost immediately, two familiar names are put on the scale: gold and real estate .
One is a globally recognized defensive asset.
The other is a tangible asset tied to land and long-term growth cycles.
But safety does not lie in the name of the asset — it lies in how you use it .
Safety does not mean “never going down”
Many people mistakenly believe that a safe asset is one that never declines in price. In reality, every asset goes through corrections .
True safety means:
When you need cash, can you actually convert it?
When markets deteriorate, can you withstand the psychological and cash-flow pressure?
When the cycle shifts, does that asset help you survive?
And this is exactly where gold and real estate begin to diverge.
Gold — safety through liquidity and defense
Gold is considered safe because it does not depend on a single economy . When inflation rises, crises emerge, or confidence in fiat currencies weakens, gold is often chosen as a safe haven.
Gold’s greatest strength is liquidity . It can be converted into cash almost instantly, nearly anywhere in the world. This makes gold an effective defensive tool during periods of strong market volatility.
However, gold does not generate cash flow . Its price can also move sideways for long periods, requiring patience and a capital-preservation mindset rather than a get-rich-quick mentality.
Real estate — safety through tangibility and long-term value
Real estate feels safe because it is tangible and familiar . The land remains. The property remains. Over the long term, real estate tends to appreciate alongside economic growth and urbanization.
In addition, real estate can generate rental income , something gold cannot offer. For investors with stable capital and no pressure to rotate funds quickly, this is a major advantage.
The trade-off, however, is low liquidity . When markets weaken or credit conditions tighten, selling property can take a long time. If leverage is involved, this so-called “safe asset” can quickly become a financial burden.
The core difference: time horizon and flexibility
Gold suits investors who value flexibility and fast response .
Real estate suits those with long-term vision, substantial capital, and the ability to endure cycles .
Gold helps you defend in the short to medium term .
Real estate helps you build wealth over the long term .
No asset replaces the other.
They differ only in their role within your financial strategy .

Santa Rally / V-Shaped Recovery WatchNASDAQ:QQQ continues to respect the 50 & 100 DMA, just like every selloff since July. Momentum indicators are exiting oversold territory, suggesting a familiar upside rotation.
AMEX:SPY confirms.
AMEX:IWM remains structurally bullish on the monthly (cup & handle).
CRYPTOCAP:BTC shows classic oversold mean reversion behavior.
Key risk: loss of 100 DMA.
Bias: upside continuation while support holds.

BNB's Situationhe triangle pattern will break in the direction it is breached, and the price will move in that direction. In my opinion, the price could be bullish and may up to $970.
Best regards CobraVanguard.💚

BTC at Premium Zone | Smart Money Eyes Lower Levels📝 Description
Market structure on M15 remains bearish within the higher-timeframe context, despite the recent bullish retracement. Price is now retracing into a premium zone, aligning with the H1 OTE (0.618–0.786) of the last bearish displacement, without any confirmed CHOCH + BOS combination to validate a bullish reversal.
________________________________________
📈 Signal / Analysis
Primary Bias: Bearish below 88,500–88,800
Short Setup (Preferred Scenario):
• Entry (Sell): 88,120
• Stop Loss: Above 88,500 (above H1 swing high)
• Take Profit 1 (TP1): 87,500
• Take Profit 2 (TP2): 86,900
• Take Profit 3 (TP3): 86,600
________________________________________
🎯 ICT & SMC Notes
• Price currently reacting inside H1 OTE (0.618–0.786)
• Clear Bearish Order Block (H1) acting as supply
• H4 Order Block below price remains unmitigated
• No valid CHOCH + BOS sequence confirming trend reversal
• RSI structure aligns with corrective pullback, not momentum expansion
________________________________________
🧩 Summary
The current price action represents a corrective retracement within a dominant bearish market structure. As long as BTC remains capped below the 88,500–89,000 premium resistance, continuation toward lower HTF liquidity pools is favored. Rejection from the current OTE zone strengthens the probability of a bearish expansion toward unmitigated H4 demand and order blocks.
________________________________________
🌍 Fundamental Notes / Sentiment
Recent signals around a potential Bank of Japan rate hike have added pressure to global risk assets. A tighter Japanese monetary policy strengthens the yen and reduces carry-trade liquidity, which historically impacts crypto and equities negatively. As yen-funded positions unwind, capital flows shift toward safety, limiting upside momentum in Bitcoin. In this environment, crypto remains vulnerable to downside moves unless global liquidity conditions ease or major risk-on catalysts emerge.
________________________________________
⚠️ Risk Disclosure
Trading involves substantial risk and may result in capital loss. This analysis is for educational purposes only and does not constitute financial advice. Always apply proper risk management, predefined stop-loss levels, and disciplined position sizing aligned with your trading plan.

THE KOG REPORT - UpdateEnd of day update from us here KOG:
We close out another successful week in the markets and for the KOG Report, which once again delivered as expected. The objective was clear, capture the move from the highs into the lows, anticipate the RIP, and then target the region above levels that ultimately came into play.
The projected path highlighted the potential for a RIP at that area, and the market responded decisively.
Additionally, yesterday’s highlighted hotspot has now fully played out, reinforcing the effectiveness of a level to level, point to point approach, the Camelot way.
Right now, price is trading above the order region in a thin volume environment and is struggling to sustain a break above 4355 into the close. While support remains a possibility at these levels, a failure to hold could open the door to another sell-off similar to yesterday’s move.
Given the late Friday session and the risk surrounding an upcoming Trump announcement, we believe standing aside is the prudent choice.
We wish you all a great weekend and look forward to seeing you on Sunday for the next KOG Report.
As always, trade safe.
KOG

DOGEUSDT above 0.15$ the massive pump will start again soonAs highlighted in our previous analysis, the $0.15 level remains a significant technical resistance for DOGE. A decisive breakout above this level—particularly with increasing trading volume—would serve as a key confirmation of renewed bullish momentum and likely initiate a sustained upward move.
In such a scenario, the next primary technical target would be projected near the $0.40 zone, based on measured move calculations from the breakout point. Traders should monitor volume and price action closely around $0.15 for confirmation before anticipating extended upside progress.
DISCLAIMER: ((trade based on your own decision))
<<press like👍 if you enjoy💚

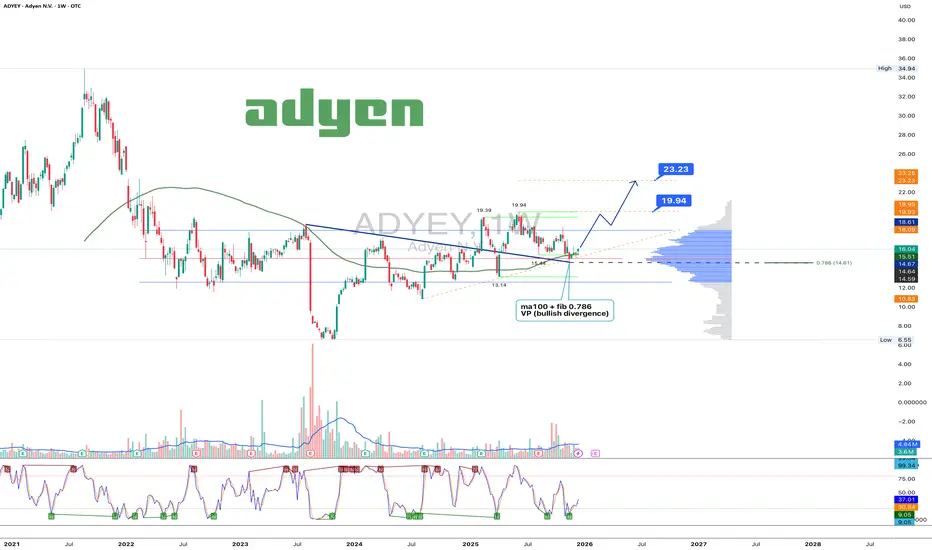
Adyen 1W: The trend broke twice, the market is just catching upOn the weekly chart, Adyen has broken the long term downtrend twice, and price is now performing a controlled pullback retest. The current consolidation holds above the $15.5–16.0 demand zone, where MA100, 0.786 Fibonacci and strong volume profile support align. Selling pressure is fading, volumes on the pullback are declining, and bullish divergence remains intact. This structure favors confirmation of the breakout rather than a return to a bearish trend. As long as price stays above this zone, upside remains the priority. First target stands at $19.94, followed by $23.23.
Fundamentally, Adyen continues to deliver consistent growth. H1 2025 revenue reached $1.28B, up from $1.13B in H2 2024. H2 2025 revenue is projected at $1.49B, with forecasts extending toward $1.53–1.88B in 2026–2027. EPS came in at $0.18 for H1 2025, with $0.21 expected in H2, rising toward $0.25–0.26 by 2027. Analyst sentiment leans bullish as digital payment volumes continue to expand globally.
When a trend breaks twice, patience usually gets paid.
XRP EXITS DESCENDING BROADENING WEDGES💥 Hey, gonna keep this idea pretty short today since this is mainly a follow up off of yesterday's idea as shown below for reference:
💥 In yesterday's Idea we spoke on how XRP was in a descending broadening wedge and our price target of $1.99, we're waiting on that for confirmation of a bullish reversal though we can see off today's chart that bulls were able to reclaim some ground using the wedge as some technical support to bounce. We can see our 20, 50 EMA's have already converged so it'll be a matter now if whether or not we can avoid falling back within the wedge and reenter our descending channel.
💥 If we manage to break back into our descending channel then I would keep mind of that $1.99 level as it'll play a crucial resistance point until we're above it and even so the next thing will be if we can sustain and regain our 200 EMA to form a bullish crossover else we'll keep facing some volatile activity till the retail market and technical traders get some more bullish confirmation.
💥 Alongside this a big part is sentiment, things are still uneasy as ever. We've still got strong inflows into Bitcoin and positive fundamentals but with macroeconomic concerns and persistent selling pressure, liquidations and Bitcoin trading in this volatile range facing $70k again if it can't break resistance levels, $90k in particular. I would keep these things in mind, we know January has a chance of being a positive month if past-price action proves correct else we may continue to see choppy waters for a few weeks till we get some positive news or some catalyst and better sentiment.
💥 Thanks for tuning in, really appreciate everyone and the words as always, thanks and hope the holidays treat you all well. All the best and happy holidays till next.
Best regards,
~ Rock '

What Is the Bull Side – and What Is the Bear Side?In trading, there are concepts that everyone has heard of , but not everyone truly understands correctly . “ Bull side ” and “ Bear side ” are two such terms. Many traders use them every day, yet often assign them overly simplistic meanings: bulls mean buying, bears mean selling.
In reality, behind these two concepts lies how the market operates , how capital flows think , and how traders choose which side to stand on .
What Is the Bull Side?
The Bull side (bulls) represents those who expect prices to rise . However, bulls are not simply about buying .
The true essence of the bull side is the belief that the current price is lower than its future value , and that the market has enough momentum to continue moving upward .
The bull side typically appears when:
Price structure shows that an uptrend is being maintained
Active buying pressure controls pullbacks
The market reacts positively to news or fresh capital inflows
More importantly, strong bulls do not need price to rise quickly . What they need is a structured advance , with healthy pauses and clear support levels to continue higher.
What Is the Bear Side?
The Bear side (bears) represents those who expect prices to fall . Like bulls, bears are not merely about selling .
The core of the bear side is the belief that the current price is higher than its true value , and that selling pressure will gradually take control .
The bear side tends to strengthen when:
An uptrend begins to weaken or breaks down
Price no longer responds positively to good news
Every rally is met with clear selling pressure
A market dominated by bears does not always collapse sharply . Sometimes, it shows up as weak rebounds , slow and extended , but unable to travel far .
When Does the Market Lean Toward Bulls or Bears?
The market is never fixed to one side . It is constantly shifting .
There are periods when bulls are in control , times when bears dominate , and moments when neither side is truly strong .
Professional traders do not try to predict which side is right . Instead, they observe:
Which side controls the main move
Which side is reacting more weakly over time
What price is respecting more: support or resistance
These price reactions reveal who is in control , not personal opinions or emotions.
Common Mistakes When Talking About Bulls and Bears
Many traders believe they must “ choose a side ” and remain loyal to it . In reality, the market does not require loyalty .
The market only demands adaptation .
Today’s bulls can become tomorrow’s bears .
A skilled trader is someone who is willing to change perspective when the data changes , rather than defending an outdated view .

How Emotions Destroy Profitable TradersHow Emotions Destroy Profitable Traders
🧠 How Emotions Destroy Profitable Traders | Trading Psychology Explained
Most traders don’t fail because of strategy.
They fail because they can’t control emotions.
Even a profitable system becomes useless when emotions take control of decision-making. Let’s break it down 👇
😨 Fear: The Profit Killer
Fear appears after losses or during volatility.
What fear causes:
Closing trades too early
Missing high-probability setups
Moving stop losses emotionally
📉 Result: Small wins, big regrets.
Fear stops traders from letting probabilities play out.
😤 Greed: The Account Destroyer
Greed appears after wins.
What greed causes:
Overleveraging
Ignoring risk management
Holding trades too long
📈 Traders want “more” and end up losing everything.
Greed turns discipline into gambling.
😡 Revenge Trading: The Fastest Way to Blow an Account
After a loss, many traders try to win it back quickly.
Revenge trading leads to:
Random entries
No confirmations
Breaking trading rules
🔥 One emotional trade often leads to many bad trades.
🤯 Overconfidence After Wins
Winning streaks create false confidence.
Overconfidence causes:
Larger position sizes
Ignoring market context
Believing losses “won’t happen”
Markets punish ego — always.
😴 Impatience: Silent Consistency Killer
Good trades require waiting.
Impatience leads to:
Forcing setups
Trading low-quality zones
Entering without confirmation
⏳ The market rewards patience, not speed.
🧘♂️ How Profitable Traders Control Emotions
Professional traders don’t eliminate emotions — they manage them.
Key habits:
Fixed risk per trade
Pre-planned entries & exits
Accepting losses as part of business
Waiting for confirmation
Trading less, not more
🧠 Discipline > Emotion
📊 Process > Outcome
📌 Final Thought
If emotions control your trades, the market will control your money.
Master your psychology, and your strategy will finally work.
Trade the plan.
Respect risk.
Stay patient.

Gold Ready to Fly Triangle Breakout BUY Setup📊 XAUUSD (Gold) Technical Analysis – BUY Bias
Timeframe: Intraday (as shown)
Market Structure: Bullish / Consolidation before continuation
---
🔍 Market Structure Breakdown
Price previously accumulated in a range, then made a strong impulsive bullish move → confirms bullish BOS (Break of Structure).
After the impulse, price entered a higher-range consolidation (smart money re-accumulation).
Current price is forming a bullish triangle / compression pattern, showing reduced volatility before expansion.
---
📌 Key Zones
Demand / Support Zone:
Lower boundary of the triangle + previous range high (acting as support).
Resistance / Liquidity Area:
Equal highs above the range → buy-side liquidity resting above.
---
📈 Price Action Insight
Multiple higher lows → buyers defending aggressively.
Wicks rejecting the downside → selling pressure is weak.
Structure suggests continuation, not reversal.
---
🎯 Trade Idea (Based on Chart)
Bias: BUY
Entry: On triangle breakout OR pullback from demand zone
Targets:
TP1: Range high
TP2: Next liquidity zone (flagged area)
Stop Loss: Below triangle support / last higher low
> This setup aligns with Smart Money accumulation → expansion model
---
🧠 Summary
Trend: Bullish
Pattern: Triangle / Re-accumulation
Liquidity: Above highs
Probability: High for upside continuation

Monero XMR price analysisIs CRYPTOCAP:XMR preparing to break its ATH?
Looking at the #XMRUSDT chart, it feels like #Monero is approaching a critical moment.
After years of consolidation, a confirmed hold above $520 could mark the start of a real harvest season 🌾
🔓 This level may become the key trigger that shifts CRYPTOCAP:XMR into a new market phase.
🎯 So what’s the real target for #Monero?
▪️ $1250?
▪️ Or even much higher — $4300?
💰 Current market cap is around $7.9B.
Do you believe CRYPTOCAP:XMR is capable of growing to:
➡️ $23B
➡️ or even $80B?
🤔 Share your thoughts — is #Monero ready to surprise the market again?
______________
◆ Follow us ❤️ for daily crypto insights & updates!
🚀 Don’t miss out on important market moves
🧠 DYOR | This is not financial advice, just thinking out loud

How to Stop Guessing and Start Trading with IntentThe Psychology Behind Trading Decisions
Estimates suggest that only about 5% of human brain activity is conscious . The remaining 95% operates at a subconscious level — outside our direct control and awareness. If this is true, then in trading, most decisions are also made unconsciously.
As Somerset Maugham once said:
“ Money is a sixth sense — without it, you cannot fully use the other five. ”
Money goes far beyond being a simple medium of exchange. It becomes an emotional and psychological factor that directly affects our sense of security, freedom, and control .
Investing and trading are among the few fields where participants work directly with money for the purpose of increasing it . And this is exactly where the trap lies — one that almost all beginners, and even experienced traders, fall into.
Why Trading Is Psychologically Different from Business
When the object of activity is not a product, not a service, and not a process, but money itself , the psyche begins to respond differently.
Consider a motherboard manufacturer. Their activity generates income only after the product is sold. There is always distance between the action and the money :
development
production
logistics
marketing
distribution
time
Profit in such a business is the result of a well-built system , not the outcome of each individual action.
In trading and investing, this distance disappears.
Money is no longer the result — it becomes the direct object of work.
Every decision is instantly reflected in the account balance
Every mistake becomes an immediate loss
Every winning trade delivers instant emotional reward
At this point, money ceases to be a neutral tool and turns into a psychological trigger .
How the Market Hijacks Decision-Making
Fear of loss intensifies.
Greed increases.
Decision-making accelerates.
Choices are no longer driven by logic, but by automatic reactions :
fear of loss
greed
the need to be right
the urge to quickly recover losses
The market constantly provokes these reactions. Without structure, a trader begins to act impulsively — even while believing that everything has been “ carefully thought through .”
The Illusion of Rationality
A sense of rational process emerges:
the chart is analyzed
arguments for entry are found
exit levels are reconsidered
Yet without pre-defined rules , these actions are not logic. They are attempts to justify a decision made under the influence of the moment.
Trading turns into a sequence of chaotic market decisions:
mental pressure builds
motivation fades
fatigue sets in
internal tension accumulates
Each new trade begins to feel like a way to “ fix ” the previous one.
In such an environment, the trader stops managing risk and starts being managed by emotions .
An illusion of control appears:
just a bit more analysis, one more argument — and the market has to respond correctly.
If this sounds familiar, you know the feeling.
Why Most Losses Actually Happen
Most losses occur not because of poor analysis, but because the plan was not fixed before entry .
When trade management is no longer handled by a strategy, it is taken over by the psyche.
And the psyche cannot work with probabilities — it can only:
avoid pain
seek pleasure
Where Logical Trading Begins
Logical trading begins where the subconscious has nothing left to decide .
All key questions are answered in advance:
What is a valid trigger and confirmation for entry?
When and how will I exit?
How do I interpret mistakes?
Under what conditions do I not trade?
How is risk managed?
At the moment of execution, the trader does not think — he executes .
And the fewer decisions that must be made while in a position, the lower the chance that those decisions will be driven by fear or hope .
The Role of a Trading Strategy
So how can this be achieved?
The answer is a trading strategy.
A trading strategy is not :
a set of indicators
a “favorite setup”
A trading strategy is a formalized logic of actions that exists before entering the market.
It answers all key questions in advance and leaves no room for improvisation at the moment when pressure is highest.
Crucially, the strategy must be documented — not only in your head, but on paper or in digital form — so the market has no chance to confuse you.
What a Solid Trading Strategy Defines
A complete strategy clearly specifies:
which method of analysis is used
under what market conditions trading makes sense
how a trade idea is formed
what time of day trading is conducted
which analytical tools are used and how they are interpreted
where the trade idea is proven wrong
specifics of trading different assets
how risk and position size are calculated
how the trade is managed after entry
how mistakes are reviewed and analyzed
A strategy is not something you “feel”
If it can be changed during the trade — it is not a strategy
Strategy vs. Losses
It is important to understand:
A strategy does not eliminate losses. It eliminates chaos.
A loss within a strategy is a planned expense , not a mistake.
A mistake is a rule violation driven by emotion .
When a strategy is clearly defined and tested, the trader’s role is reduced to execution .
At this point:
you stop “feeling the market”
you start working with probabilities
A single trade no longer matters.
What matters is the series , the statistics , the long run .
That is why professionals think not in terms of profit or loss, but in terms of process .
Final Thought
A trading strategy takes over the 95% of decisions that were previously made subconsciously.
The trader is left with only one task:
Follow the system..
Enjoy!

BTCUSDT may resume its decline after rallyDownward trend. A false breakdown of support at 85073 updated the low to 84408. From this point, the price is forming a rally towards resistance. There is no potential for continued growth. A retest of the 89370-90440 zone may end in a decline.
As the market recovers and approaches resistance, bullish volumes are declining. The market is not yet ready for growth. Yesterday's economic news was weak. I assume that this is a phase of manipulation before a decline.
Scenario: a retest of resistance at 89400-90000 may end in a halt. Bears will resist, and a false breakout could cause the market to fall to 86800-84400.

BTCUSDT the falling trendline breakout is happening now!!!As previously highlighted, the price is once again testing a major RED trendline resistance level that has catalyzed several significant corrections. This level has now faced four separate rejections, with each subsequent rejection demonstrating noticeably weaker selling pressure—a clear sign of diminishing bearish momentum.
This pattern suggests the resistance is becoming increasingly vulnerable. A decisive breakout above this level would therefore represent a key technical milestone, likely confirming a shift in market structure and signaling the potential beginning of a renewed bull phase after an extended consolidation period.
DISCLAIMER: ((trade based on your own decision))
<<press like👍 if you enjoy💚
