BCOUSD Oil has taken all the fractal lows and is looking to the upside. If dxy softens as I believe we go up a ton. The low time frame pattern is easily recognizable. HTF bullish and done falling. Time is soon for the black viscous stuff.
Contains image


XAUXAUStraight from perplexity - Potential for a Return to $4,200
Gold prices have fluctuated but repeatedly tested the $4,200 level, and the consensus among many experts is that, despite recent corrections, gold could readily revisit or sustain levels near $4,200, depending on global economic events, monetary policy (especially Fed rate decisions), inflation, and geopolitical uncertainties.

Bitcoin falling to lower levels but be careful with fresh shortsBTC changed character on the h4 with a strong expansion to the downside. RR for fresh shorts is not in your favour, but upon relief, looking for a hedge is ideal.
However, sentiment will play an important role. Upon relief using support as resistance, many will enter this short bias. This could lead to a very important short squeeze.

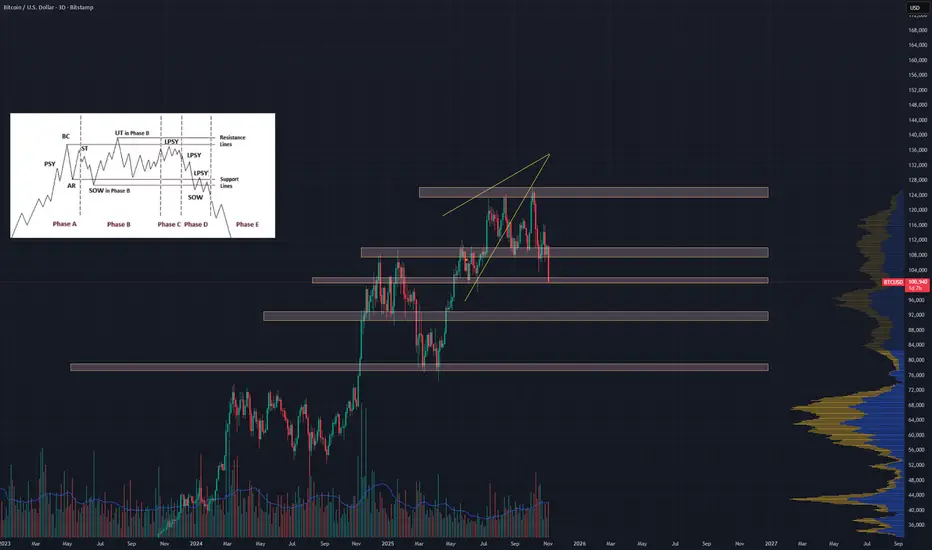
Another BTC Chart but created with PnF chartingThese drawings were made with a One Hour PnF chart for Bitcoin. Wyckoff distribution picture included for posterity.
Chart speaks for itself along with my last chart. Those Supply/Demand Zones will tell you a lot.
GOLD: Move Up Expected! Long!
My dear friends,
Today we will analyse GOLD together☺️
The price is near a wide key level
and the pair is approaching a significant decision level of 3,968.64 Therefore, a strong bullish reaction here could determine the next move up.We will watch for a confirmation candle, and then target the next key level of 3,986.66.Recommend Stop-loss is beyond the current level.
❤️Sending you lots of Love and Hugs❤️

GOLD | Daily Analysis #4 - 4 November 2025Hello and Welcome back to DP;
Review and News Coverage:
Wow — what a strong downside move! I hope you all managed to capture some profits from this fall. But is it over yet? Personally, I don’t think so. We might see another leg down, possibly tomorrow, due to the upcoming high-impact news releases.
The key events to watch are:
• NFP (Non-Farm Payrolls)
• ISM PMI
Both of these are known to bring significant volatility to the market, so stay alert and manage your risk carefully.
1H Time Frame Technical Analysis:
As shown on the chart, price broke the uptrend and fell through the 3927 area. I believe the price could continue lower, potentially reaching 3914, which aligns with a strong demand zone where buyers may step in.
That’s it for today — the rest of the details are clearly illustrated in the chart.
Summary:
Key Levels:
Support: 3914 (demand zone)
Resistance: 3927 (previous support turned resistance)
Outlook: Possible further decline before rebound (Looking For Buy)
Key Events: NFP & ISM PMI (expect high volatility)
Disclaimer:
This content is for informational purposes only and does not constitute financial or investment advice. © DIBAPRISM
Amir D.Kohn

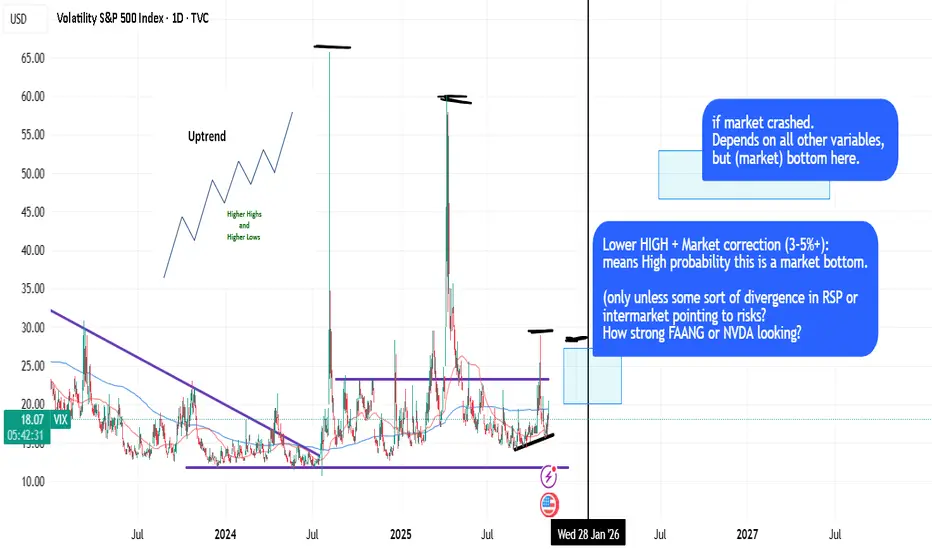
Using HLOW/LHIGH (Dow) + LOGIC to pinpoint probabilities.DOW Theory is the king of the stock market (Higher Lows, Lower Highs, uptrending, etc.) and it's quite basic concept to apply with logic.
Sometimes you can time the market (based on 50dma/200dma crosses, price extensions) and LHIGH dynamics and logic -> to pinpoint probabilities. Like, look at VIX dynamics during 2023/2024.
in short: DOW + LOGIC = PROBABILITY.
SPX | Daily Analysis #11 - 4 November 2025Hello and Welcome back to DP
Review and News Coverage:
As mentioned in the previous daily analysis, the market saw a nice decline — even breaking through the 6811 area and reaching down to 6766. There wasn’t any major news driving the move; it seems the market simply took a breather to gather strength for the next potential rally.
Now that the past move is complete, our focus shifts forward. Tomorrow brings key economic events — NFP (Non-Farm Payrolls) and PMI data — both of which are likely to bring significant volatility to the market.
1H Time Frame Technical Analysis:
At the moment, this bull run could face resistance around the 6826 area. From there, a short-term correction toward the 6800 zone is possible (6811 is no longer relevant).
Personally, I believe the recent downside move has finished, and we should now start looking for buy opportunities. If the price retraces and holds above 6800, it could open the door for long entries and a continuation of the bullish move.
Summary:
• Resistance: 6826
• Support: 6800
• Bias: Bullish (Buy on dips)
• Key Events Tomorrow: NFP & PMI — expect high volatility
Disclaimer:
This content is for informational purposes only and does not constitute financial or investment advice. © DIBAPRISM
Amir D.Kohn

The Pink Elephant in Bitcoin That Everyone IgnoresYes, my friends. The game is over, and sadly, it seems like only I have to point this out to you because no one else is talking about it. Let's jump straight into the total liquidity in crypto.
As you can see, it's broken its weekly support. Look, I don't want to say our HWC—or weekly—trend has turned bearish, but I can tell you that if the daily candle closes like this, we're heading into corrections and a whole lot of pain.
Let's circle back to Bitcoin. Starting with the monthly candle
there are 26 days left, so we can't judge it fully yet, but right now, it's looking very bearish: small upper and lower shadows with a full, powerful bearish body. Combine that with the previous four indecisive candles... it's like we've got a car where all the seats are full except the driver's, and suddenly some random seller jumps behind the wheel. Okay, it's done—let's prepare for the drop. But this doesn't mean the HWC has changed ; we're still in an uptrend, and we'd need to break higher highs and lower lows to confirm that. But damn, of course we'll short in its secondary trend... why not?
Moving to the weekly timeframe
as you can see, each wave is proving weaker than the last: the first wave had 180% growth, the second 100%, and the latest one just 50%.
Now, on the daily
it's breaking that key 105k support. Around 100k, we've got another super important support level. If we lose that, the next ones are 98k and 95k. So, open your short positions on the break of 100k—keep in mind, the volatility around there will be intense.
For longs, we've got two scenarios.
1: A reaction at 101k, faking out the 104k break with a reversal pattern, then going long on the break of its resistance (which could be around 108k). Scenario 2: Going long after forming higher highs and lows on the 4H timeframe. Personally, I prefer to hold onto my long bias because, as I mentioned before , Bitcoin's uptrend legs have gone parabolic in this phase. That means if you don't jump in on the first leg, finding a stop loss on the later ones gets tough, you end up with lower R/R, plus a lower win rate—which leads to more losing streaks, more frustration, brewing the worst coffee of your life, and banging your head against everything else :)) So... that's it. Get outta here.

What next for BTC? One more final leg to 92K awaits!
We have DEATH CROSS up ahead and every time this event occurred, a new leg started and BTC hit new ATH in a matter 6-7 months!
Now, what next after 92K? BTC likely to bounce back strong for another leg cause of loads of factors which can bring massive liquidity into the market which I would like to call it the "WINNERS CURSE" - final leg up which we could possibly top around 6-7 months from now!
Target remains 140 - 150K 🚀🚀🚀
So, I highly recommend paying yourself with these discounted prices!

KSE-100 | 1H TF | 04 NOV 2025 | BY The Chart AlchemistKSE-100 | 1H TF | 04 NOV 2025 | BY TCA
Recent Performance:
The KSE-100 index recently achieved its immediate target, confirming continued bullish strength.
Current Pullback:
The index is now in a pullback phase, expected to find key support near 160,680 points, which is vital for stability.
Secondary Support:
If it slips below this level, the next support lies at 159,370 points, though a rebound from the primary zone is more likely.
Future Outlook:
Once the pullback completes, the index is expected to resume its upward move toward 167,680 points, with potential for further highs.
Conclusion:
It’s important to remain calm during this pullback. This is a normal phase of the index’s movement, and we anticipate a continuation of the upward trend once the pullback is complete.

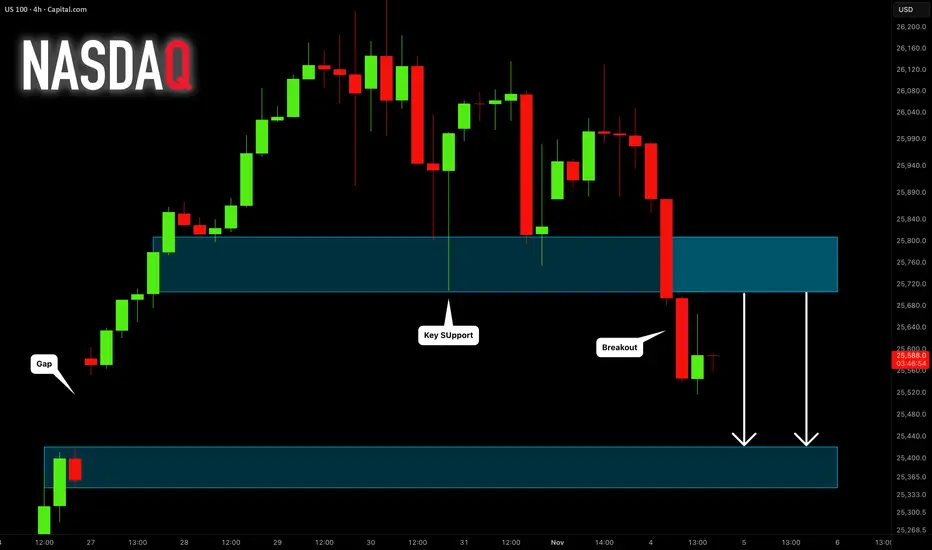
NASDAQ INDEX (US100): Forgotten Gap
A week ago, US100 formed a gap up opening.
It looks like the index is finally ready to fill it.
A breakout of a major horizontal support is a strong bearish signal.
Expect a bearish continuation to 25420.
❤️Please, support my work with like, thank you!❤️
I am part of Trade Nation's Influencer program and receive a monthly fee for using their TradingView charts in my analysis.
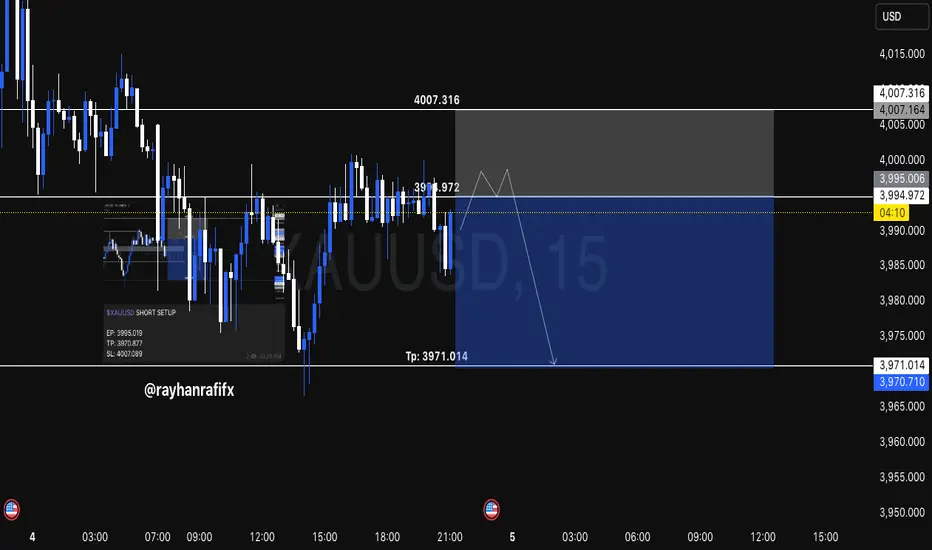
XAUUSD SHORT SETUP INTRADAY ( NOV 04, 2025 )If you have doubt on our trades you can test in demo.
OANDA:XAUUSD SHORT SETUP
EP: 3995.019
TP: 3970.877
SL: 4007.089
Trade Ideas:
Idea is clearly shown on chart + we have some secret psychologies and tools behind this.
Trade Signal:
I provide trade signals here so follow my account and you can check my previous analysis. So don't miss trade opportunity so follow must.
KSE-100 INDEX ANALYSIS | 1H TF | 04 NOV 2025 | BY TCAKSE-100 INDEX ANALYSIS | 1H TF | 04 NOV 2025 | BY THE CHART ALCHEMIST
Recent Performance:
In the past week, the KSE-100 index successfully hit its immediate target level. This marks a significant achievement in the index’s upward trajectory.
Current Pullback:
Following this achievement, the index is undergoing a pullback. We anticipate that this pullback will find support at the primary level of 160,680 points. This primary support is crucial for the index’s stability.
Secondary Support:
In the event that the index breaks below the primary support, the next level of support lies at 159,370 points. However, our primary expectation is that the index will rebound from the primary support level.
Future Outlook:
Once the pullback completes, we expect the index to resume its upward trend and move towards the next target level of 167,680 points. Should it surpass that level, the index will then aim for its final target.
Conclusion:
It’s important to remain calm during this pullback. This is a normal phase of the index’s movement, and we anticipate a continuation of the upward trend once the pullback is complete.

DASH IS A BULL MARKET FOR 5 YEARS!!!📣 Hello everyone!
The private coin sector is experiencing a rapid rise in 2024-2025. Interest in anonymous transactions is returning, and Zcash and Monero have become the growth leaders.
- Zcash has grown by 1061% since the beginning of September and has become the main driver of the private coin sector (growth from $38.62 to $448.71)
- Monero has been in a steady uptrend since February 2024, with growth of +316%
- DASH from October 1 to November 3 soared by an impressive +333%
___________________________________________
The total capitalization of the three oldest anonymous cryptocurrencies (ZEC, XMR, Dash) has exceeded $13 billion, and interest in privacy is rapidly returning!
___________________________________________
From a fundamental point of view, this growth is absolutely understandable to me - in the context of increased government control over digital assets, users are looking for ways to preserve the privacy of their financial transactions. And if XMR has privacy embedded in the code and Monero has been deleted from exchanges in many places, then ZEC and Dash can manage this option.
FUNDS, WHALES, AND LARGE INVESTOR PHYSICISTS ARE INCREASINGLY EVALUATING ALTCOINS BASED ON FUNDAMENTAL INDICATORS. THE CRYPTO MARKET IS OVERESTIMATED, WHICH MEANS THAT COINS AND TOKENS THAT STILL DO NOT HAVE A WORKING PRODUCT OR ARE FED ONLY WITH PROMISES WILL EVENTUALLY BE DEVALUED BY -99.99%. BUYBACKS TOKENS ARE ALSO FLOURISHING, SUCH AS THE #BNB DEFLATIONARY MODEL.
THIS IS THE INSTITUTIONALIZATION OF CRYPTOCURRENCIES - IN THIS CYCLE OF 2022-2025, THE FOCUS IS NOTICEABLY SHIFTING TO REAL PRODUCTS AND WORKING MODELS THAT HAVE VALUE FOR INVESTORS. (This is great news for veterans of the crypto industry who have proven their usefulness and applicability in the real world, but at the same time it is a very sad bell for meme coins and all kinds of speculative coins with only a beautiful legend)
__________________________________________
Technical information:
1. DASH confirms a unique "bullish divergence within the divergence" on the 2H frame. This means that for a very long time we have been observing a strong discrepancy between the dynamics of the price and the indicators of the indicator, and if the instrument is NOT a SCAM, then the culmination will be a potentially sharp trend reversal.
I believe that in the next 1-3 months, the DASH price may soar to $500 and test the 2021 high - an important confirmation will be the breakdown of the bullish wedge in November 2025!
2. After rising by 333% in just a month, many speculators are making profits, especially inexperienced retailers - but few people really realize that DASH is likely to start a bull market for the next 5 years after a 7-year correction!
3. Fundamentally, this is an interesting working story, I even downloaded my wallet on iOS and was pleasantly surprised.
_________________________________________
Bottom line: I think it's not worth starting to think about a bull or bear market for BTC in 2026 and wondering what will happen to DASH. For example, on October 10, when the entire alta flew to HELL, ZEC performed very well and then increased in price from the lows by more than +230%. From the point of view of TA, after the breakdown of the wedge up and rising to $ 500, there is a <10% chance of seeing the price of $ 20 again, even in a potentially bearish BTC market, from the point of view of TA, I think only with some incredible "Black Swan".
That's all for today, I wish you good luck in making independent trading decisions and making a profit. Please analyze the information you receive from me, always think only with your head!
Goodbye! ✊

$GOOG | Alphabet Google | The Everything Tech CompanyAlphabet NASDAQ:GOOG is the everything tech company. Do your future self a favor and get some. Yes, it will crater as soon as you buy it. Your short-term future self will cry and whine and throw a fit and try to panic sell. But your far future self will appreciate it.
Robots? Had backflipping robots years ago
Internet? Been scraping that for decades.
AI? We summoned the great prompter into existence.
Nvidia GPUs? Pshhh... We've got TPUs bruv
Gold teeth? Check.
Performance enhancing drugs? Check the squats broh
You winning son? Close the door dad. I'm busy buying NASDAQ:GOOG
We buyin dips. We buyin corrections. We buyin crashes.
Check the target for our first add level.

Bitcoin: The ATH Was a Trap. Here's the Real Roadmap.Since mid-July, Bitcoin has been in a global range. The "breakout" to a new ATH on Oct 5-6, which the majority expected to continue, was actually a liquidity sweep . This has confirmed the global range and a high probability of a high-timeframe correction.
After the sharp drop on the Oct 10 news, a local range has formed. I expect a breakdown from this local range, with the minimum target being a sweep of the Previous Month's Low (PML) .
After that, the plan is to look for long-term long setups at three key global support levels.
SCENARIO 1: 50% Monthly Fib Level
The first major support is the 50% Monthly Fibonacci retracement level . If price reaches this level and also performs a liquidity sweep of the June 22 low , the probability of a long setup will be much higher.
Confirmation: Price must find acceptance above this level, confirmed by Daily or Weekly candle bodies .
Target: Mitigation of the global and local ranges.
SCENARIO 2: 78.6% Monthly Fib + Weekly OB
If the 50% level is broken, the next major support is the 78.6% Monthly Fib level in conjunction with a Weekly Order Block .
Confirmation: The interaction must be analyzed with D1/W1 candles. Acceptance above this level confirms the long setup.
SCENARIO 3: The "Make-or-Break" Level
A break of the 78.6% level opens the door to the April 7 low at $74,500 . The market's reaction to this final level will determine whether the bull cycle has a chance to continue, or if a new bear cycle will begin.
~~~~~~~~~~~~~~~~~~~~~~~~~~~~~~~~~~~~~~~~~~~~~~~~~~~~~~~~~~~~~~~~~
The principles and conditions for forming the manipulation zones I show in this trade idea are detailed in my educational publication, which was chosen by TradingView for the "Editor's Picks" category and received a huge amount of positive feedback from this insightful trading community. To better understand the logic I've used here and the general principles of price movement in most markets from the perspective of institutional capital, I highly recommend checking out this guide if you haven't already. 👇
P.S. This is not a prediction of the exact price direction. It is a description of high-probability setups that become valid only if specific conditions are met when the price reaches the marked POI. If the conditions are not met, the setups are invalid. No setup has a 100% success rate, so if you decide to use this trade idea, always apply a stop-loss and proper risk management. Trade smart.
~~~~~~~~~~~~~~~~~~~~~~~~~~~~~~~~~~~~~~~~~~~~~~~~~~~~~~~~~~~~~~~~~
If you found this analysis helpful, support it with a Boost! 🚀
Have a question or your own view on this idea? Share it in the comments. 💬
► Follow me on TradingView for timely updates on THIS idea (entry, targets & live trade management) and not to miss my next detailed breakdown.
~~~~~~~~~~~~~~~~~~~~~~~~~~~~~~~~~~~~~~~~~~~~~~~~~~~~~~~~~~~~~~~~~

Internet Computer ($ICP) Set For 300% Surge Amidst Falling WedgeThe price of the notable altcoin -Internet Computer ( CRYPTOCAP:ICP ) is gearing for 300% surge after breaking out of a falling wedge pattern constituting to a 40% breakout today.
The asset has been on a falling wedge for long oscillating between the $4- $5 region. present market metrics points to a bullish continuation pattern with eyes on the $20 resistant.
As of the time of writing the asset is up 33.% with a 4 hour RSI of 80 albeit bullish, connotes a temporary pullback before the spike in price.
In another event, Internet Computer Launches Self-Writing Caffeine AI Platform.
The launch signifies a leap towards decentralized self-written applications, invigorating ICP’s market with a 4% increase, underscoring significant shifts in blockchain technology infrastructure.
About Internet Computer
The Internet Computer blockchain incorporates a radical rethink of blockchain design, powered by innovations in cryptography. It provides the first “World Computer” blockchain that can be used to build almost any online system or service, including demanding web social media, without need for traditional IT such as cloud computing services. As such it can enable full end-to-end decentralization.

The Empty Feeling After A WinA trader messaged me recently after closing a big win.
He said, “I should’ve felt great but I just felt… flat.”
That sudden emptiness after the high it’s more common than you think.
Follow along. I hope this helps.
BUT FIRST
NOTE – This is a post on mindset and emotion. It’s not a trade idea or system designed to make you money.
My intention is to help you preserve your capital, focus, and composure — so you can trade your own system with calm and confidence.
HERE’S WHAT HAPPENS
You execute beautifully.
Plan followed. Risk managed.
Trade hits target. Account up.
You should feel satisfied.
But instead… there’s a drop.
The charts look dull.
The mind goes searching.
“Maybe one more setup.”
“Just check the next pair.”
That’s not greed.
That’s chemistry.
When you’re in a trade, your brain is flooded with dopamine the chemical of pursuit, anticipation and drive.
When you exit, that hit disappears almost instantly.
To the nervous system, that chemical drop feels like loss .
And loss, even after a win, triggers the instinct to get it back.
WHAT’S REALLY GOING ON UNDERNEATH
You’re not chasing profit.
You’re chasing stimulation, the feeling of being alive in the action.
The mind interprets that feeling as boredom or missed opportunity.
But really, it’s your biology craving more.
The subconscious has learned to equate stillness with emptiness.
So it pushes for movement to escape the come-down.
That’s why so many traders give back profits after doing everything right.
They’re not making bad decisions.
They’re trying to fix a feeling.
HOW TO CATCH IT BEFORE IT CATCHES YOU
1️⃣ Notice your come-down cue.
After closing a trade, does your body feel restless?
Do you scroll, check charts, or reopen the platform out of habit?
That’s the withdrawal in motion.
2️⃣ Name it, don’t fight it.
Say it internally: “This is dopamine dropping.”
It takes the mystery out of the urge.
3️⃣ Breathe through the drop.
A long exhale through the mouth… six seconds out tells the body it’s safe.
Let your eyes rest on something still.
4️⃣ Reframe the pause.
That quiet space after a win isn’t emptiness.
It’s integration.
It’s the moment your nervous system resets for the next run.
Trading mastery isn’t just execution.
It’s emotional regulation before, during and after execution.
I put a lot of time and thought into every post that goes out here so I appreciate your support.
Thank you

CryptosCryptos.
Continuation breakdown confirmed.
Whether this was the top, or simply another correction along the way, using charts would help you stay clear of all the pain.
Charts can also let you know when it is time to get back in.

ONDOMy stop loss triggered for LSE:ONDO , so I’ve reevaluated the setup and plan to reenter around the $0.45–$0.50 region. If momentum builds from there, the structure offers a potential 210% upside move. Watching closely for confirmation before reentering.

HOW-TO: Ranger in TradingViewChart patterns and ranges are essential in technical analysis, helping traders identify potential support/resistance zones, volatility expansions, and reversal points. However, manually detecting daily or weekly ranges can be time-consuming and subjective. In this post, we describe how to effectively use the Automatic Range Detection feature inside the ZenAlgo - Ranger indicator, which calculates VWAP-based ranges and standard deviation lines automatically to save time and improve accuracy.
Using the Range Detection Feature
Add the Indicator : Access the ZenAlgo - Ranger and add it to your chart. It works on any timeframe up to 4H for optimal performance.
Key Settings :
Show Today's VWAP Range : Enabled by default. This displays the current day's range based on VWAP ±2.0 standard deviations (core range).
Show Previous Day's Range : Toggle to view historical daily ranges (up to 70 days back).
Show Monday Range : Activates weekly-like ranges derived from Monday's data (shiftable forward for projection).
Standard Deviation Lines : Customize visibility for ±3.0 to ±10.0 (and halves like ±0.5, ±1.5). Highlighted lines (e.g., ±5.0, ±10.0) use solid styles for emphasis.
Monday Range StdDev Lines : Extended up to ±40.0 for advanced volatility analysis.
Box Transparency : Adjust for visual clarity (0-100%).
Tip : Start with defaults – today's range in teal, previous in gray, Monday in yellow/blue – and tweak based on your asset's volatility.
The indicator uses a locked 1-min VWAP calculation for precision, incorporating buy/sell volume delta from 4H data to color ranges dynamically.
Range Detection Overview
ZenAlgo - Ranger detects and plots:
Daily Ranges : VWAP-centered core (±2.0 std) with extensions via std dev lines. Supports up to 50 previous days.
Monday (Weekly Projection) Ranges : Special ranges from Tuesday's data (representing Monday's VWAP), extendable up to 30 weeks. Includes core levels (25%, 50%, 75%) and extreme std devs (±40.0).
Half StdDev Lines : For finer granularity (e.g., ±2.5, ±3.5).
Volume Delta : Integrated buy/sell volume calculation for each range, helping identify bullish/bearish bias.
Return Labels : Automatically labels entries back into the range (e.g., "dS" for daily short return above RH).
Detection relies on VWAP and std dev thresholds – higher std lines indicate potential overextensions.
Examples
Here are some practical examples on BTCUSD (see chart snapshots below):
Daily Range in Action : The red box shows today's VWAP range (±2.0 std). Notice how price bounces off the midrange (MID) acting as resistance.
Previous Ranges for Context : Gray boxes overlay past days. In a trending market, price often respects these as dynamic S/R – e.g., breaking below a previous RL signals strength.
Monday Range Projection : Yellow core with blue borders. Shift forward to project weekly volatility. The 50% midline often acts as equilibrium.
StdDev Extensions : ±5.0 (solid) and ±10.0 lines for extreme targets. Useful in high-vol assets like crypto.
Tips
Validate ranges with volume delta for bias confirmation.
Use on intraday charts; combine with other indicators for entries.
For volatile markets, enable higher STDs on Monday ranges.