Gold rejected at 3990 – caution as range expands📊 Market Overview
Gold (XAU/USD) touched the $3990 resistance zone before retreating back to $3985–$3986, indicating renewed selling pressure near the supply area. The market remains range-bound, but the range is gradually widening, signaling potential volatility ahead.
🧭 Technical Analysis
• Near Resistance: $3990 – $3995
• Major Resistance: $4005 – $4012
• Near Support: $3978 – $3970
• Major Support: $3958 – $3950
• EMA50 (H1): price is hovering around this level, showing a neutral short-term bias.
• Recent candlesticks show upper wicks → sellers are dominating short-term momentum, though dip-buying interest may appear around $3960–$3955.
💡 Outlook
Gold remains in an expanding consolidation phase. The $3995 – $4005 area is a critical test zone — failure to break above could trigger a correction toward $3960.
Conversely, a confirmed H1 close above $4005 would suggest a bullish breakout and potential continuation higher.
🎯 Trading Strategy
🔻 SELL XAU/USD
Entry: $4006 – $4009
🎯 TP: 40 / 80 / 200 pips
🛑 SL: $4013
🔺 BUY XAU/USD
Entry: $3955 – $3952
🎯 TP: 40 / 80 / 200 pips
🛑 SL: $3948
Contains image

EURGBP FRGNT Daily Forecast -Q4 | W45 | D6| Y25 |📅 Q4 | W45 | D6| Y25 |
📊 EURGBP FRGNT Daily Forecast
🔍 Analysis Approach:
I’m applying Smart Money Concepts, focusing on:
Identifying Points of Interest on the Higher Time Frames (HTFs) 🕰️
Using those POIs to define a clear trading range 📐
Refining those zones on Lower Time Frames (LTFs) 🔎
Waiting for a Break of Structure (BoS) for confirmation ✅
This method allows me to stay precise, disciplined, and aligned with the market narrative, rather than chasing price.
💡 My Motto:
"Capital management, discipline, and consistency in your trading edge."
A positive risk-to-reward ratio, paired with a high win rate, is the backbone of any solid trading plan 📈🔐
⚠️ Losses?
They’re part of the mathematical game of trading 🎲
They don’t define you — they’re necessary, they happen, and we move forward 📊➡️
🙏 I appreciate you taking the time to review my Daily Forecast.
Stay sharp, stay consistent, and protect your capital
— FRNGT 🚀
FX:EURGBP

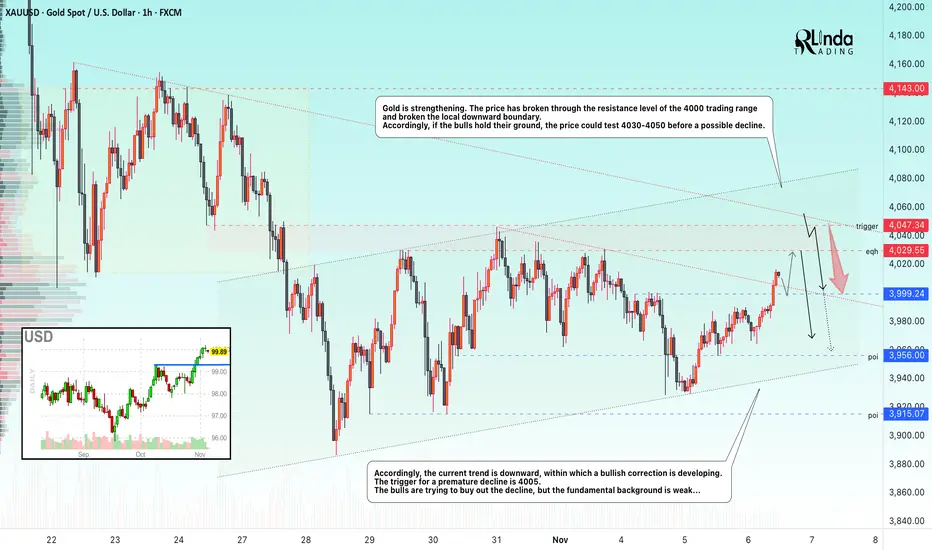
GOLD → The market is trying to buy back the decline...FX:XAUUSD continues to consolidate in the $4000 zone, failing to develop a rebound in the middle of the week. The price remains in a sideways trend for the eighth day in a row, waiting for a driver that will finally move the price forward...
Reasons for market restraint:
Strong US data: growth in ADP private employment, growth in the ISM services business activity index, lower odds of Fed easing, the probability of which has fallen to 62% for December...
However, the ongoing government shutdown and the delay in employment and inflation data are supporting the metal...
Gold is looking for new catalysts. A break above $4030-$4050 will require weak US data or an escalation of risks, which is not currently the case.
Resistance levels: 4030, 4050
Support levels: 4000, 3967, 3955
As the specified resistance is reached, the potential for further growth may be exhausted, and in this case, a false breakout could lead to a correction to 4K. However, if support does not hold the decline, this phase could last much longer. I am not yet talking about further growth beyond 4050, as the fundamental background is weak and there has been no reaction to this zone yet, since the price is still far from the level...
Best regards, R. Linda!
THE KOG REPORT - UpdateEnd of day update from us here at KOG:
Slow day on the markets today. We got the move we wanted into the hot spot above, ideally wanting to short from there but only got a small RIP. We mentioned caution as the box was broken again but we still didn't manage to break any of the bias levels.
For now, we have support below at the 3965 level and resistance here at 3985 which needs to break to go higher. Otherwise, Asian session can bring us back down but that pull back must not exceed the bias level in order to complete the swing.
Not much more to report on for tonight.
RED BOXES:
Break above 3985 for 4010, 4016 and 4030 in extension of the move
Break below 3970 for 3964, 3950 and 3940 in extension of the move
As always, trade safe.
KOG

Long towards Relative Equal HighsLong scenario for a Thursday reversal after major sellside levels have been triggered and a Breaker formed in Wednesday. Wednesday's high resides just below Tuesday's which makes the Buyside likely to get delivered.
XAGUSD_2H_Silver_BuySilver Analysis
Medium-Term Time Frame
Silver is forming a head and shoulders pattern with the most important support number being 48.00. By maintaining this support, it can continue to rise and complete the pattern towards 53.00.


BITCOIN → The hunt for liquidity before the decline BINANCE:BTCUSDT is testing the 100K area and updating its local minimum to 98,900 as part of another liquidation. The market is weak, and bulls are trying to wait out the panic...
Bitcoin looks weak. After a sharp decline, a pullback is forming, during which the price may test the break-even and interest zones — previously broken support areas. Buyers are not yet showing themselves in the market...
There is an intermediate bottom at 98,900, as well as the upper limit of the local range at 105,200. The range of 105,200 - 107,200 - 108,200 is important because it hides a pool of liquidity for a downward movement. MM may reach these zones and bring the price back into the trading range.
Resistance levels: 105,182, 107,271
Support levels: 101130, 98900
A retest of resistance at 105182 and the lack of potential for continued growth may confirm the fact of a false breakout, which in turn may provoke a fall to local targets. I do not rule out the possibility that the price may go even higher, for example, to 107270 - 108200. I do not see any point in waiting for a trend reversal yet...
Best regards, R. Linda!

AUDJPY: Short Term Bearish Movement 🇦🇺🇯🇵
AUDJPY may drop from the underlined intraday horizontal resistance.
We can expect a retracement at least to 99.9 level.
❤️Please, support my work with like, thank you!❤️
I am part of Trade Nation's Influencer program and receive a monthly fee for using their TradingView charts in my analysis.

EURGBP - GBPUSD - AUDUSD - EURUSD - DXY FULL MARKET BREAKDOWN 📅 Q4 | W45 | D6| Y25 |
📊 EURGBP - GBPUSD - AUDUSD - EURUSD - DXY FULL MARKET BREAKDOWN FRGNT Daily Forecast
🔍 Analysis Approach:
I’m applying Smart Money Concepts, focusing on:
Identifying Points of Interest on the Higher Time Frames (HTFs) 🕰️
Using those POIs to define a clear trading range 📐
Refining those zones on Lower Time Frames (LTFs) 🔎
Waiting for a Break of Structure (BoS) for confirmation ✅
This method allows me to stay precise, disciplined, and aligned with the market narrative, rather than chasing price.
💡 My Motto:
"Capital management, discipline, and consistency in your trading edge."
A positive risk-to-reward ratio, paired with a high win rate, is the backbone of any solid trading plan 📈🔐
⚠️ Losses?
They’re part of the mathematical game of trading 🎲
They don’t define you — they’re necessary, they happen, and we move forward 📊➡️
🙏 I appreciate you taking the time to review my Daily Forecast.
Stay sharp, stay consistent, and protect your capital
— FRNGT 🚀

Lingrid | ZECUSDT Short-Term Pullback After Bull TrapBINANCE:ZECUSDT is pressing into the 520–525 resistance band after a strong run within the upward channel, where liquidity above prior highs could invite a quick wick. Price action shows a steady sequence of higher highs/higher lows riding the rising trendline, but fake break setup may occur. If price holds above 498–502 after any sweep, a continuation toward 523–530 remains in play; a rejection and close back below 498 would open a rotation toward 475–460. Momentum stays bullish short-term, yet proximity to a major supply cluster argues for fade-risk before continuation.
⚠️ Risks:
Broad crypto pullback or BTC dominance spike rotating capital out of mid-caps.
Loss of the 498–500 trendline cluster, invalidating the local higher-low structure.
Negative macro headlines or hot U.S. inflation prints dampening risk appetite.
If this idea resonates with you or you have your own opinion, traders, hit the comments. I’m excited to read your thoughts!

GBPUSD FRGNT Daily Forecast -Q4 | W45 | D6| Y25 |📅 Q4 | W45 | D6| Y25 |
📊 GBPUSD FRGNT Daily Forecast
🔍 Analysis Approach:
I’m applying Smart Money Concepts, focusing on:
Identifying Points of Interest on the Higher Time Frames (HTFs) 🕰️
Using those POIs to define a clear trading range 📐
Refining those zones on Lower Time Frames (LTFs) 🔎
Waiting for a Break of Structure (BoS) for confirmation ✅
This method allows me to stay precise, disciplined, and aligned with the market narrative, rather than chasing price.
💡 My Motto:
"Capital management, discipline, and consistency in your trading edge."
A positive risk-to-reward ratio, paired with a high win rate, is the backbone of any solid trading plan 📈🔐
⚠️ Losses?
They’re part of the mathematical game of trading 🎲
They don’t define you — they’re necessary, they happen, and we move forward 📊➡️
🙏 I appreciate you taking the time to review my Daily Forecast.
Stay sharp, stay consistent, and protect your capital
— FRNGT 🚀
FX:GBPUSD

AUDUSD FRGNT Daily Forecast -Q4 | W45 | D6| Y25 |📅 Q4 | W45 | D6| Y25 |
📊 AUDUSD FRGNT Daily Forecast
🔍 Analysis Approach:
I’m applying Smart Money Concepts, focusing on:
Identifying Points of Interest on the Higher Time Frames (HTFs) 🕰️
Using those POIs to define a clear trading range 📐
Refining those zones on Lower Time Frames (LTFs) 🔎
Waiting for a Break of Structure (BoS) for confirmation ✅
This method allows me to stay precise, disciplined, and aligned with the market narrative, rather than chasing price.
💡 My Motto:
"Capital management, discipline, and consistency in your trading edge."
A positive risk-to-reward ratio, paired with a high win rate, is the backbone of any solid trading plan 📈🔐
⚠️ Losses?
They’re part of the mathematical game of trading 🎲
They don’t define you — they’re necessary, they happen, and we move forward 📊➡️
🙏 I appreciate you taking the time to review my Daily Forecast.
Stay sharp, stay consistent, and protect your capital
— FRNGT 🚀
OANDA:AUDUSD

Ascending Triangle Pattern. 9626 - BASMA ADEEM MEDICAL CO.
Closed at 5.42 (06-11-2025)
Ascending Triangle Pattern.
Sustaining 5.30 may lead it towards 6+ initially.
However, it should not break 4.80 this time.

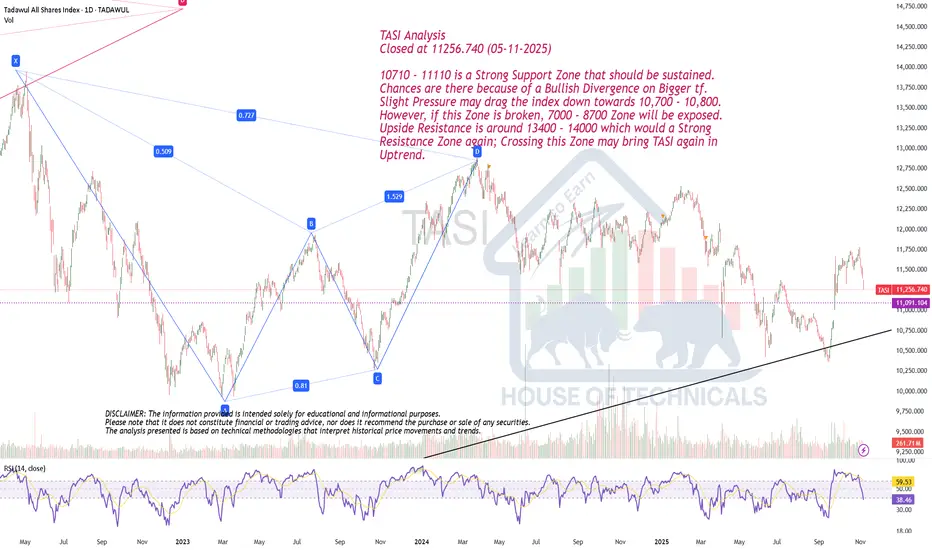
Levels!TASI Analysis
Closed at 11256.740 (05-11-2025)
10710 - 11110 is a Strong Support Zone that should be sustained.
Chances are there because of a Bullish Divergence on Bigger tf.
Slight Pressure may drag the index down towards 10,700 - 10,800.
However, if this Zone is broken, 7000 - 8700 Zone will be exposed.
Upside Resistance is around 13400 - 14000 which would a Strong
Resistance Zone again; Crossing this Zone may bring TASI again in
Uptrend.
EURUSD FRGNT Daily Forecast -Q4 | W45 | D6| Y25 |📅 Q4 | W45 | D6| Y25 |
📊 EURUSD FRGNT Daily Forecast
🔍 Analysis Approach:
I’m applying Smart Money Concepts, focusing on:
Identifying Points of Interest on the Higher Time Frames (HTFs) 🕰️
Using those POIs to define a clear trading range 📐
Refining those zones on Lower Time Frames (LTFs) 🔎
Waiting for a Break of Structure (BoS) for confirmation ✅
This method allows me to stay precise, disciplined, and aligned with the market narrative, rather than chasing price.
💡 My Motto:
"Capital management, discipline, and consistency in your trading edge."
A positive risk-to-reward ratio, paired with a high win rate, is the backbone of any solid trading plan 📈🔐
⚠️ Losses?
They’re part of the mathematical game of trading 🎲
They don’t define you — they’re necessary, they happen, and we move forward 📊➡️
🙏 I appreciate you taking the time to review my Daily Forecast.
Stay sharp, stay consistent, and protect your capital
— FRNGT 🚀
OANDA:EURUSD

DXY FRGNT Daily Forecast -Q4 | W45 | D6| Y25 |📅 Q4 | W45 | D6| Y25 |
📊 DXY FRGNT Daily Forecast
🔍 Analysis Approach:
I’m applying Smart Money Concepts, focusing on:
Identifying Points of Interest on the Higher Time Frames (HTFs) 🕰️
Using those POIs to define a clear trading range 📐
Refining those zones on Lower Time Frames (LTFs) 🔎
Waiting for a Break of Structure (BoS) for confirmation ✅
This method allows me to stay precise, disciplined, and aligned with the market narrative, rather than chasing price.
💡 My Motto:
"Capital management, discipline, and consistency in your trading edge."
A positive risk-to-reward ratio, paired with a high win rate, is the backbone of any solid trading plan 📈🔐
⚠️ Losses?
They’re part of the mathematical game of trading 🎲
They don’t define you — they’re necessary, they happen, and we move forward 📊➡️
🙏 I appreciate you taking the time to review my Daily Forecast.
Stay sharp, stay consistent, and protect your capital
— FRNGT 🚀
TVC:DXY

Gold rebounds from 3974, short-term trend turns bullish1. Market Overview:
During the European session, gold dropped sharply from 3985 to 3956 but quickly rebounded after touching the key support area around 3974. The price is now fluctuating near 3980, indicating that dip buyers have re-entered the market after the short-term correction.
2. Technical Analysis:
• Short-term trend: Neutral to slightly bullish
• Resistance levels: 3988 – 3995 / 4010 – 4025
• Support levels: 3974 – 3960 / 3945 – 3930
• The price is currently trading above the EMA20 and EMA50 on the H1 timeframe, and the bullish candle bounce confirms 3974 as a short-term support.
• If the price sustains above 3975, the upward move could extend toward 3995 – 4010.
3. Outlook:
Gold is currently sideways in accumulation mode between 3950–3990. Buyers are regaining control, but a clear breakout above 3988 is needed to confirm further upside momentum.
4. Suggested Trading Strategy:
🔺 BUY XAU/USD
Entry: 3975–3978
🎯 TP: 3990 / 4005 / 4020
🛑 SL: 3960
🟢 Strategy: Buy continuation as long as price holds above 3975
________________________________________
🔻 SELL XAU/USD (only if price fails to break 3988–3995)
Entry: 3988–3995
🎯 TP: 3970 / 3956 / 3935
🛑 SL: 4005

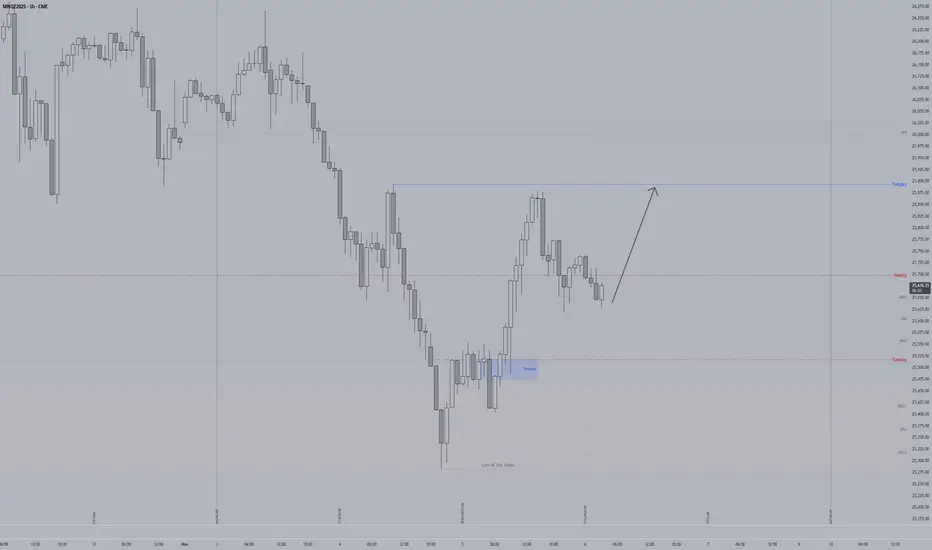
Gold. 1 more leg down. 6/Nov/25Xauusd 1 more leg down before surging..What "trigger" the surge? coming NFP?

DUOL QuantSignals V3 Earnings 2025-11-05DUOL QuantSignals V3 Earnings 2025-11-05
DUOL Earnings Signal | 2025-11-05
• Direction: BUY CALLS | Confidence: 65%
• Entry Plan: Pre Earnings Close | Expiry 2025-11-07
• Strike Focus: $207.50
• Entry Range: $56.50
• Target 1: $84.75
• Stop Loss: $28.25
• Implied Move: $58.15 (27.8%)
• 24h Move: -21.23%
• Flow Intel: Bullish (Low P/C Ratio) | PCR 0.60
• ⚠️ MODERATE RISK WARNING: Consider reducing position size due to moderate confidence level.
• Earnings Date: 2025-11-05 | Estimate: $0.78
⚖️ Compliance: Educational earnings analysis for QS Premium members only. Not financial advice.
🎯 TRADE RECOMMENDATION
Direction: BUY CALLS
Confidence: 65%
Conviction Level: MEDIUM
🧠 ANALYSIS SUMMARY
Katy AI Signal: NEUTRAL trend (50% confidence) with target at $237.17, supporting a rebound from oversold conditions after 21% selloff
Technical Analysis: RSI at 17.3 indicates severely oversold conditions, potential reversal setup. However, MACD at -8.45 and momentum at -15.46% show strong bearish pressure. Stock broke below key moving averages with light volume selloff.
News Sentiment: Mixed headlines - stock sold off despite beating Q3 estimates ($271.7M actual vs $260.3M est) and raising FY2025 guidance. Strong revenue growth of 266% year-over-year provides fundamental support.
Options Flow: Bullish positioning with Put/Call Ratio of 0.60 and unusual activity at $495 calls. Max pain at $215 suggests potential price gravitation toward strike.
Risk Level: HIGH - Earnings momentum trade with extreme volatility (IV 836%+). Position sizing critical given binary event nature.
💰 TRADE SETUP
Expiry Date: 2025-11-07 (2 days)
Recommended Strike: $207.50
Entry Price: $55.00 - $58.00 (midpoint $56.50)
Target 1: $84.75 (50% gain from entry)
Target 2: $113.00 (100% gain from entry)
Stop Loss: $28.25 (50% loss from entry)
Position Size: 2% of portfolio (reduced due to high IV and earnings
Image
QS Analyst
APP
— 5:46 PM
event risk)
⚡ COMPETITIVE EDGE
Why This Trade: Comboversold technical bounce setup with strong fundamental beat and guidance raise. The 21% pre-earnings selloff creates asymmetric risk/reward if earnings spark short covering.
Timing Advantage: Earnings already released with beat confirmed, yet stock remains oversold. Options expiry in 2 days captures immediate reaction.
Risk Mitigation: Strike selection at $207.50 provides balanced risk-reward with 0.639 delta. Position sizing limits exposure to 2% portfolio risk.
🚨 IMPORTANT NOTES
Extreme implied volatility (836%+) means rapid time decay - this is a short-term hold only
Light volume selloff suggests weak hands capitulating, but earnings reaction can be unpredictable
Consider scaling out at Target 1 to lock in gains given binary nature
Monitor pre-market activity for confirmation of bullish reversal
High risk trade suitable only for experienced options traders comfortable with potential 100% loss
📊 TRADE DETAILS 📊
🎯 Instrument: DUOL
🔀 Direction: CALL (LONG)
🎯 Strike: 207.50
💵 Entry Price: 56.50
🎯 Profit Target: 84.75
🛑 Stop Loss: 28.25
📅 Expiry: 2025-11-07
📏 Size: 2.0
📈 Confidence: 65%
⏰ Entry Timing: N/A
🕒 Signal Time: 2025-11-05 20:46:23 EST
⚠️ MODERATE RISK WARNING: Consider reducing position size due to moderate confidence level.

DASH QuantSignals V3 Earnings 2025-11-05DASH QuantSignals V3 Earnings 2025-11-05
DASH Earnings Signal | 2025-11-05
• Direction: BUY CALLS | Confidence: 70%
• Entry Plan: Pre Earnings Close | Expiry 2025-11-07
• Strike Focus: $240.00
• Entry Range: $11.25
• Target 1: $16.35
• Stop Loss: $7.40
• Implied Move: $24.10 (10.1%)
• 24h Move: -0.06%
• Flow Intel: Neutral | PCR 0.97
• ⚠️ MODERATE RISK WARNING: Consider reducing position size due to moderate confidence level.
• Earnings Date: 2025-11-05 | Estimate: $0.70
⚖️ Compliance: Educational earnings analysis for QS Premium members only. Not financial advice.
🎯 TRADE RECOMMENDATION
Direction: BUY CALLS
Confidence: 70%
Conviction Level: MEDIUM
🧠 ANALYSIS SUMMARY
Katy AI Signal: PRIMARY BIAS BUY CALLS (composite score +2.4) - Strong bullish signal based on exceptional revenue growth (3425.0%), strong beat history (75%), and consistent big beats (avg +31.5%)
Technical Analysis: RSI at 28.2 (oversold - potential reversal opportunity), but MACD -2.4507 and momentum -5.53% show bearish pressure. Current price $238.35 trading near day's midpoint with 1.1x average volume suggesting mild interest
News Sentiment: Benchmark maintains Buy rating with price target raised to $320 (bullish catalyst). Recent earnings preview articles indicate high market attention. General market rebound environment supportive
Options Flow: Neutral put/call ratio (0.97) with max volume at $262 put showing some hedging. Implied move of 10.1% ($24.10) suggests significant volatility priced in
Risk Level: MODERATE - High IV (169%) increases premium costs, but oversold RSI and strong fundamental case provide cushion
💰 TRADE SETUP
Expiry Date: 2025-11-07 (2 days)
Recommended Strike: $240.00
Entry Price: $10.90 - $11.60
Target 1: $16.35 (50% gain from entry)
Target 2: $22.50 (100% gain from entry)
Stop Loss: $7.40 (35% loss from entry)
Position Size: 3% of portfolio
⚡ COMPETITIVE ED
Image
QS Analyst
APP
— 11:08 AM
GE
Why This Trade: Combines Katy AI's strong bullish composite score (+2.4) with oversold technical conditions and positive analyst sentiment (Benchmark $320 target)
Timing Advantage: Earnings release creates volatility catalyst while oversold RSI suggests limited downside risk pre-earnings
Risk Mitigation: Balanced delta (0.506) provides good risk/reward, stop loss at 35% protects against IV crush post-earnings
🚨 IMPORTANT NOTES
High IV (169%) means time decay will be aggressive - exit before earnings release if targets not hit
Monitor for any last-minute earnings whispers that could change sentiment
Consider scaling out at Target 1 to lock in profits given short expiration timeframe
📊 TRADE DETAILS 📊
🎯 Instrument: DASH
🔀 Direction: CALL (LONG)
🎯 Strike: 240.00
💵 Entry Price: 11.25
🎯 Profit Target: 16.35
🛑 Stop Loss: 7.40
📅 Expiry: 2025-11-07
📏 Size: 3.0
📈 Confidence: 70%
⏰ Entry Timing: N/A
🕒 Signal Time: 2025-11-05 14:08:45 EST
⚠️ MODERATE RISK WARNING: Consider reducing position size due to moderate confidence level.

MSFT QuantSignals V3 Weekly 2025-11-05MSFT QuantSignals V3 Weekly 2025-11-05
MSFT Weekly Signal | 2025-11-05
• Direction: BUY PUTS | Confidence: 65%
• Expiry: 2025-11-07 (2 days)
• Strike Focus: $507.50
• Entry Range: $3.88
• Target 1: $6.08
• Stop Loss: $2.71
• Weekly Momentum: NEUTRAL (-0.56% 1W)
• Flow Intel: Bearish (High P/C Ratio) | PCR 2.54
• Max Pain: $517.50 (+2.2% vs spot)
• ⚠️ MODERATE RISK WARNING: Consider reducing position size due to moderate confidence level.
⚖️ Compliance: Educational commentary for QS Premium members only. No financial advice.
🎯 TRADE RECOMMENDATION
Direction: BUY PUTS
Confidence: 65%
Conviction Level: MEDIUM
🧠 ANALYSIS SUMMARY
Katy AI Signal: The AI shows a neutral stance with HOLD signal, but provides a bearish bias with target at $517.30 (above current $506.20) and stop loss at $498.61. However, the weekly directional guidance strongly indicates BUY PUTS with composite score of -2.5 and STRONG signal strength.
Technical Analysis: Current price at $506.20 shows -4.13% intraday decline with bearish EMA alignment. Stock is trading below session open ($524.50) and VWAP ($518.66), indicating selling pressure. Weekly momentum is neutral but multi-week trend shows -1.46% decline, confirming bearish bias.
News Sentiment: Bearish with tech sector sell-off led by Palantir affecting AI-focused stocks. OpenAI's CFO comments about break-even and government backstop needs may reduce investor enthusiasm for AI infrastructure plays like Microsoft.
Options Flow: Extremely bearish with Put/Call Ratio of 2.54 indicating heavy put buying. Unusual activity at $560 put strike shows institutional bearish positioning. Max pain at $517.50 suggests upward pressure potential is limited.
Risk Level: MEDIUM-HIGH due to short time frame (2 days to expiry) and potential for short-term reversal in tech stocks.
💰 TRADE SETUP
Expiry Date: 2025-11-07 (2 days)
Recommended Strike: $507.50
Entry Price: $3.80 - $3.95
**Tar
Image
QS Analyst
APP
— 5:43 PM
get 1: $6.08 (60% gain from entry)
Target 2: $8.54 (120% gain from entry)
Stop Loss: $2.71 (30% loss from entry)
Position Size: 3% of portfolio (cautious allocation due to short expiry)
⚡ COMPETITIVE EDGE
Why This Trade: Combines Katy AI's technical bearish bias with overwhelming options flow confirmation and sector weakness catalysts
Timing Advantage: Mid-week positioning with only 2 days to expiry maximizes time decay benefits for put positions
Risk Mitigation**: Conservative strike selection with -0.555 delta provides balanced risk-reward for weekly expiration
🚨 IMPORTANT NOTES
Only 2 days until expiration - time decay will accelerate rapidly
VIX rising to 18.01 may increase option premiums but also volatility
Tech sector sell-off could reverse quickly on positive news
Position size should be conservative due to binary event risk
📊 TRADE DETAILS 📊
🎯 Instrument: MSFT
🔀 Direction: PUT (SHORT)
🎯 Strike: 507.50
💵 Entry Price: 3.88
🎯 Profit Target: 6.08
🛑 Stop Loss: 2.71
📅 Expiry: 2025-11-07
📏 Size: 3.0
📈 Confidence: 65%
⏰ Entry Timing: N/A
🕒 Signal Time: 2025-11-05 20:43:48 EST
⚠️ MODERATE RISK WARNING: Consider reducing position size due to moderate confidence level.

INTC QuantSignals V3 Weekly 2025-11-05INTC QuantSignals V3 Weekly 2025-11-05
INTC Weekly Signal | 2025-11-05
• Direction: BUY CALLS | Confidence: 60%
• Expiry: 2025-11-07 (2 days)
• Strike Focus: $38.50
• Entry Range: $0.70
• Target 1: $1.15
• Stop Loss: $0.40
• Weekly Momentum: NEUTRAL (+0.63% 1W)
• Flow Intel: Neutral
• ⚠️ MODERATE RISK WARNING: Consider reducing position size due to moderate confidence level.
⚖️ Compliance: Educational commentary for QS Premium members only. No financial advice.
🎯 TRADE RECOMMENDATION
Direction: BUY CALLS
Confidence: 60%
Conviction Level: LOW
🧠 ANALYSIS SUMMARY
Katy AI Signal: Neutral (50% confidence) with $38.59 target (+0.8% from current), suggesting mild bullish bias with HOLD recommendation
Technical Analysis: Weekly momentum neutral but multi-week trend bullish (+3.99% over 2 weeks). EMA alignment confirms bullish uptrend. Current price at 49.4% weekly range suggests room for movement in either direction.
News Sentiment: Mixed - AI chip sector faces headwinds from China's foreign chip ban (bearish catalyst), but TSMC's North America expansion could benefit INTC long-term. Overall sector sentiment cautious after $500B AI stock wipeout.
Options Flow: Neutral positioning with no unusual activity detected. Low gamma risk provides cleaner price action. Put/Call ratio unavailable for directional bias confirmation.
Risk Level: HIGH - Low conviction due to Katy's neutral signal, mixed news catalysts, and only 2 days to expiry. Trade primarily based on weekly momentum continuation.
💰 TRADE SETUP
Expiry Date: 2025-11-07 (2 days)
Recommended Strike: $38.50
Entry Price: $0.68 - $0.71
Target 1: $1.15 (70% gain from entry)
Target 2: $1.45 (105% gain from entry)
Stop Loss: $0.40 (40% loss from entry)
Position Size: 2% of portfolio (reduced due to low conviction)
⚡ COMPETITIVE EDGE
Why This Trade: Captures weekly momentum continuation with balanced delta (0.
Image
QS Analyst
APP
— 4:06 PM
468) offering optimal risk/reward for short-duration play
Timing Advantage: Mid-week positioning allows capture of any Thursday/Friday institutional flows before expiry
Risk Mitigation: Tight stop loss protects against rapid time decay, strike selection provides moderate intrinsic value buffer
🚨 IMPORTANT NOTES
Extremely short duration - Only 2 days to expiry creates high time decay risk
Katy AI shows weak signal - Primary engine indicates neutral bias with only 50% confidence
Sector headwinds present - AI chip sector volatility could override technical bullish signals
Target reduced expectations - Conservative profit targets reflect low conviction environment
Exit by Thursday EOD recommended to avoid Friday gamma compression risks
📊 TRADE DETAILS 📊
🎯 Instrument: INTC
🔀 Direction: CALL (LONG)
🎯 Strike: 38.50
💵 Entry Price: 0.70
🎯 Profit Target: 1.15
🛑 Stop Loss: 0.40
📅 Expiry: 2025-11-07
📏 Size: 2.0
📈 Confidence: 60%
⏰ Entry Timing: N/A
🕒 Signal Time: 2025-11-05 19:06:41 EST
⚠️ MODERATE RISK WARNING: Consider reducing position size due to moderate confidence level.
