EURUSD - BEARISH SCENARIOHello traders,
The EURUSD price has reached the resistance zone (1.15363 – 1.15436) and formed a double top pattern — a potential bearish reversal signal.
🔻 Bearish Scenario:
If the market breaks the neckline and closes below it, we can expect a downside movement.
🎯 TARGET: 1.14815
Contains image

WLDI’m expecting EURONEXT:WLD to break out within the next 80 days, offering a potential 500% profit from current levels. It’s trading near its open price, which makes the risk-to-reward setup even more attractive. This is a strong accumulation zone for early entries.

Nifty Analysis EOD – November 4, 2025 – Tuesday🟢 Nifty Analysis EOD – November 4, 2025 – Tuesday 🔴
A textbook triple-distribution day where bears dominated the expiry setup.
🗞 Nifty Summary
Nifty started flat to negative and instantly marked the day high at 25,787.40 in the very first minute. A sharp 82-point drop followed, taking the index to the crucial 25,706 zone. From there, Nifty got trapped within a narrow 35-point range (25,720–25,685) before slipping into another similar micro-range (25,685–25,650).
The entire day was a grind dominated by bears while bulls fought to defend supports — often leading to both-side fakeouts that punished intraday traders, particularly option buyers during weekly expiry volatility.
Around 2 PM, a breakdown from the second range breached both the PDL and the 25,635–25,615 support zone with strong momentum and volatility. The index eventually closed at 25,597.65, right at support and near the day’s low — confirming a triple-distribution day structure and a decisive bearish tone.
The engulfing move of yesterday’s bullish candle indicates that bears still have control, and short-term retracement toward 25,400 remains likely.
🛡 5 Min Intraday Chart with Levels
📉 Daily Time Frame Chart with Intraday Levels
🕯 Daily Candle Breakdown
Open: 25,744.75
High: 25,787.40
Low: 25,578.40
Close: 25,597.65
Change: −165.70 (−0.64%)
🏗️ Structure Breakdown
Type: Large bearish candle with a long body and small upper wick.
Range (High–Low): 209 points → high volatility session.
Body: ≈ 147 points → strong bearish control throughout.
Upper Wick: ≈ 42.65 points → rejection from 25,780 resistance.
Lower Wick: ≈ 19.25 points → weak late-session buying attempt.
📚 Interpretation
Nifty opened weak and failed to sustain above 25,780, triggering heavy selling below 25,650. This breakdown invalidated short-term bullish attempts, with bears pressing the index below major supports.
Despite minor pullbacks, the structure clearly confirms downtrend continuation with momentum building toward 25,400.
🕯Candle Type
A strong bearish continuation candle, confirming that yesterday’s spinning-top pattern was merely a pause before another leg lower.
🛡 5 Min Intraday Chart
⚔️ Gladiator Strategy Update
ATR: 202.64
IB Range: 102.30 → Medium
Market Structure: Balanced
Trade Highlights:
10:17 – Short Trade → SL Hit
11:25 – Long Trade → Trailing SL Hit
14:10 – Short Trade → Trailing SL Hit
📌 What’s Next? / Bias Direction
Trend : Bearish Continuation
If this momentum persists, short-term retracement toward 25,400 seems likely. Immediate supports lie at 25,550 and 25,460–25,440 zones.
📌 Support & Resistance Levels
Resistance Zones:
25,715
25,790
25,865 ~ 25,880
Support Zones:
25,585
25,550
25,510
25,460 ~ 25,440
💡 Final Thoughts
A clean triple-distribution expiry session often defines trend continuation phases rather than reversals. As long as Nifty remains below 25,700, sellers will dominate. A break below 25,550 could extend the fall to 25,400 — while any sustained move above 25,715 may only bring temporary relief.
“The market rewards patience when chaos tests conviction.”
✏️ Disclaimer
This is just my personal viewpoint. Always consult your financial advisor before taking any action.

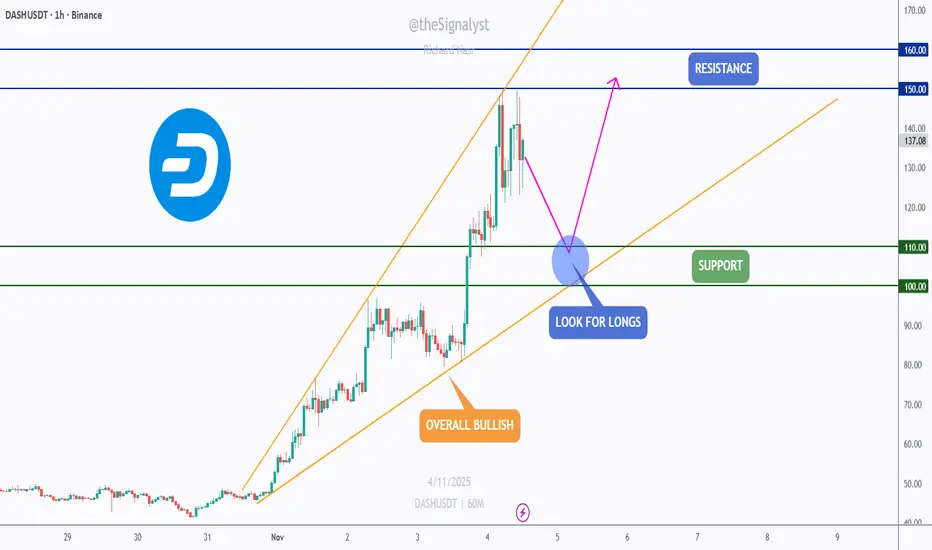
DASH - Top Performer Setting Up for the Next Leg!🏹DASH has been one of the top-performing altcoins this month, showing strong momentum and clear leadership among mid-cap assets.
💣After an explosive rally, price is now pulling back within a well-structured rising wedge, a healthy correction within an overall bullish trend.
As DASH approaches the intersection of support and the lower bound of the wedge, this confluence zone will be key to watch.
I’ll be looking for trend-following long opportunities from that area, targeting a continuation toward the $150–$160 resistance zone.
⚔️As long as the $100 support holds, the bulls remain firmly in control, and this dip could be the perfect opportunity to join the next wave up.
⚠️ Disclaimer: This is not financial advice. Always do your own research and manage risk properly.
📊All Strategies Are Good; If Managed Properly!
~Richard Nasr
BITCOIN (BTCUSD): Pullback From Key Support
Bitcoin is currently trading within a wide horizontal range on a daily.
We see a test of its support now.
There is a high chance that the price will bounce from that, following
a formation of a confirmed bullish imbalance candle.
Goal - 105170
❤️Please, support my work with like, thank you!❤️
I am part of Trade Nation's Influencer program and receive a monthly fee for using their TradingView charts in my analysis.

$BYND - The Next GMELet's look at the thesis behind this idea :-
1) Massive Short interest.
2) Falling Wedge Pattern.
3) Diamond Hands are back again and This time they are supporting BYND.
4) Untapped Liquidity Resting above and possibility of liquidating Shorts would also be appealing to Market makers to supply Liquidity to HIGHER Bidders for building new Short positions.
From my speculation, this is highly risky play. But how to play it?
No need to go full APE.
Risk Assessment can be used. Assess your risk. Use a Stop loss. Accept your Risk. Always use a Stop loss with risk in mind of what you can afford to lose.
This is not a Financial Advice. Your gains and losses are your responsibility. I wish you good luck.
This idea is for educational purposes only. DYOR.
If you like this idea then Follow me please.

AUD-CHF Bullish Bias! Buy!
Hello,Traders!
AUDCHF is reacting from the horizontal demand area, showing signs of bullish intent. If the level holds, we could see a continuation toward 0.5280$. Time Frame 3H.
Buy!
Comment and subscribe to help us grow!
Check out other forecasts below too!
Disclosure: I am part of Trade Nation's Influencer program and receive a monthly fee for using their TradingView charts in my analysis.

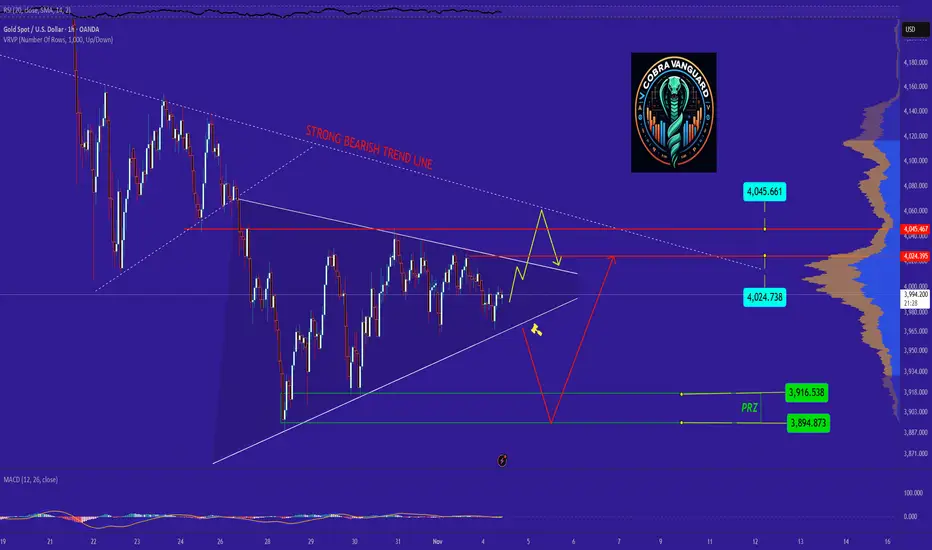
GOLD at the Brink Breakdown or Breakout?GOLD at the BrinkBreakdown or Breakout? —if the triangle breaks downward, it could fall toward the bearish PRZ zone. But if new positive news or rising Middle East tensions emerge, there's hope for a bullish move. For now, the news remains neutral.
What do you think—will GOLD fall or rise?
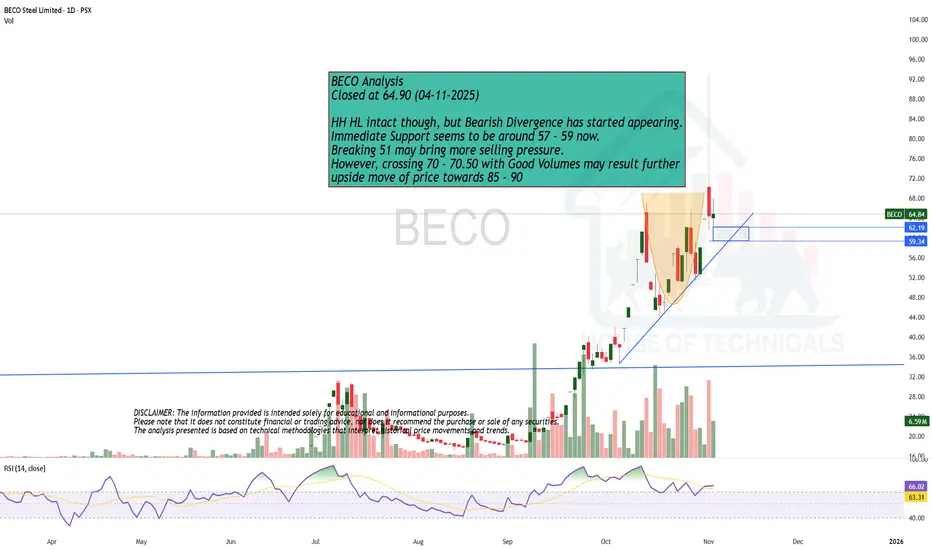
HH HL intact though, but ..BECO Analysis
Closed at 64.90 (04-11-2025)
HH HL intact though, but Bearish Divergence has started appearing.
Immediate Support seems to be around 57 - 59 now.
Breaking 51 may bring more selling pressure.
However, crossing 70 - 70.50 with Good Volumes may result further
upside move of price towards 85 - 90
EUR-AUD Local Short! Sell!
Hello,Traders!
EURAUD is reacting from the horizontal supply area after a corrective pullback. Liquidity has been engineered above equal highs, signaling potential bearish continuation to 1.7680$. Time Frame 5H.
Sell!
Comment and subscribe to help us grow!
Check out other forecasts below too!
Disclosure: I am part of Trade Nation's Influencer program and receive a monthly fee for using their TradingView charts in my analysis.

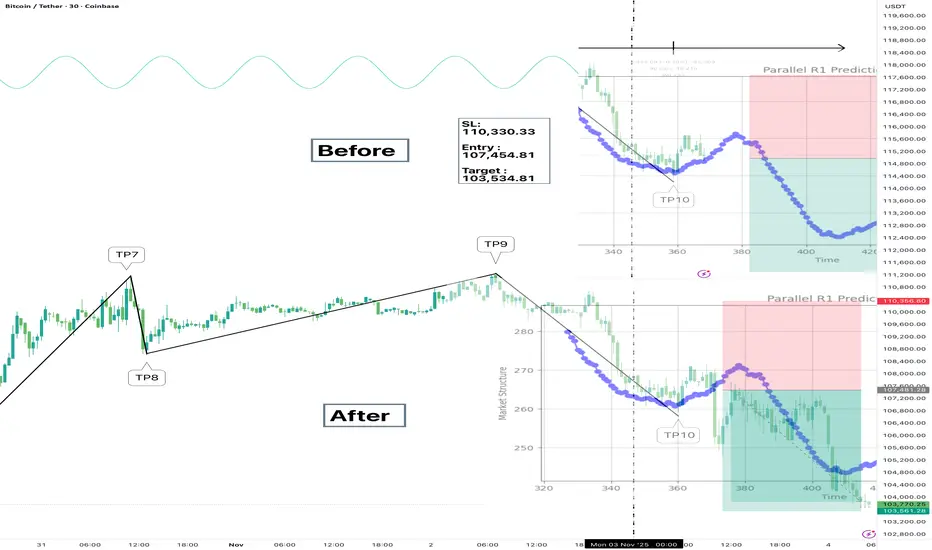
Another one for the books. AI driven Signals WINHumble brag: my MTOPS model signaled
entry at 107,454,
SL at 110,330, and
TP at 103,534 — exactly where BTC just hit.
Before: clean setup, textbook structure.
After: price respected every level like it was reading my mind.
Not luck. Just price action doing what it does when you listen.
Grateful for the wins. More to come.
How to Build Consistency in Volatile MarketsVolatile markets test every trader. Prices move fast, spreads widen, and emotion replaces logic. Consistency comes from structure, not prediction. The traders who last stay calm, trade small, and focus on execution. Their process stays the same, no matter how the market moves.
Control Your Risk
When volatility rises, reduce position size. Risk less per trade to protect your capital.
A trader risking 2% per position during calm markets should drop to 1% or lower when volatility spikes.
The goal is survival. Without capital, you cannot stay consistent long enough to let probabilities play out.
Trade Rules, Not Feelings
Rules keep you consistent when emotions take over.
Define entries, exits, and invalidation levels before each session.
Follow them without hesitation.
Avoid impulsive trades driven by fear or excitement. Each disciplined decision builds long-term consistency.
Limit Screen Time
More screen time rarely means better trading.
Constant watching increases stress and leads to reaction-based trades.
Set trading hours. Step away when the market does not match your plan.
Patience is a trading skill. Consistency grows in quiet moments, not in constant activity.
Use Volatility as Data
Volatility is not a signal. It is a condition.
Use tools like ATR to measure it and adjust your position size.
Wait for clean setups after large moves.
Avoid chasing price. Volatile moves without confirmation create poor entries and fast losses.
Track Behavior, Not P&L
You cannot control outcomes, only execution.
Journal each trade. Note whether you followed your plan.
Measure discipline instead of profit.
When you improve your process, the results follow.
Build a Stable Routine
Consistency begins before the first trade.
Start each session by:
• Reviewing key levels.
• Setting daily loss limits.
• Writing down invalidation points.
When preparation becomes habit, decision-making becomes objective.
Final Thoughts
Consistency is built from repetition, not prediction.
Volatile markets punish reaction and reward structure.
Trade your plan. Manage your size. Stay patient.
Each disciplined session adds to your edge. Over time, stability wins.

USOIL BULLS ARE STRONG HERE|LONG
USOIL SIGNAL
Trade Direction: long
Entry Level: 60.06
Target Level: 60.65
Stop Loss: 59.67
RISK PROFILE
Risk level: medium
Suggested risk: 1%
Timeframe: 2h
Disclosure: I am part of Trade Nation's Influencer program and receive a monthly fee for using their TradingView charts in my analysis.
✅LIKE AND COMMENT MY IDEAS✅

Big Moves Ahead? DXY, EUR/USD & Gold at Crucial LevelsLadies and gentlemen, there was a time when forex was full of trading opportunities... to the point where most people struggled with overtrading. But these days, you need a solid watchlist to even find positions, and that's where Skeptic Lab comes in—it's a great spot for spotting good opportunities. So without further ado, let's dive into the analysis of DXY , or the dollar index.
💲 In the daily timeframe , after the drop it had, it's entered a consolidation box, and it looks like we're nearing the end of that box. The main long trigger is a break of 100.262 from a technical standpoint, but personally, after the break of 99.850, I'm already positioned on one of the USD symbols. In lower timeframes, plus the fact that breaking the ceiling of consolidations is usually not straightforward and comes with a lot of volatility, so it's better to have a pre-breakout position.
💶Let's head over to EURX in the 4H timeframe —we've had a good reaction at the 1085.9 support. Breaking it would be a great trigger if you want a EURUSD position.
Speaking of EURUSD , it's already entered a secondary bearish trend after breaking its daily trend line. If the DXY consolidation box breaks, EURUSD will officially change its HWC trend to bearish. The position I mentioned at the start of the analysis—I opened it with the break of that same daily EURUSD trend line. The key level for profit-taking will be 1.14640. I'll wait to see what reaction DXY gives—if it fakes the box break, I'll close the position; if not, I'll leave it open for now.
🪙But let's move on to gold —the commodity I'm eyeing today for opening a position. From a technical perspective, it's at a spot that gives both short and long triggers... let me explain.
In the daily timeframe, we had a strong uptrend rally that, after reaching 4377.67 , entered its secondary corrective trend. In the 4H timeframe, what's interesting is the formation of these range boxes we're seeing. So our long and short triggers are clear: break of the box ceiling = long / break of the box floor = short.
But the thing is, the targets are the same... see, opening a short here basically means going along with the secondary trend, so? Your expectations should be relative to this leg, not the weekly one... so it's better to take your targets quicker, like 3896.31 (the 0.38 fib intersection), which could be a good target. Plus, each bearish leg is weaker than the previous one, so the point I mentioned makes sense for the target.
For longs, though, you can proceed with partial profits and not close too early. Alright, that's it. Now get outta here.

EUR/NZD SHORT FROM RESISTANCE
EUR/NZD SIGNAL
Trade Direction: short
Entry Level: 2.031
Target Level: 1.999
Stop Loss: 2.053
RISK PROFILE
Risk level: medium
Suggested risk: 1%
Timeframe: 1D
Disclosure: I am part of Trade Nation's Influencer program and receive a monthly fee for using their TradingView charts in my analysis.
✅LIKE AND COMMENT MY IDEAS✅

EUR/AUD BEARS WILL DOMINATE THE MARKET|SHORT
Hello, Friends!
We are targeting the 1.752 level area with our short trade on EUR/AUD which is based on the fact that the pair is overbought on the BB band scale and is also approaching a resistance line above thus going us a good entry option.
Disclosure: I am part of Trade Nation's Influencer program and receive a monthly fee for using their TradingView charts in my analysis.
✅LIKE AND COMMENT MY IDEAS✅

EUR/CAD SENDS CLEAR BULLISH SIGNALS|LONG
Hello, Friends!
We are now examining the EUR/CAD pair and we can see that the pair is going down locally while also being in a downtrend on the 1W TF. But there is also a powerful signal from the BB lower band being nearby indicating that the pair is oversold so we can go long from the support line below and a target at 1.637 level.
Disclosure: I am part of Trade Nation's Influencer program and receive a monthly fee for using their TradingView charts in my analysis.
✅LIKE AND COMMENT MY IDEAS✅

EURUSD: Important Breakout 🇪🇺🇺🇸
EURUSD broke and closed below a significant daily horizontal support.
The pair has a potential to drop way lower now.
We can expect a down movement to 1.1465 support.
❤️Please, support my work with like, thank you!❤️
I am part of Trade Nation's Influencer program and receive a monthly fee for using their TradingView charts in my analysis.

Bitcoin at the Brink: Breakdown or Breakout?Bitcoin is on the edge of a cliff . If this channel breaks downward, Bitcoin could fall below $100,000. But if the price respects this PRZ (Potential Reversal Zone), we can expect a solid rally toward $111,000, then $117,000, and eventually $125,000.
What do you think—will Bitcoin fall or rise?

USDT Dominance - Wyckoff AccumulationCRYPTOCAP:USDT.D could be mirroring Tesla’s 2022–2024 Wyckoff structure. From 2022 to late 2024, NASDAQ:TSLA formed a clear Wyckoff Accumulation on the weekly chart: a Selling Climax set the range, an Automatic Rally confirmed resistance, and a brief Spring in early 2023 shook out bears before prices recovered on strong volume. The stock then established a Last Point of Support, followed by a Sign of Strength breakout in late 2024, signaling institutional accumulation and the start of a new uptrend.

USDCAD Technical Analysis! SELL!
My dear subscribers,
My technical analysis for USDCAD is below:
The price is coiling around a solid key level - 1.4067
Bias - Bearish
Technical Indicators: Pivot Points Low anticipates a potential price reversal.
Super trend shows a clear sell, giving a perfect indicators' convergence.
Goal - 1.4013
About Used Indicators:
By the very nature of the supertrend indicator, it offers firm support and resistance levels for traders to enter and exit trades. Additionally, it also provides signals for setting stop losses
Disclosure: I am part of Trade Nation's Influencer program and receive a monthly fee for using their TradingView charts in my analysis.
———————————
WISH YOU ALL LUCK

Hellena | EUR/USD (4H): LONG to the resistanse area 1.16296.Colleagues, the rather complicated correction suggests that the upward movement is gradually slowing down and I think that we will see a rather confident move towards the 1.16296 area.
The difficulty is that on higher timeframes we are dealing with a ending diagonal, and these are quite complicated figures to analyze.
Nevertheless, I think that there is a probability of reaching the support area of 1.14647 before the upward movement.
Fundamental context
The U.S. dollar is under pressure: weak economic data and expectations of monetary easing are reducing its appeal as a safe-haven asset. The euro is receiving moderate support amid relative stability in the eurozone economy and investor interest in non-dollar assets. These conditions set the stage for a resumption of the EUR/USD pair’s upward move.
Manage your capital correctly and competently! Only enter trades based on reliable patterns!

Gold may reverse up if support ~3,950–3,970 USD/oz holds📊 Market Overview:
Gold is trading around ~3,980 USD/oz in the Asian session after declining from ~4,020 and dipping near ~3,975. On the H4 timeframe the selling pressure remains as no strong bottom has yet been confirmed around the support zone. Meanwhile, economic data and USD/crude oil swings continue to exert pressure.
📉 Technical Analysis:
• Key support: ~3,950–3,970 USD/oz (previous bounce zone).
• Immediate resistance: ~4,020–4,040 USD/oz.
• The EMA 50 is around ~3,990-4,000, acting as interim resistance.
• If price closes H4 below ~3,950 → likely target ~3,900. If it holds above ~3,970 and rallies, target ~4,040.
• Recent H4 candles show a potential hammer/pin-bar at the support zone, but we need confirmation via a strong H4 close.
📌 Outlook:
The medium-term bias remains neutral to slightly bearish until support ~3,950-3,970 holds and price closes above ~4,000 on H4. If the support breaks, deeper declines are probable. If support holds and we see volume/momentum pick up in EU/US session, a recovery may kick in.
💡 Suggested Strategy:
🔺 BUY XAU/USD
Entry: 3,972 – 3,969
🎯 TP: 40 / 80 / 200 PIPS
❌ SL: 3,966
🔻 SELL XAU/USD
Entry: 4019 – 4022
🎯 TP: 40 / 80 / 200 PIPS
❌ SL: 4025
