SILVER: The Market Is Looking Down! Short!
My dear friends,
Today we will analyse SILVER together☺️
The in-trend continuation seems likely as the current long-term trend appears to be strong, and price is holding below a key level of 48.497 So a bearish continuation seems plausible, targeting the next low. We should enter on confirmation, and place a stop-loss beyond the recent swing level.
❤️Sending you lots of Love and Hugs❤️
Contains image

SL+PL EURfresh support line for EU, right in the middle of Psychological line zone of significant 1.6. DXY is on a general Bullish Bias, reversal might be possible to drop and fill the gap in price that occurred during first half of ASIA

BYND gap filled!BYND has successfully filled the gap to $1.54 as anticipated. It might try to fill the gap at $0.67, but a breakout from the descending wedge would invalidate that. We are now observing how the price reacts; so far, the action remains calm.

EURUSD: Strong Bearish Sentiment! Short!
My dear friends,
Today we will analyse EURUSD together☺️
The market is at an inflection zone and price has now reached an area around 1.15208 where previous reversals or breakouts have occurred.And a price reaction that we are seeing on multiple timeframes here could signal the next move down so we can enter on confirmation, and target the next key level of 1.15121.Stop-loss is recommended beyond the inflection zone.
❤️Sending you lots of Love and Hugs❤️

GOLD: Bulls Are Winning! Long!
My dear friends,
Today we will analyse GOLD together☺️
The price is near a wide key level
and the pair is approaching a significant decision level of 3,986.93 Therefore, a strong bullish reaction here could determine the next move up.We will watch for a confirmation candle, and then target the next key level of 4,003.02.Recommend Stop-loss is beyond the current level.
❤️Sending you lots of Love and Hugs❤️

TAOGETTEX:TAO is positioned for a potential 115% gain within the next 93 days. The AI sector is showing renewed momentum, and GETTEX:TAO ’s strong fundamentals, liquidity profile, and positioning within the narrative suggest it could lead the next leg of sector expansion.

GOLD 1H CHART ROUTE MAP UPDATE & TRADING PLAN FOR THE WEEKHey Everyone,
Please see our updated 1h chart levels and targets for the coming week.
We are seeing price play between two weighted levels with a gap above at 4134 and a gap below at 4090. We will need to see ema5 cross and lock on either weighted level to determine the next range.
We will see levels tested side by side until one of the weighted levels break and lock to confirm direction for the next range.
We will keep the above in mind when taking buys from dips. Our updated levels and weighted levels will allow us to track the movement down and then catch bounces up.
We will continue to buy dips using our support levels taking 20 to 40 pips. As stated before each of our level structures give 20 to 40 pip bounces, which is enough for a nice entry and exit. If you back test the levels we shared every week for the past 24 months, you can see how effectively they were used to trade with or against short/mid term swings and trends.
The swing range give bigger bounces then our weighted levels that's the difference between weighted levels and swing ranges.
BULLISH TARGET
4134
EMA5 CROSS AND LOCK ABOVE 4134 WILL OPEN THE FOLLOWING BULLISH TARGETS
4174
EMA5 CROSS AND LOCK ABOVE 4174 WILL OPEN THE FOLLOWING BULLISH TARGET
4236
EMA5 CROSS AND LOCK ABOVE 4236 WILL OPEN THE FOLLOWING BULLISH TARGET
4288
EMA5 CROSS AND LOCK ABOVE 4288 WILL OPEN THE FOLLOWING BULLISH TARGET
4331
EMA5 CROSS AND LOCK ABOVE 4331 WILL OPEN THE FOLLOWING BULLISH TARGET
4360
BEARISH TARGETS
4090
EMA5 CROSS AND LOCK BELOW 4090 WILL OPEN THE FOLLOWING BEARISH TARGET
4042
EMA5 CROSS AND LOCK BELOW 4042 WILL OPEN THE SWING RANGE
4122
4075
EMA5 CROSS AND LOCK BELOW 4075 WILL OPEN THE SECONDAARY SWING RANGE
3987
3939
As always, we will keep you all updated with regular updates throughout the week and how we manage the active ideas and setups. Thank you all for your likes, comments and follows, we really appreciate it!
Mr Gold
GoldViewFX

AUDNZD FREE SIGNAL|SHORT|
✅AUDNZD is reacting from a clear supply level, showing early rejection wicks and loss of momentum. A short-term bearish leg is expected toward the nearest imbalance before potential continuation.
—————————
Entry: 1.1433
Stop Loss: 1.1445
Take Profit: 1.1410
Time Frame: 3H
—————————
SHORT🔥
✅Like and subscribe to never miss a new idea!✅

GBP-CAD Free Signal! Sell!
Hello,Traders!
GBPCAD formed a double-top around a horizontal supply area, showing clear distribution signs. Expecting continuation lower as liquidity under recent equal lows becomes the next draw.
-------------------
Stop Loss: 1.8436
Take Profit: 1.8325
Entry: 1.8392
Time Frame: 5H
-------------------
Sell!
Comment and subscribe to help us grow!
Check out other forecasts below too!
Disclosure: I am part of Trade Nation's Influencer program and receive a monthly fee for using their TradingView charts in my analysis.

Nifty Analysis EOD – October 31, 2025 – Friday🟢 Nifty Analysis EOD – October 31, 2025 – Friday 🔴
Bulls Trapped Early — Bears Closed the Week with Authority!
🗞 Nifty Summary
Nifty opened flat to mildly negative, but the sentiment quickly turned bearish as the index slipped 63 points within the first minute, breaking below the Previous Day’s Low (PDL). Just as the tone seemed set for a full bearish day, a sudden aggressive recovery spike flipped the momentum — Nifty rallied 131 points from the day’s low, crossing CDO, CDH, and even the CPR zone.
However, the 25950 resistance zone halted this unexpected surge. The CPR tried to hold as support but eventually failed, leading to a sharp fall below PDL, CDL, and S1. The index finally found a pause around the 25790 support, staying range-bound between 25830 ~ 25760 for most of the session.
In the final minutes (around 2:50 PM), Nifty broke the
consolidation and tested the key 25715 ~ 25725 support zone, closing the day at 25731.90, almost at the day’s low.
The first 20 minutes trapped the bulls, and the bears rode comfortably through the rest of the session. Today’s close erased the past 9 trading days of gains, also finishing below last week’s low, signaling clear selling pressure between 25800 ~ 26,000.
Heading into Monday, sustaining below 25725 ~ 25715 could open the door to the next support zone of 25580 ~ 25550. Bulls need to reclaim 25790 quickly to avoid deeper retracement.
🛡 5 Min Intraday Chart with Levels
🛡 Intraday Walk
Flat-to-weak open quickly turned bearish, breaking PDL.
A surprise 131-point spike trapped early bulls.
Resistance at 25950 and CPR rejection flipped momentum back to bears.
Sharp fall below S1; support emerged at 25790.
Long sideways phase around 25800, followed by a late sell-off to 25725.
Closed near the day’s low — bears in firm control.
📉 Daily Time Frame Chart with Intraday Levels
🕯 Daily Candle Breakdown
Open: 25,863.80
High: 25,953.75
Low: 25,711.20
Close: 25,722.10
Change: −155.75 (−0.60%)
🏗️ Structure Breakdown
Type: Bearish candle with long upper wick, close near day’s low.
Range (High–Low): 242.55 points → wide and volatile.
Body: ≈ 141.70 points → decisive selling pressure.
Upper Wick: ≈ 89.95 points → strong rejection from highs.
Lower Wick: ≈ 10.90 points → weak recovery near close.
📚 Interpretation
Despite a volatile start, the bears dominated throughout. The session’s failed recovery and close near the lows reflect an exhaustion of buying power. The long upper shadow signals repeated rejections at resistance, confirming that sellers continue to defend higher levels strongly.
🕯Candle Type
A Bearish Continuation Candle, extending Thursday’s weakness. The upper shadow rejection shows that bulls’ attempts to reclaim ground were quickly overpowered by sellers.
🛡 5 Min Intraday Chart
⚔️ Gladiator Strategy Update
ATR: 206.86
IB Range: 131.65 → Medium
Market Structure: Imbalanced (Bearish Bias)
Trade Highlights:
9:53 – Short Trade → Target Achieved (R:R 1:2.89)
10:26 – Short Trade → Trailing SL Hit
13:37 – Short Trade → Trailing SL Hit
📌 What’s Next? / Bias Direction
The October expiry week ended with a decisive bearish tone.
If Monday opens below 25715 and fails to reclaim 25790, expect a slide toward 25580 ~ 25550 in the short term.
Conversely, only a close above 25880 can ease selling pressure and hint at a relief bounce.
For now, bearish momentum remains dominant — trade light, stay objective, and let the structure confirm before committing.
📌 Support & Resistance Levels
Resistance Zones:
25790
25865 ~ 25880
25920 ~ 25944
Support Zones:
25635 ~ 25615
25585
25550
25510
25460 ~ 25440
💡 Final Thoughts
“When the market traps the impatient, it rewards the disciplined. Let structure—not emotion—guide your trades.”
✏️ Disclaimer
This is just my personal viewpoint. Always consult your financial advisor before taking any action.

Fair Value Gaps: The Market Secret You Shouldn’t IgnoreEver scrolled through a chart and spotted a weird empty space in the candles — like the market just skipped a beat? That’s a Fair Value Gap (FVG). It’s one of those subtle price imbalances smart traders love to hunt for. Understanding how these gaps form and how price reacts around them can seriously level up your chart-reading game.
What Is a Fair Value Gap in Trading?
A Fair Value Gap happens when there’s a sudden surge in buying or selling pressure that causes price to move so fast, it doesn’t fully balance out between buyers and sellers. In simple terms, it’s an imbalance — a zone where the market skipped over potential orders.
When you hear traders talking about FVG in trading, they’re referring to those little pockets of unfilled liquidity left behind during strong moves.
So, what is FVG in trading, and why does it matter? Because price often comes back to those areas later to “rebalance” — filling the gap before continuing in the original direction. That’s the core logic behind Fair Value Gap trading.
Bullish and Bearish FVGs
There are two main types of Fair Value Gaps — bullish and bearish:
Bullish Fair Value Gap (bullish FVG): Forms during a strong upward move, when aggressive buyers push price higher, leaving a void below. Price might later dip back into that zone before continuing upward.
Bearish Fair Value Gap (bearish FVG): Forms in a sell-off, when sellers dominate and the market drops quickly, skipping over potential buy orders. Later, price often retraces upward to “fill” that gap.
Both can act as magnets for liquidity — areas where smart money likes to re-enter the market.
Fair Value Gap Example
Let’s say Bitcoin jumps from $110,000 to $120,000 in a single bullish candle, with almost no trading in between. That sudden move leaves a Fair Value Gap — the zone between the candle’s high and low where little to no trading took place.
If the market later pulls back to that range and finds support before bouncing, you’ve just witnessed a textbook Fair Value Gap example in action.
Using a Fair Value Gap Indicator
You can spot these zones manually by looking for three-candle structures — one candle that “leaves the gap” and two surrounding it that don’t overlap. But if you prefer automation, you can use a Fair Value Gap indicators:
Fair Value Gap Trading Strategies
Fair Value Gap trading isn’t about chasing price — it’s about waiting for the market to come back to you. Within Smart Money Concepts, traders often combine FVGs with CHoCH (Change of Character) to confirm a potential shift in structure before entering.
A common approach is to mark recent FVGs, identify the broader trend, and wait for price to revisit a gap in line with that trend.
In a bullish trend , traders look for bullish FVGs below current price as potential demand zones — ideally after a CHoCH confirms that buyers are stepping back in.
In a bearish trend , they watch for bearish FVGs above current price as potential supply zones, again validated by a CHoCH showing a shift in control.
Still, it’s important to remember — these setups are not guarantees. The market doesn’t owe you a fill. Use FVGs and CHoCH as part of the Smart Money framework, not as standalone signals. Always manage risk and make your own trading decisions based on your personal strategy and comfort level.
Final Thoughts
So, what is a Fair Value Gap really? It’s not magic — just the market showing where it moved too fast. Learning to read Fair Value Gaps gives you insight into liquidity, momentum, and potential reversals. Whether you use a Fair Value Gap indicator or mark them by hand, mastering FVG in trading can give you a serious edge in spotting high-probability zones.
Just keep in mind — no indicator or setup replaces good judgment.
Observe, adapt, and let the charts speak for themselves.

EURAUD LOCAL LONG|
✅EURAUD tapped into a well-defined demand level and is showing signs of accumulation. With liquidity taken below previous lows, a short-term bullish reaction toward the next imbalance zone is likely. Time Frame 3H.
LONG🚀
✅Like and subscribe to never miss a new idea!✅

EUR-USD Bearish Breakout! Sell!
Hello,Traders!
EURUSD has broken below the horizontal supply area, confirming a bearish structure shift. A short-term pullback could provide premium entries toward the next liquidity pool below.Time Frame 4H.
Sell!
Comment and subscribe to help us grow!
Check out other forecasts below too!
Disclosure: I am part of Trade Nation's Influencer program and receive a monthly fee for using their TradingView charts in my analysis.

ZEC proves that old-school crypto still got the fire!The price of CRYPTOCAP:ZEC finally broke out from a long consolidation (unlike poor #DASH 😅).
💰 Market cap already exceeded $6B, even slightly surpassing CRYPTOCAP:XMR (Monero).
🪙 True old-school vibes:
Total supply is limited to 21M coins — just like CRYPTOCAP:BTC . No trillions, no inflationary nonsense 😎
📊 On the #ZECUSDT chart, we see an almost correction-free rally — brief pauses between levels and then another leg up.
In fact, CRYPTOCAP:ZEC just broke above its 2021 high, and we don’t really see any major profit-taking yet.
🧩 P.S. The technical levels work beautifully — use them wisely 😉
⚖️ But the real question is:
is this genuine demand for anonymity, or is someone carefully pumping CRYPTOCAP:ZEC after years of mining accumulation?
______________
◆ Follow us ❤️ for daily crypto insights & updates!
🚀 Don’t miss out on important market moves
🧠 DYOR | This is not financial advice, just thinking out loud.

NZDJPY the 90.00 is target but after short-term fall first The broader technical structure for NZDJPY remains fundamentally bullish. However, our analysis suggests the pair may be due for a short-term corrective pullback before the primary uptrend resumes.
We are monitoring two potential scenarios:
Direct Continuation: The market could continue its upward momentum imminently, with an initial projected target offering a 200-pip gain from the current level.
Corrective then Impulsive (Preferred Scenario): A more probable path is a deeper 300-pip corrective decline towards a key support zone. This would create a more robust technical foundation. A strong bullish reversal from that support would then be expected to initiate the next significant impulsive wave, targeting a 500-pip advance toward the primary objective at the 90.00 psychological and technical resistance level.
A strategic approach would be to wait for a confirmed bullish reversal following any potential pullback, entering with a stop-loss placed below the identified support to define the risk clearly.
DISCLAIMER: ((trade based on your own decision))
<<press like👍 if you enjoy💚

XAUUSD major pump not finished yet Gold has initiated a short-term corrective phase, with technical indicators suggesting potential for further downside in the immediate term. However, this near-term weakness does not alter our constructive long-term fundamental and technical outlook.
The broader macroeconomic backdrop, including factors such as central bank demand, inflationary pressures, and geopolitical uncertainty, continues to support a structurally bullish thesis for the asset.
Based on this macro-technical analysis, we project a sustained upward trajectory over the coming months. The primary long-term target remains the $5,000 per ounce level, which we view as a feasible objective within the current global economic cycle.
DISCLAIMER: ((trade based on your own decision))
<<press like👍 if you enjoy💚

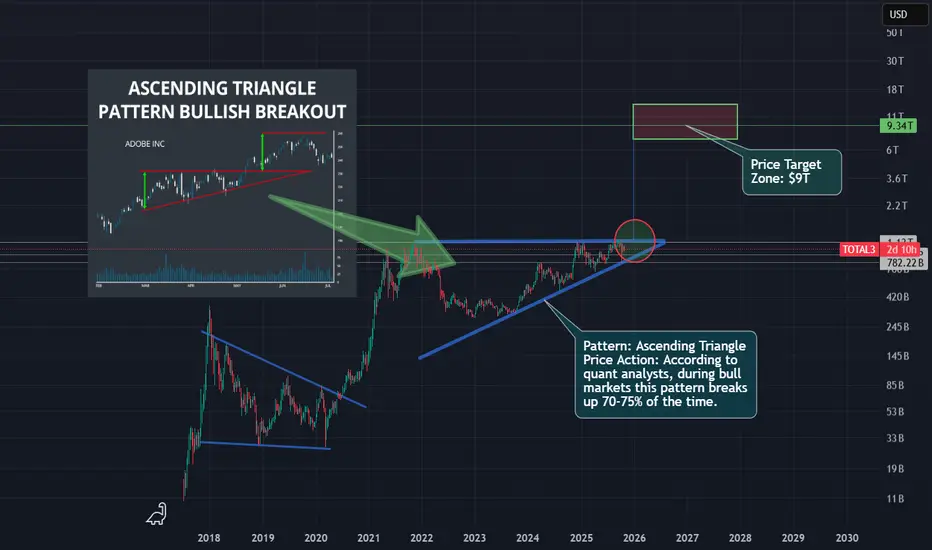
Zoom out to see the bigger TOTAL3 Crypto picture!This is just my opinion, but judging by the Total 3 crypto market cap today, we can see an a large ascending triangle has been forming on the weekly time frame and it looks to break soon. This pattern (in a bull market) may break up 70-75% of the time. I believe that puts a measured move to approx. $9trillion (yes trillion), in 2027.
Bookmark this and see if I'm right!
NZDUSD Trading Opportunity! BUY!
My dear friends,
Please, find my technical outlook for NZDUSD below:
The instrument tests an important psychological level 0.5719
Bias - Bullish
Technical Indicators: Supper Trend gives a precise Bullish signal, while Pivot Point HL predicts price changes and potential reversals in the market.
Target - 0.5746
About Used Indicators:
Super-trend indicator is more useful in trending markets where there are clear uptrends and downtrends in price.
Disclosure: I am part of Trade Nation's Influencer program and receive a monthly fee for using their TradingView charts in my analysis.
———————————
WISH YOU ALL LUCK

$SOL (4-HOUR): LONG $187, reasoning. CRYPTOCAP:SOL has had $154M in #ETF inflows this week, not bad for the first few days on the market. But this is not a reason for a LONG ($187) I have just opened.
The original plan was to LONG the $205 breakout for a while, but a HIDDEN BEARISH RSI divergence flashed and the $205 resistance got retested, printing a LOWER HIGH again, and the price dipped to retest the 200 MA + the ascending trendline (confluence of SUPPORT).
It was the 4th retest this month and it has been solid, each time giving us a HIGHER LOW as well.
I highlighted in light-blue also a horizontal SUPPORT ZONE and #solana has been sitting inside of it, so there is plenty of support of all kinds, including a GOLDEN POCKET ($172 - $176).
A sequence of 2 HIDDEN BULLISH OBV divergences triggered this LONG at the end.
And below the pocket is where I would EXIT this trade — 2 or 3 candle closes (4-hour ones, not the daily ones) and I'm out.
I also highlighted an interesting fractal of price action: notice the Q4 2024 resemblance to the current behaviour — DOWNTREND toward the same horizontal support ZONE supported by the 200 MA, followed by a huge SURGE.
This is quite a risky trade due to the general market circumstances, and I will monitor the reaction very closely around $200 again, and possibly add to size on a BREAKOUT as originally intended.
💙👽
#long

CADJPY: Stalking a Pro-Trend Long from the Demand ZoneThe instrument is in an uptrend and is showing the beginning of a potential correction on the 4H structure. If the correction continues its downward movement, long positions can be considered from the DEMAND zone in conjunction with a reaction from one of the Fib levels.
The entry condition will be the price finding acceptance above the 50%, 61.8%, or 78.6% levels upon reaching them.
If a long setup forms, the target will be the high of January 6, 2025 .
The invalidation for the long scenarios in this trade idea will be a break of the 78.6% local level . In that case, the correction will transition to the higher structure, and long positions could then be considered from the daily Fib levels and the daily order block located below.
~~~~~~~~~~~~~~~~~~~~~~~~~~~~~~~~~~~~~~~~~~~~~~~~~~~~~~~~~~~~~~~~~
The principles and conditions for forming the manipulation zones I show in this trade idea are detailed in my educational publication, which was chosen by TradingView for the "Editor's Picks" category and received a huge amount of positive feedback from this insightful trading community. To better understand the logic I've used here and the general principles of price movement in most markets from the perspective of institutional capital, I highly recommend checking out this guide if you haven't already. 👇
P.S. This is not a prediction of the exact price direction. It is a description of high-probability setups that become valid only if specific conditions are met when the price reaches the marked POI. If the conditions are not met, the setups are invalid. No setup has a 100% success rate, so if you decide to use this trade idea, always apply a stop-loss and proper risk management. Trade smart.
~~~~~~~~~~~~~~~~~~~~~~~~~~~~~~~~~~~~~~~~~~~~~~~~~~~~~~~~~~~~~~~~~
If you found this analysis helpful, support it with a Boost! 🚀
Have a question or your own view on this idea? Share it in the comments. 💬
► Follow me on TradingView for timely updates on THIS idea (entry, targets & live trade management) and not to miss my next detailed breakdown.
~~~~~~~~~~~~~~~~~~~~~~~~~~~~~~~~~~~~~~~~~~~~~~~~~~~~~~~~~~~~~~~~~

Lingrid | TONUSDT Key Confluence Support Long OpportunityThe price perfectly fulfilled my previous idea . OKX:TONUSDT is retesting the key confluence area near 2.13 after multiple higher lows formed along the ascending support trendline. Price action shows compression within a narrowing structure, hinting at potential breakout momentum building up. A confirmed bounce from this support may lift price toward 2.28, aligning with short-term resistance and the upper boundary of the range. Overall bias stays bullish as long as the 2.10–2.13 support cluster holds firm.
⚠️ Risks:
Failure to hold the 2.10 support zone could invalidate the bullish scenario.
Increased volatility ahead of macro data releases could cause short-term whipsaws.
Weak momentum or low trading volume may limit the breakout’s sustainability.
If this idea resonates with you or you have your own opinion, traders, hit the comments. I’m excited to read your thoughts!

EURUSD road map (4h)The expected targets are marked on the chart and I think in the coming days, the trend will be bullish. After reaching the desired targets, it can drop to 1.04.
Give me some energy !!
✨We spend hours finding potential opportunities and writing useful ideas, we would be happy if you support us.
Best regards CobraVanguard.💚
_ _ _ _ __ _ _ _ _ _ _ _ _ _ _ _ _ _ _ _ _ _ _ _ _ _ _ _ _ _ _ _
✅Thank you, and for more ideas, hit ❤️Like❤️ and 🌟Follow🌟!
⚠️Things can change...
The markets are always changing and even with all these signals, the market changes tend to be strong and fast!!

Did you Know ?!!!Did you really think that profiting from the current bull run (a comprehensive upward market) would be easy? Don't be naive. Do you think they will let you buy, hold, and sell at low levels without any struggle? If it were that simple, everyone would be rich. But the truth is: 90% of you will lose. Why? Because the crypto market is not designed for everyone to win. They will shake you. They will make you doubt everything. They will panic you and sell at the worst possible moment. Do you know what happens next? The best players in this game buy when there is fear, not sell; because your panic gives them cheap assets. This is how the game goes: strong hands feed off weak hands. They exaggerate every dip, every correction, every sale. They make it look like the end of the world so that you abandon everything, and when the market starts up again, you'll sit there saying, "What the heck just happened?" This is not an accident. It's a system. The market rewards patience and punishes weak emotions. The big players already know your thoughts. They know exactly when and how to stir fear to make you give up. Because when you panic, they profit. They don't play the market. They play you. That's why most people never succeed. Because they fall into the same traps over and over again. People don't realize that dips, FUD (fear, uncertainty, doubt), and panic are all part of the plan. But the winners? They digest the noise. They know that fear is temporary, but smart decisions last forever. We've seen this hundreds of times. They pump the market after you sell. They take your assets, hold them, and sell them to you at the top, leaving you with nothing, wondering how it happened. Don't play their game. Play your own.
REMEMBER
