USDCAD: Bullish Outlook For Next Week Explained 🇺🇸🇨🇦
There is a high chance that USDCAD will keep rising next week.
A test of the underlined blue support triggered a strong bullish reaction
and a breakout of a resistance line of a falling wedge pattern.
I think that the pair may rise and reach at least 1.4357 level.
❤️Please, support my work with like, thank you!❤️
I am part of Trade Nation's Influencer program and receive a monthly fee for using their TradingView charts in my analysis.
Contains image
Convexity-based trade scenario using LOAR stock and the April 17Yo traders -
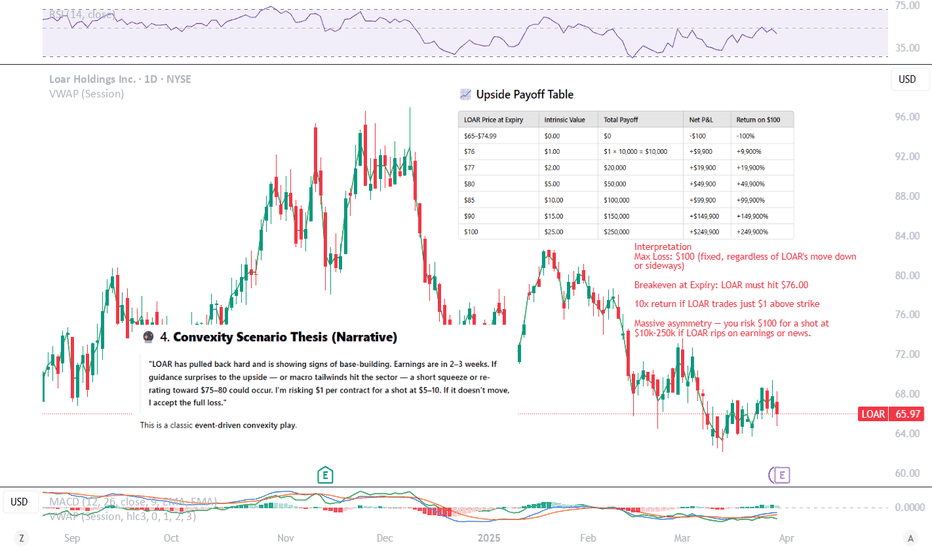
Let’s map out a convexity-based trade scenario using LOAR stock and the April 17, 2025 $75 Call option — currently trading at $1.00, with the stock at $65.97 and only 18 days to expiry.
🔍 Step-by-Step Breakdown:
🧠 1. Basic Structure
You’re buying the LOAR Apr17 $75 call at $1.00.
This is a deep OTM bet (~13.7% above current price).
You’re betting on a short-term move to $75+, meaning volatility spike or news catalyst.
⚙️ 2. Convexity Setup
Convexity means:
Small risk, asymmetric reward
If LOAR stays flat or dips → you lose $1 per contract
If LOAR rips to $80+ → this option could return 5x to 10x+
LOAR Price at Expiry Option Intrinsic Value Profit/Loss
$66 (flat) $0 -$1.00
$70 $0 -$1.00
$75 (strike) $0 -$1.00
$77 $2.00 +$1.00
$80 $5.00 +$4.00 (5x)
$85 $10.00 +$9.00 (9x)
🧾 3. Chart + Sentiment Setup
Looking at the TradingView chart:
Price Action:
LOAR is basing around $66 after a steep downtrend — potential reversal pattern
Volume is light, but some buy pressure is visible
MACD:
Appears to be flattening and potentially crossing bullish
RSI:
~40s: Oversold-to-neutral zone. Could support upward bounce.
Earnings coming up (E icon):
Strong potential for a catalyst move
This setup enhances convexity, because earnings can produce gap moves that DOTM options profit from disproportionately.
🔮 4. Convexity Scenario Thesis (Narrative)
"LOAR has pulled back hard and is showing signs of base-building. Earnings are in 2–3 weeks. If guidance surprises to the upside — or macro tailwinds hit the sector — a short squeeze or re-rating toward $75–80 could occur. I’m risking $1 per contract for a shot at $5–10. If it doesn’t move, I accept the full loss."
This is a classic event-driven convexity play.
⚠️ 5. Risks & Considerations
Time decay is brutal: With only 18 days left, theta decay accelerates daily
IV Crush post-earnings could hurt even if the stock moves
You need a fast, strong move, ideally before or at earnings
Position sizing is critical: This is a "lottery ticket" — don’t over-allocate
✅ 6. Ideal for Your Strategy If:
You're making many small bets like this across tickers/catalysts
You’re not trying to be “right” often, but “big” occasionally
You have capital discipline and uncorrelated base assets
🧮 Position Size:
Option price = $1.00 per contract
You buy 100 contracts of the $75 call
Total risk = $100
Each $1.00 move above $75 = $100 profit per $1, since 100 contracts × 100 shares/contract = 10,000 shares exposure
📈 Upside Payoff Table
LOAR Price at Expiry Intrinsic Value Total Payoff Net P&L Return on $100
$65–$74.99 $0.00 $0 -$100 -100%
$76 $1.00 $1 × 10,000 = $10,000 +$9,900 +9,900%
$77 $2.00 $20,000 +$19,900 +19,900%
$80 $5.00 $50,000 +$49,900 +49,900%
$85 $10.00 $100,000 +$99,900 +99,900%
$90 $15.00 $150,000 +$149,900 +149,900%
$100 $25.00 $250,000 +$249,900 +249,900%
🧠 Interpretation
Max Loss: $100 (fixed, regardless of LOAR's move down or sideways)
Breakeven at Expiry: LOAR must hit $76.00
10x return if LOAR trades just $1 above strike
Massive asymmetry — you risk $100 for a shot at $10k–250k if LOAR rips on earnings or news.
📌 Real-World Considerations:
You might exit early if the option spikes in value before expiry (e.g., stock runs to $72 with 5 days left).
Liquidity may limit large size fills.
Volatility matters: IV spike pre-earnings or a big gap post-earnings increases your chance of profit.
📊 Convex Payoff Table for LOAR Apr17 $75 Call (100 Contracts, $100 Risk)
LOAR Price at Expiry % Move from $65.97 Intrinsic Value Total Payoff Net P&L Return on $100
$65–$74.99 0% to +13.6% $0.00 $0 -$100 -100%
$76 +15.2% $1.00 $10,000 +$9,900 +9,900%
$77 +17.0% $2.00 $20,000 +$19,900 +19,900%
$80 +21.3% $5.00 $50,000 +$49,900 +49,900%
$85 +28.9% $10.00 $100,000 +$99,900 +99,900%
$90 +36.4% $15.00 $150,000 +$149,900 +149,900%
$100 +51.6% $25.00 $250,000 +$249,900 +249,900%
🧠 Takeaway:
Even a 15% move turns your $100 into $10,000 — this is why convex trades are so powerful.
But the trade-off is probability: the odds of a 15–50%+ move in 18 days are low, which is why risk is capped and position sizing matters.
3 Best Trading Opportunities to Maximize Profit Potential
Hey traders,
In the today's article, we will discuss 3 types of incredibly accurate setups that you can apply for trading financial markets.
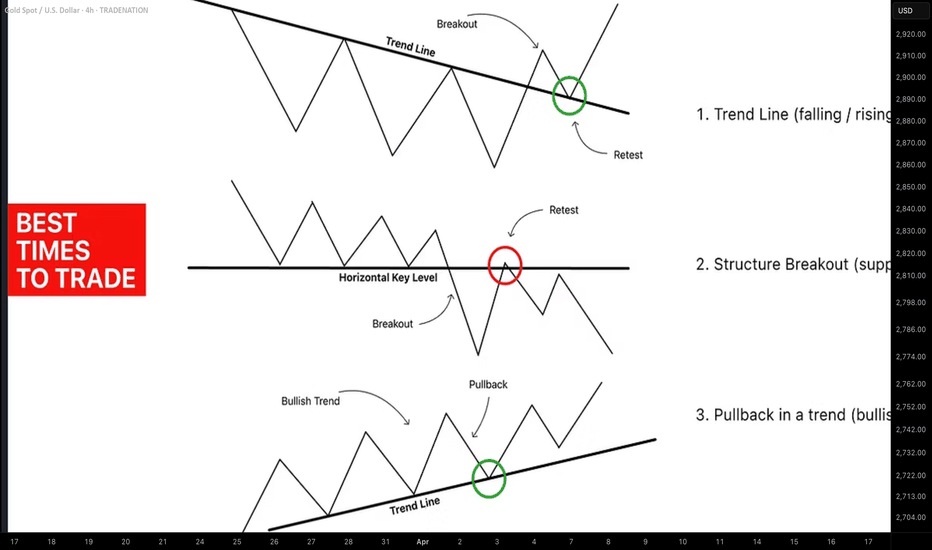
1. Trend Line Breakout and Retest
The first setup is a classic trend line breakout.
Please, note that such a setup will be accurate if the trend line is based on at least 3 consequent bullish or bearish moves.
If the market bounces from a trend line, it is a vertical support.
If the market drops from a trend line, it is a vertical resistance.
The breakout of the trend line - vertical support is a candle close below that. After a breakout, it turns into a safe point to sell the market from.
The breakout of the trend line - vertical resistance is a candle close above that. After a breakout, it turns into a safe point to buy the market from.
Take a look at the example. On GBPJPY, the market was growing steadily, respecting a rising trend line that was a vertical support.
A candle close below that confirmed its bearish violation.
It turned into a vertical resistance .
Its retest was a perfect point to sell the market from.
2. Horizontal Structure Breakout and Retest
The second setup is a breakout of a horizontal key level.
The breakout of a horizontal support and a candle close below that is a strong bearish signal. After a breakout, a support turns into a resistance.
Its retest is a safe point to sell the market from.
The breakout of a horizontal resistance and a candle close above that is a strong bullish signal. After a breakout, a resistance turns into a support.
Its retest if a safe point to buy the market from.
Here is the example. WTI Crude Oil broke a key daily structure resistance. A candle close above confirmed the violation.
After a breakout, the broken resistance turned into a support.
Its test was a perfect point to buy the market from.
3. Buying / Selling the Market After Pullbacks
The third option is to trade the market after pullbacks.
However, remember that the market should be strictly in a trend .
In a bullish trend, the market corrects itself after it sets new higher highs. The higher lows usually respect the rising trend lines.
Buying the market from such a trend line, you open a safe trend-following trade.
In a bearish trend, after the price sets lower lows, the correctional movements initiate. The lower highs quite often respect the falling trend lines.
Selling the market from such a trend line, you open a safe trend-following trade.
On the chart above, we can see EURAUD pair trading in a bullish trend.
After the price sets new highs, it retraces to a rising trend line.
Once the trend line is reached, trend-following movements initiate.
What I like about these 3 setups is the fact that they work on every market and on every time frame. So no matter what you trade and what is your trading style, you can apply them for making nice profits.
❤️Please, support my work with like, thank you!❤️
I am part of Trade Nation's Influencer program and receive a monthly fee for using their TradingView charts in my analysis.
SPY Set To Grow! BUY!
My dear friends,
SPY looks like it will make a good move, and here are the details:
The market is trading on 555.80 pivot level.
Bias - Bullish
Technical Indicators: Supper Trend generates a clear long signal while Pivot Point HL is currently determining the overall Bullish trend of the market.
Goal - 569.99
Recommended Stop Loss - 549.79
About Used Indicators:
Pivot points are a great way to identify areas of support and resistance, but they work best when combined with other kinds of technical analysis
Disclosure: I am part of Trade Nation's Influencer program and receive a monthly fee for using their TradingView charts in my analysis.
———————————
WISH YOU ALL LUCK
QQQ Will Explode! BUY!
My dear subscribers,
This is my opinion on the QQQ next move:
The instrument tests an important psychological level 468.97
Bias - Bullish
Technical Indicators: Supper Trend gives a precise Bullish signal, while Pivot Point HL predicts price changes and potential reversals in the market.
Target - 488.44
My Stop Loss - 457.91
About Used Indicators:
On the subsequent day, trading above the pivot point is thought to indicate ongoing bullish sentiment, while trading below the pivot point indicates bearish sentiment.
Disclosure: I am part of Trade Nation's Influencer program and receive a monthly fee for using their TradingView charts in my analysis.
———————————
WISH YOU ALL LUCK
Lingrid | SUIUSDT fake break of CONSOLIDATtion zoneThe price perfectly fulfills my last idea . It hit the target level. BINANCE:SUIUSDT consolidated around the 2.30 level before breaking above it; however, the price subsequently pulled back and returned to the consolidation zone. This behavior resembles a "dead cat bounce," as we did not observe further upward movement. Below, we can see an upward trendline that has been tested multiple times. I believe the price may break through this trendline and continue moving downward since it was tested may times. My goal is support zone around 2.100
Traders, If you liked this educational post🎓, give it a boost 🚀 and drop a comment 📣
Speculating Bitcoin's Cycle Top!Hello TradingView Family / Fellow Traders. This is Richard, also known as theSignalyst.
📚 Back to basics.
🗓️ This is the BTC monthly log chart.
📊 By applying two simple channels—one short-term (🔴) and one long-term (🔵)—we see both upper bounds aligning right around the 💰 $300,000 mark. A classic case of confluence at a key psychological level 🧠✨
👇 What do you think—are we headed there this cycle, or is it just hopium? Drop your thoughts in the comments!
📚 Always follow your trading plan regarding entry, risk management, and trade management.
Good luck!
All Strategies Are Good; If Managed Properly!
~Rich
USOIL BEARS WILL DOMINATE THE MARKET|SHORT
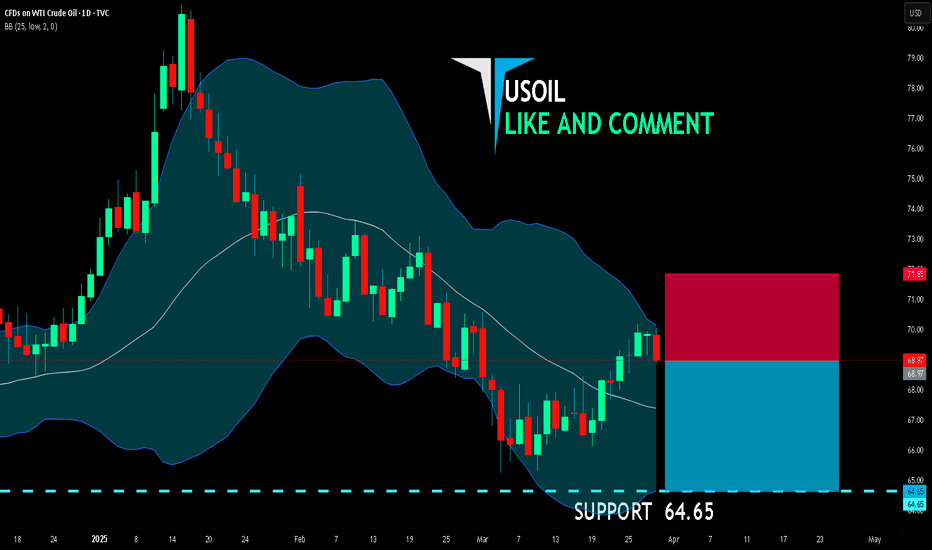
USOIL SIGNAL
Trade Direction: short
Entry Level: 68.97
Target Level: 64.65
Stop Loss: 71.85
RISK PROFILE
Risk level: medium
Suggested risk: 1%
Timeframe: 1D
Disclosure: I am part of Trade Nation's Influencer program and receive a monthly fee for using their TradingView charts in my analysis.
✅LIKE AND COMMENT MY IDEAS✅
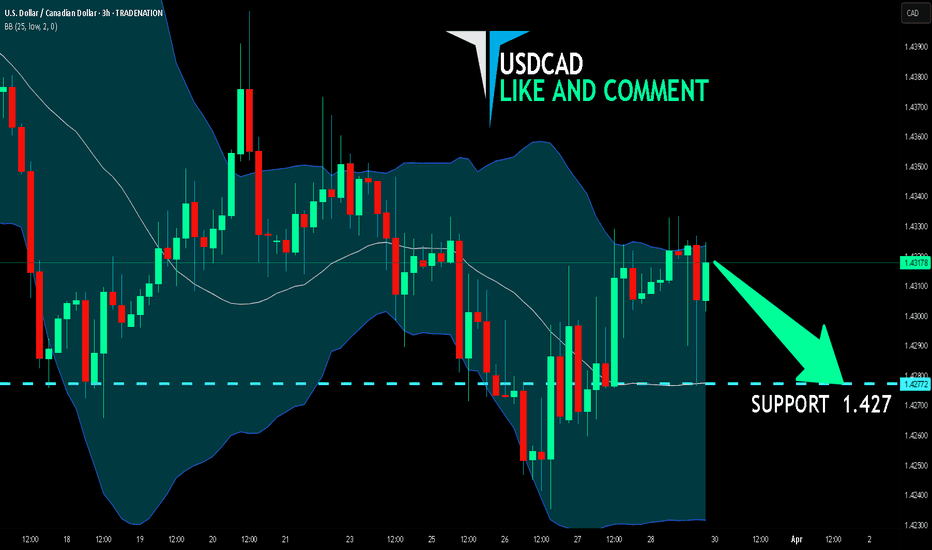
USD/CAD SENDS CLEAR BEARISH SIGNALS|SHORT
Hello, Friends!
The BB upper band is nearby so USD/CAD is in the overbought territory. Thus, despite the uptrend on the 1W timeframe I think that we will see a bearish reaction from the resistance line above and a move down towards the target at around 1.427.
Disclosure: I am part of Trade Nation's Influencer program and receive a monthly fee for using their TradingView charts in my analysis.
✅LIKE AND COMMENT MY IDEAS✅
USD/JPY BULLS ARE GAINING STRENGTH|LONG
Hello, Friends!
Previous week’s red candle means that for us the USD/JPY pair is in the downtrend. And the current movement leg was also down but the support line will be hit soon and lower BB band proximity will signal an oversold condition so we will go for a counter-trend long trade with the target being at 150.465.
Disclosure: I am part of Trade Nation's Influencer program and receive a monthly fee for using their TradingView charts in my analysis.
✅LIKE AND COMMENT MY IDEAS✅
NZD/USD BEST PLACE TO BUY FROM|LONG
Hello, Friends!
NZD/USD is trending up which is clear from the green colour of the previous weekly candle. However, the price has locally plunged into the oversold territory. Which can be told from its proximity to the BB lower band. Which presents a classical trend following opportunity for a long trade from the support line below towards the supply level of 0.573.
Disclosure: I am part of Trade Nation's Influencer program and receive a monthly fee for using their TradingView charts in my analysis.
✅LIKE AND COMMENT MY IDEAS✅
MEWUSDT → False breakout of resistance after distributionBINANCE:MEWUSDT.P in the distribution phase is testing a strong resistance and liquidity zone against which it makes a false breakout.
Regarding the current situation, we should pay attention to several key levels - support and upper resistance. A retest of 0.00300 - 0.00312 is possible, the target of which could be another liquidity zone, before MEW continues its fall according to the current local and global trend, which have a common direction on the background of weak bitcoin and weak cryptocurrency market.
Resistance levels: 0.002793, 0.003, 0.00312
Support levels: 0.002696
The key support area plays the role of 0.002696, which are trying to contain the market. Below this line is a free zone and there are no levels that can prevent the movement. Thus, the breakdown and consolidation of the price under 0.026969 can provoke a strong impulse towards the zones of interest 0.00222, 0.002
Regards R. Linda!
Bitcoin Outlook after the Dip. What to expect NOW?Finally, the price broke the wedge, and the price experienced a significant drop. I think now is the time for Bitcoin to rise again to 89K . STRONG SUPPORT 0.382=82500
Give me some energy !!
✨We spend hours finding potential opportunities and writing useful ideas, we would be happy if you support us.
Best regards CobraVanguard.💚
_ _ _ _ __ _ _ _ _ _ _ _ _ _ _ _ _ _ _ _ _ _ _ _ _ _ _ _ _ _ _ _
✅Thank you, and for more ideas, hit ❤️Like❤️ and 🌟Follow🌟!
⚠️Things can change...
The markets are always changing and even with all these signals, the market changes tend to be strong and fast!!
ADA Ready for PUMP or what ?The ADA will increase SEVEN cents and reach to the top of the wedge in the coming DAYS.
Give me some energy !!
✨We spend hours finding potential opportunities and writing useful ideas, we would be happy if you support us.
Best regards CobraVanguard.💚
_ _ _ _ __ _ _ _ _ _ _ _ _ _ _ _ _ _ _ _ _ _ _ _ _ _ _ _ _ _ _ _
✅Thank you, and for more ideas, hit ❤️Like❤️ and 🌟Follow🌟!
⚠️Things can change...
The markets are always changing and even with all these signals, the market changes tend to be strong and fast!!
LINK - Excellent Signal yesterday.Look at what i wrote about OBV line in previous TA.
OBV Broke the line and jumped in short.
Almost 9% till now 🎯 👌
BOOOOOM ... !
Look at original Signal from yesterday :
Follow for more ideas/Signals. 💲
Look at my other ideas 😉
Just donate some of your profit to Animal rights and rescue or other charity :)✌️
ETH - Nice Prediction I was expecting a drop. The drop was forming as "3 Fan Principle". The perfect FP didn't happen but the drop was expected. BOOM the drop.
Almost 7% an going on ... 🎯 👌
Original TA here:
Follow for more ideas/Signals. 💲
Look at my other ideas 😉
Just donate some of your profit to Animal rights and rescue or other charity :)✌️
GOLD - XAUUSDLocally, the XAUUSD price broke through the downtrend lines. Now we are near the first resistance of 1900. The next liquidity level is near 1950.
Many experts believe that the price will move sideways until geopolitical tensions subside or until the FED raises interest rates. However, even if rates start to rise with high inflation - the real interest rates are likely to be negative. Therefore, they believe that gold will remain attractive as a defensive asset.
Rising gold = a traditional harbinger of crises and slight shocks in the stock and crypto markets. Gold is an excellent choice for those who don't particularly want to go into cash inflation but don't want to be present in dive markets.
Best regards,
EXCAVO
BTC - Wonderful Prediction. What a Signal/TA :)my Last Words : " A break out downward from grey lines would be more natural regarding Volume."
That natural move happened :)
What a nice prediction.
Even retested the grey line and blue box.
Original TA here:https://www.tradingview.com/chart/BTCUSDT.P/UGWDDY3U-BTC-New-Local-TA/
Follow for more ideas/Signals. 💲
Look at my other ideas 😉
Just donate some of your profit to Animal rights and rescue or other charity :)✌️
The Endgame for EUR/USD? Final Impulse Before a Macro Reversal📉 FX_IDC:EURUSD Forecast — Final Growth Phase Within a Corrective Structure
🌍 Macro View (Weekly Chart):
FX:EURUSD remains in a long-term corrective structure that has been developing since 2008. The sequence of zigzags and connecting waves suggests a W–X–Y pattern, where the current upward leg is part of wave (B) before a potential final drop into wave (C).
🧭 Mid-Term Structure (3D Chart):
Since early 2023, wave (B) has been unfolding to the upside, with wave C forming inside it as a five-wave impulsive move.
⏱️ Short-Term Structure (6h Chart):
Since the start of 2025, an impulsive wave structure has been developing. Currently, OANDA:EURUSD is likely completing wave 3 and entering wave 4.
⚠️ Wave 4 may take one of the following forms:
FL — Flat
EFL — Expanding Flat
RFL — Running Flat
cT — Contracting Triangle
bT — Barrier Triangle
d3 — Double Three
Once wave 4 completes, I expect a final push upward (wave 5), marking the culmination of the current cycle before a potential reversal into wave (C) of the higher degree.
🔁 Correlation with the ICEUS:DXY TVC:DXY :
This outlook closely aligns with my previously published forecast on the CAPITALCOM:DXY , which has already started playing out:
🔗
📌 FOREXCOM:EURUSD holds potential for completing its fifth wave up, after which a reversal and the beginning of a broader decline may follow.
The scenario is further validated by the mirror correlation with DXY dynamics.
GBPUSD | APRIL 2025 FORECAST | Chopping Block is Hot!GBP/USD is approaching the psychological 1.3000 level, a key battleground for bulls and bears. The pair has been trading within a rising channel, but recent price action suggests momentum could be shifting.
🔹 Trend & Structure: GBP/USD remains in a broader uptrend but is struggling to maintain bullish momentum above 1.3000. A confirmed break could signal continuation, while rejection may trigger a retracement toward 1.2800-1.2750.
🔹 Technical Outlook:
Support Levels: 1.2850, 1.2750
Resistance Levels: 1.3050, 1.3150
Indicators: RSI hovers near 65, signaling slight overextension; MACD shows bullish momentum but weakening.
🔹 Fundamental Factors:
BOE policy expectations vs. Fed’s stance on rate cuts.
US & UK economic data—watch CPI and employment figures.
If GBP/USD clears and holds above 1.3000, it could open doors for a rally toward 1.3150. But if sellers defend this level, we might see a pullback toward 1.2850-1.2750 before the next move.
Will 1.3000 hold, or is a reversal on the horizon? Drop your predictions below! 📉📈 #GBPUSD #ForexTrading #MarketAnalysis
RDW – Redwire Corporation – 30-Min Long Trade Setup !:
📈 🚀
🔹 Asset: RDW (NYSE)
🔹 Timeframe: 30-Min Chart
🔹 Setup Type: Falling Wedge Breakout + Base Formation
📊 Trade Plan (Long Position)
✅ Entry Zone: Around $8.90 (wedge breakout + price base confirmation)
✅ Stop-Loss (SL): Below $8.40 (structure support & risk protection zone)
🎯 Take Profit Targets
📌 TP1: $9.37 (immediate resistance / consolidation zone)
📌 TP2: $10.17 (major resistance / recovery target)
📊 Risk-Reward Ratio Calculation
📉 Risk (SL Distance):
$8.90 - $8.40 = $0.50 risk per share
📈 Reward to TP1:
$9.37 - $8.90 = $0.47 → (0.94:1 R/R)
📈 Reward to TP2:
$10.17 - $8.90 = $1.27 → (2.54:1 R/R)
🔍 Technical Analysis & Strategy
📌 Falling Wedge Pattern: Tight consolidation with descending resistance broken
📌 Base Forming at Support: Price stabilizing above $8.40
📌 Breakout with Reaction: Bullish breakout confirmed by yellow zone retest
📌 Oversold Setup: Downtrend exhaustion with reversal potential
⚙️ Trade Execution & Risk Management
📊 Confirm bullish momentum after breakout close
📉 Trailing Stop Strategy:
Shift SL to breakeven after TP1 is hit
💰 Partial Profit Booking Strategy
✔ Book 50% at TP1 = $9.37
✔ Let the rest ride toward TP2 = $10.17
✔ Adjust SL to protect gains
⚠️ Breakout Failure Risk
❌ Setup invalidated if price breaks below $8.40
❌ Avoid chasing — wait for confirmation candle
🚀 Final Thoughts
✔ Classic falling wedge breakout after strong sell-off
✔ Defined structure with potential for trend reversal
✔ Attractive upside with 2.5:1 R/R on TP2
🔗 #RDW #NYSE #BreakoutTrade #ProfittoPath #SwingSetup #StockMarketMoves #TechnicalTrading #FallingWedge #BullishReversal #SmartTrading


