GBP-JPY Bullish Breakout! Buy!
Hello,Traders!
GBP-JPY made a strong
Bullish breakout of the
Key horizontal resistance
Level around 200.400
So we are bullish biased
And we will be expecting
A further bullish move up
Buy!
Comment and subscribe to help us grow!
Check out other forecasts below too!
Disclosure: I am part of Trade Nation's Influencer program and receive a monthly fee for using their TradingView charts in my analysis.
Contains image

GBP_NZD WILL GROW|LONG|
✅GBP_NZD fell down sharply
But a strong support level was hit at 2.2700
Thus as a rebound is already happening
A move up towards the target of 2.2900 shall follow
LONG🚀
✅Like and subscribe to never miss a new idea!✅

EUR-NZD Will Go UP! Buy!
Hello,Traders!
EUR-NZD is making a rebound
From the wide horizontal
Support area around 1.9690
And as we are locally bullish
Biased we think that a further
Bullish move up is likely to happen
Buy!
Comment and subscribe to help us grow!
Check out other forecasts below too!
Disclosure: I am part of Trade Nation's Influencer program and receive a monthly fee for using their TradingView charts in my analysis.

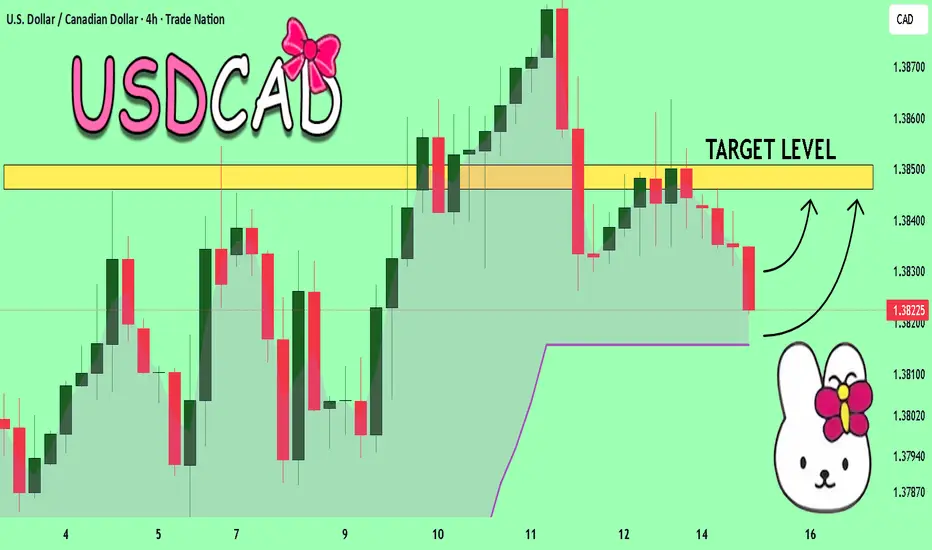
USDCAD The Target Is UP! BUY!
My dear subscribers,
This is my opinion on the USDCAD next move:
The instrument tests an important psychological level 1.3824
Bias - Bullish
Technical Indicators: Supper Trend gives a precise Bullish signal, while Pivot Point HL predicts price changes and potential reversals in the market.
Target - 1.3846
About Used Indicators:
On the subsequent day, trading above the pivot point is thought to indicate ongoing bullish sentiment, while trading below the pivot point indicates bearish sentiment.
Disclosure: I am part of Trade Nation's Influencer program and receive a monthly fee for using their TradingView charts in my analysis.
———————————
WISH YOU ALL LUCK
GBP_USD BULLISH BREAKOUT|LONG|
✅GBP_USD is going up
Now and the pair made a bullish
Breakout of the key horizontal
Level of 1.3594 and the breakout
Is confirmed so we are bullish
Biased and we will be expecting
A further bullish move up
LONG🚀
✅Like and subscribe to never miss a new idea!✅

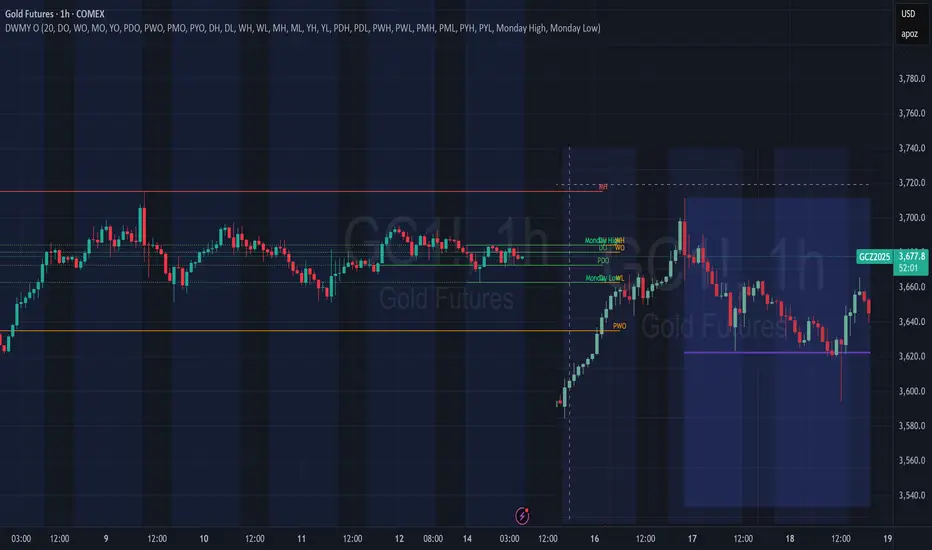
Gold Range ConditionsSome what similar pattern to one in February that was started last week on 9 Sept with a bearish engulfing hourly, 4 hour, 8 hour, and 12 hour that set near term resistance. The range during Feb lasted 17 days with a total of -3.45 toward the end with a fake out to the downside, that eventually broke upward toward the end of the month.
EUR-USD Resistance Ahead! Sell!
Hello,Traders!
EUR-USD went up from the
Rising support just as
I predicted in my previous
Analysis but now the pair
Is about to retest a
Horizontal resistance
Of 1.1788 and as it is a
Strong key level I will be
Expecting a local
Bearish correction
Sell!
Comment and subscribe to help us grow!
Check out other forecasts below too!
Disclosure: I am part of Trade Nation's Influencer program and receive a monthly fee for using their TradingView charts in my analysis.

NASDAQ INDEX (US100): To the New Highs!
US100 index successfully broke and closed above a major
daily resistance cluster on Friday.
The index will likely grow more and reach new highs soon.
The next resistance is 24300
❤️Please, support my work with like, thank you!❤️
I am part of Trade Nation's Influencer program and receive a monthly fee for using their TradingView charts in my analysis.

NZDJPY — Demand respected; ride trendChronex | NZDJPY - Bullish - Conviction - Med | Fresh higher high; buy the base
Structure: Bullish
Market Phase: Bullish
Orderflow: Bullish
Entry Model: Chain

The altseason will begin!!!The price will drop to the 0.618 Fibonacci level, then pump to 117K. If Bitcoin holds the 113K support, the altseason will begin.

Breakout Done.WAFI
CMP 192.89 (15-09-2025)
Breakout Done.
However, 186 - 195 is an Important
Resistance Zone that needs to sustain
for further upside targets.
Crossing 203 - 205 with Good Volumes may
result in upside move towards 240 - 250.
On the flip side, Immediate Support lies around
185 - 187 & then around 170 - 176.
It should not break 165 now.

BTC Market ShiftBitcoin has just printed a new high at 122K USD.
Now, price action looks set to plunge and sweep imbalance toward the 105K zone before momentum decides its next leg.
Liquidity grab or deeper correction? Eyes on 105K. 👀
follow for more insights on etc market

Where Is ETH Going This Cycle? (Educational Perspective)
Every cycle brings the same question:
Where is Ethereum heading next? Most look for price guesses, but that’s a distraction. The real advantage comes from knowing what factors will drive ETH’s direction. Understanding the drivers doesn’t require prediction, it requires planning.
A Look Back: ETH in Previous Cycles
Ethereum has repeatedly proven its resilience and innovation leadership:
2016–2017: Breakout fueled by ICO boom—ETH became the token-launch backbone.
2018–2019: Bear market and ICO collapse—but builders persisted.
2020–2021: DeFi and NFT surge—Ethereum powered the blockchain economy as “digital oil.”
2022–2023: Post-Merge era—transition to PoS and reduced issuance amid regulatory uncertainty.
Through every phase, ETH stayed central to crypto’s evolution.
On-Chain Metrics to Watch
Ethereum’s transparency lets us monitor structural strength in real time:
Active addresses gauge real network use.
Staking levels shrink available supply—over 35M ETH (≈30%) staked by mid-2025.
ETH locked in DeFi reflects collateral demand.
Gas fee burn continues to tighten supply post-EIP-1559.
Macro & Narrative Drivers (2024–2025 Upgrades & ETF Momentum)
Stories move markets, and Ethereum has some strong ones now:
Spot ETH ETF Launch: Nearly $500M in institutional inflows since mid-2024.
Staking Supply Constraint: Record ETH locked → tighter supply.
Technical Enhancements: Dencun (2024) and Pectra (2025) improving scalability and validator usability.
Regulatory & Macro Tailwinds: GENIUS Act, institutional adoption, favorable policies.
The Real Question Traders Should Ask
Price targets are clickbait. The real question is:
“Which factors will move ETH this cycle?”
By tracking ETF flows, staking ratios, upgrades, and macro conditions, traders avoid being surprised.

XAUUSD | London Plan | SEP 15, 2025In technical analysis, maintaining the right order of priority is crucial to avoid information noise:
1️⃣Main Trend
The overall trend remains bullish. The supporting trendline from last week is still intact, showing that buyers are in control.
2️⃣ Key Price Zones
-PW VAH: 3654
-PW POC: 3645
-PW VAL: 3633
Price is currently hovering around the POC 3645, which also aligns with the trendline. This is an important zone to monitor for reactions.
3️⃣ Price Action
During the Asian session, price tested the PW VAL zone at 3632–3635 and bounced upward, confirming strong support. Currently, price is retesting the POC, with potential to break and retest for continuation to the upside.
4️⃣ Candlestick Patterns
Candles forming around the trendline and POC indicate strong buying absorption and rejection of downside moves, providing favorable signals for the bullish scenario.
5️⃣ Trading Plan
- Buy 3643–3646: when price breaks above POC and retests.
- Buy 3632–3635: at PW VAL, where the Asian session bounce already confirmed buying pressure.
Target: 3665 – 3675.
Signals. Discipline. Profits
👉 If you find this analysis useful, don’t forget to hit like 👍 and drop a comment 💬 to support us in delivering even better insights!


WEEKLY UPDATE ON BTC, ETH, BTC.D - 9/7/2025This weekend's technical analysis is an update from previous week's analysis posted. I am expecting BTC to continue it's price action to the daily 200 EMA after the relief bounce off from the weekly 21 EMA as noted last week. Our BTC analysis will be invalidated if the on the daily chart we get a candle open and close above $114k on good volume and momentum as the weekly and monthly chart is still in a strong uptrend.
ETH pullback is also intact as discussed from last week and approaching the breakout price level of $4000 which coincides with the weekly 9EMA support zone. I will be expecting ETH bulls to battle this level in a consolidation price action before a break down to the weekly 21 EMA target of 3,500.
Bitcoin Dominance did follow through our analysis last week with the inverted hammer play and has now also given some confirmation of a temporal reversal based on indicators. I will be expecting a bounce on Bitcoin Dominance to the resistance level of 59.2% and if there enough momentum to break through the resistance then next target will be 60.64%.
That's a summary of what I will be looking for on these charts as the week unfolds. Thanks for spending time to listen to my analysis and opinion and I wish you the best of trading this week. Cheers !!!

Gold Holds Above $3,640, Market Awaits Fresh Catalysts📊 Market Movement:
Gold is trading around $3,644/oz, consolidating in a narrow range after recent volatility. Investors remain cautious ahead of key Fed signals and U.S. economic data this week. A pause in the USD and U.S. bond yields is helping gold maintain crucial support.
📈 Technical Analysis:
• Near support: $3,638 – $3,632 (H1 EMA20 + Asian session low).
• Strong support: $3,620 (multiple tested lows).
• Near resistance: $3,650 – $3,655 (Asian session high).
• Strong resistance: $3,668 – $3,672 (H4 EMA50 + strong supply zone).
• RSI on H1 remains above 50, showing mild bullish momentum.
🤔 Outlook:
Gold is trading sideways within $3,638 – $3,655. A breakout above $3,655 may open the way to $3,670. Conversely, a breakdown below $3,632 could trigger a decline toward $3,620. The short-term trend remains in consolidation, awaiting a breakout signal.
🎯 Trading Strategy:
SELL XAU/USD: $3,655 – $3,658
🎯 TP: 40 / 80 / 200 pips
❌ SL: $3661
BUY XAU/USD: $3,638 – $3,635
🎯 TP: 40 / 80 / 200 pips
❌ SL: $3632

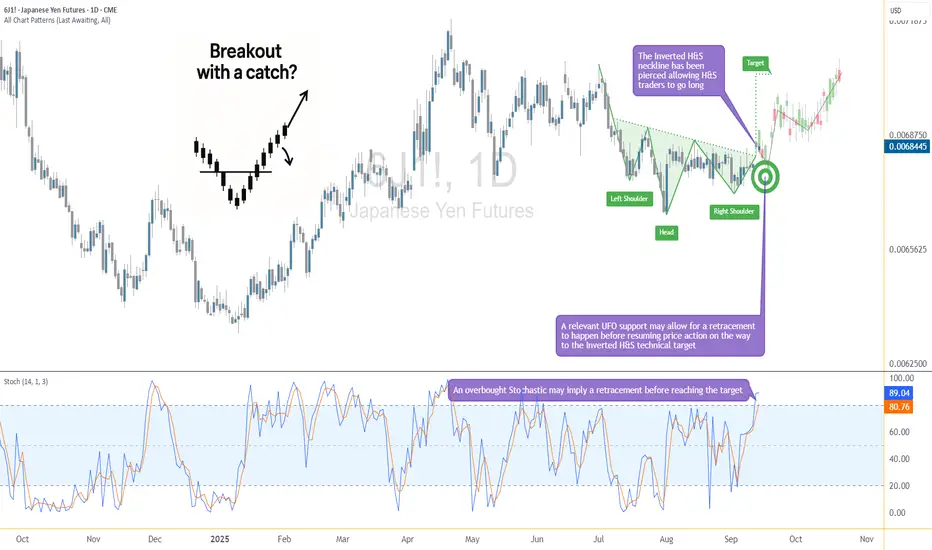
Breakout with a Catch: The Yen May Dip Before Lifting Off AgainThe Japanese Yen Futures (6J) have just pierced above a critical neckline at 0.0068220, completing an Inverted Head and Shoulders formation. This classical reversal pattern often signals a potential shift in momentum from bearish to bullish. Based on technical projections, the measured move points toward a target near 0.0070430, which lies significantly higher from current price levels.
Yet, there’s a catch. The Stochastic Oscillator has entered overbought territory, hinting that before the next upward leg develops, a retracement could occur. This makes the current setup particularly interesting, as the neckline breakout is bullish, but timing entries becomes crucial to avoid getting caught in a short-term dip.
Understanding the Inverted Head & Shoulders
The Inverted Head and Shoulders is one of the most recognized reversal patterns in technical analysis. It typically forms after a prolonged decline and suggests that bearish momentum is losing steam.
The structure consists of three parts:
Left Shoulder: the first swing low, followed by a rebound
Head: a deeper low, which marks the exhaustion of sellers
Right Shoulder: a higher low, indicating buyers are stepping in earlier
Neckline: the resistance level connecting the highs of the shoulders, acting as the trigger point
Once price pierces above the neckline, the pattern is considered complete. Traders often project the distance from the head to the neckline and extend it upward to identify a potential price objective. In this case, the neckline break projects a target near 0.0070430.
The reliability of this formation lies in its ability to signal a shift in trend sentiment. While no pattern is flawless, the inverted H&S is widely respected for its potential consistency.
The Role of Stochastic in This Setup
While the breakout above the neckline looks promising, momentum indicators suggest caution. The Stochastic Oscillator, a tool designed to measure overbought and oversold conditions, is currently flashing an overbought reading.
This does not necessarily mean that prices must reverse, but it does imply that the bullish move could pause or correct before resuming. In practical terms, traders might expect a short-term retracement as buying pressure temporarily exhausts itself.
Such pullbacks can be constructive within a broader bullish setup, especially if they occur near significant areas of support. By aligning the breakout pattern with Stochastic signals, traders can time their entries with more precision instead of chasing the market at stretched levels.
Support Zone & Safety Net
One of the strongest features of this setup is the presence of a relevant support area just below the neckline breakout level. This zone, also reinforced by a previously identified UFO support, could serve as a launching pad if prices retrace lower in the short term.
If 6J dips back toward the neckline, traders will be watching whether this level holds. A bounce from here would not only validate the breakout but also offer an attractive risk-to-reward setup. To manage downside exposure, a protective stop can be placed at 0.0067350, positioned below this key support zone.
This structure creates a layered safety net: first the neckline, then the underlying support, and finally the stop loss—offering multiple defenses against unfavorable moves before the bullish scenario invalidates.
Contract Specs & Margins (6J & MJY)
CME offers both the standard Japanese Yen Futures (6J) and the smaller-sized Micro JPY/USD Futures (MJY), giving traders flexibility depending on capital requirements and position sizing needs.
🟢 6J – Japanese Yen Futures
Contract size: ¥12,500,000
Minimum tick: 0.0000005 = $6.25
Initial margin: ≈ $3,100 (subject to CME updates)
🟢 MJY – Micro JPY/USD Futures
Contract size: ¥1,250,000 (1/10th of standard)
Minimum tick: 0.000001 = $1.25
Initial margin: ≈ $310 (subject to CME updates)
The Micro contracts replicate the price behavior of the standard Yen futures at a fraction of the size. This makes them attractive for traders who want to fine-tune risk exposure, scale in or out more precisely, or manage positions with smaller capital outlays.
Trade Plan Example
A structured trade idea can help frame the opportunity while managing risk effectively:
Direction: Long
Entry: Near 0.0068220 (neckline breakout level), or after a retracement toward support
Stop: 0.0067350 (below the support zone)
Target: 0.0070430 (measured objective from the inverted H&S)
Reward-to-Risk Calculation:
Potential reward = 0.0070430 – 0.0068220 = 0.0002210
Potential risk = 0.0068220 – 0.0067350 = 0.0000870
Approximate ratio = 2.5 : 1
This ratio is favorable, suggesting that the upside potential outweighs the defined downside exposure. Traders considering this setup may prefer to wait for a retracement toward support, which could enhance entry quality and improve the reward-to-risk profile even further.
The Importance of Risk Management
Even the most compelling technical setups require disciplined risk management. Using stop-loss orders is essential to protect capital against unexpected market swings, particularly in leveraged products like futures.
Position sizing is another key element—adjusting contract size to account size ensures that a single trade does not overexpose the portfolio. Micro contracts, such as MJY, are especially useful for traders looking to scale positions with precision.
Equally important is the principle of avoiding undefined risk. Every trade should have a clearly defined exit strategy, both for profits and losses. By knowing where to enter, where to exit, and where to cut losses, traders reduce emotional decision-making and maintain consistency.
Finally, patience plays a role. Waiting for a retracement into support rather than chasing a stretched market often improves entry quality, lowers risk, and increases the probability of success.
Conclusion
Japanese Yen Futures are showing signs of a potential trend shift as the inverted head and shoulders formation breaks above its neckline. The measured move points toward higher ground, but the overbought Stochastic warns that the path may not be in a straight line. A temporary dip into support could provide a second chance for bulls to position themselves with a favorable risk-to-reward profile.
By combining pattern recognition, momentum analysis, and precise trade planning, this setup highlights how technical structure and disciplined execution can align to create opportunity. Whether trading the standard 6J contract or the smaller MJY, the key remains the same: respect risk, trust the setup, and let the market confirm the move.
When charting futures, the data provided could be delayed. Traders working with the ticker symbols discussed in this idea may prefer to use CME Group real-time data plan on TradingView: www.tradingview.com - This consideration is particularly important for shorter-term traders, whereas it may be less critical for those focused on longer-term trading strategies.
General Disclaimer:
The trade ideas presented herein are solely for illustrative purposes forming a part of a case study intended to demonstrate key principles in risk management within the context of the specific market scenarios discussed. These ideas are not to be interpreted as investment recommendations or financial advice. They do not endorse or promote any specific trading strategies, financial products, or services. The information provided is based on data believed to be reliable; however, its accuracy or completeness cannot be guaranteed. Trading in financial markets involves risks, including the potential loss of principal. Each individual should conduct their own research and consult with professional financial advisors before making any investment decisions. The author or publisher of this content bears no responsibility for any actions taken based on the information provided or for any resultant financial or other losses.
NZDCAD: Move Up Confirmed?! 🇳🇿🇨🇦
Another intraday bullish confirmation that I spotted today is on NZDCAD pair:
the price violated both a neckline of an inverted head and shoulders pattern
and a resistance line of a bullish flag pattern on an hourly time frame.
I expect a rise at least to 0.8265 level now.
❤️Please, support my work with like, thank you!❤️
I am part of Trade Nation's Influencer program and receive a monthly fee for using their TradingView charts in my analysis.

XAUUSD KEY ZONE AND MARKET ANALYSIS | SEP.15 ☄️ Gold Market Outlook 9/5 (Based on SMC) ☄️
📊 Market Structure (H1/H4 perspective)
🔤Recent price action shows multiple CHoCH and BOS signals, confirming strong liquidity sweeps both directions.
🔤Sellers defended the FVG supply zone at 3655–3660, pushing price down.
🔤Buyers stepped in strongly from the demand zone 3630–3635, which aligns with BOS + liquidity grab.
🔤Current price is trading around 3645, sitting between supply above and demand below.
💡 Trading Scenarios
🔼Scenario 1 – Buy Setup
Condition: Price retests 3630–3635 demand zone.
Reason: Strong BOS + liquidity grab confirming buy-side interest.
Entry: Around 3632–3635.
🔽Scenario 2 – Sell Setup
Condition: Price taps into 3655–3660 supply FVG and shows rejection.
Reason: Prior strong sell-off from this area; liquidity resting above.
Entry: 3655–3658.
📌 Whichever side breaks (BOS confirmation) will set the new trend direction.
#XAUUSD

Lingrid | GOLD Weekly Market Analysis - FOMC Catalyst AheadThe price perfectly fulfilled my previous weekly idea . OANDA:XAUUSD maintained its upward trajectory this week as investors positioned ahead of anticipated dovish policy shifts from major central banks, particularly the Federal Reserve. The precious metal's resilience signals growing expectations for an accommodative monetary environment that typically weakens fiat currencies and enhances gold's appeal.
Price action analysis reveals gold operating within a well-defined upward channel, with the metal successfully breaking above the triangle consolidation pattern near $3,440. The breakout of this formation, combined with bullish momentum indicators, suggests the path of least resistance remains to the upside. Key resistance now sits at the $3,700 ATH level, while the higher low structure around $3,275 provides critical support.
4H chart shows gold trading above a strategic swap zone between $2,580-$2,600, indicating institutional accumulation ahead of the Fed's rate decision. Monday's brief sell-off may occur showing profit-taking rather than a trend reversal, as buyers quickly might step in to defend these support levels.
With the Federal Reserve expected to signal a more accommodative stance, gold's fundamentals align with technical strength. The metal's ability to hold above the triangle breakout zone reinforces bullish conviction, targeting the psychological $3,700 resistance and higher levels. Any Fed dovishness should provide the catalyst for the next leg higher, potentially reaching new all-time highs as real yields decline and dollar weakness accelerates.
If this idea resonates with you or you have your own opinion, traders, hit the comments. I’m excited to read your thoughts!

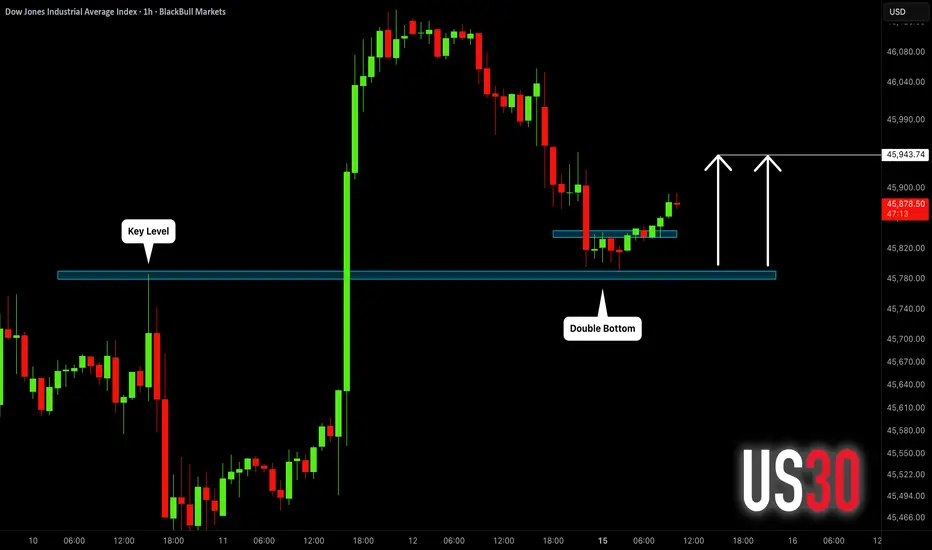
DOW JONES (US30): Pullback From Support Confirmed
Following our Friday's analysis, US30 retested a recently broken
major daily demand zone.
Testing the underlined horizontal key level, the price formed a tiny double bottom.
Its neckline breakout indicates a highly probably pullback.
Goal - 45940
❤️Please, support my work with like, thank you!❤️
I am part of Trade Nation's Influencer program and receive a monthly fee for using their TradingView charts in my analysis.
XAUUSD Looks Ready for a Big MoveHey everyone, Ken here!
Looking at the XAUUSD chart today, I see a lot of interesting things. The price isn’t rushing upward, but moving step by step – almost like buyers are slowly taking control.
Personally, I won’t jump in just yet. I’d like to see a clear rejection first. If that scenario plays out, my target would be around 3,683 .
What really matters here isn’t just the number, but patience. I’ll wait for price to return to the marked level, then watch volume and candlestick patterns for confirmation.
What about you? Do you think this setup makes sense? Share your thoughts in the comments!
