Setting the Bar Higher: $129,812 First, But $138,888 in SightSetting the Bar Higher: $129,812 First, But $138,888 in Sight 🎯📈
Bitcoin just posted two new All-Time Highs in a week, followed by a modest 3% pullback . In past cycles, that kind of drop would be minor.
But today, it feels different — because it is.
We’re in the part of the cycle where dips are fuel, not fear.
Much like Armand “Mondo” Duplantis , Bitcoin doesn’t launch with everything it’s got.
It clears bars intentionally — just enough to break records and keep the momentum flowing.
When Duplantis needs a bigger pole, it’s because he’s moving faster than expected.
Sound familiar?
🔹 Next technical bar: $129,812 (0.618 Fib)
🔹 Real target: $138,888 — where the vault gets serious
🔹 Momentum intact, shorts wrecked, runway loaded. Again. 🚀
“Off the runway... (got a bigger pole)” 🔄⏫
Translation? The next jump isn’t just coming. It’s being engineered.
Perspective Shift 🔄
“Sometimes it’s not about how high you go — but how consistently you clear new heights. Bitcoin isn’t rushing ATHs. It’s pacing them with precision. ”
Disclaimer: These charts and analyses reflect my personal opinion only. I am not a financial advisor. Nothing here is financial advice. Trading involves risk, and you are fully responsible for your own decisions. Trade wisely, develop wisdom and remember to have FUN!.
One Love,
The FXPROFESSOR 💙
Contains image

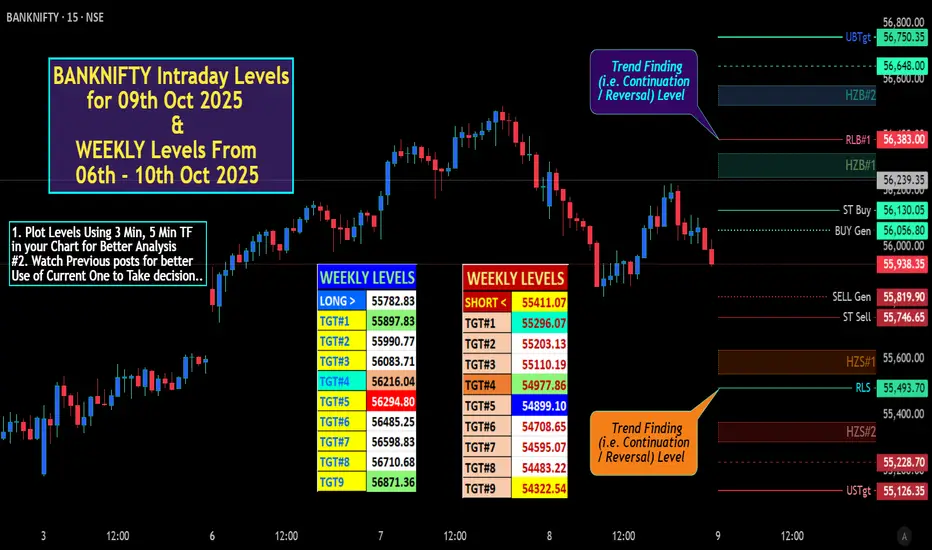
BANKNIFTY Intraday & Swing Levels for 09th Oct 2025BANKNIFTY Intraday & Swing Levels for 09th Oct 2025
# "WEEKLY Levels" mentioned in BOX format.
^^^^^^^ Plot Levels Using 3 Min, 5 Min Time frame in your Chart for Better Analysis ^^^^^^^
L#1: If the candle crossed & stays above the “Buy Gen”, it is treated / considered as Bullish bias.
L#2: Possibility / Probability of REVERSAL near RLB#1 & UBTgt
L#3: If the candle stays above “Sell Gen” but below “Buy Gen”, it is treated / considered as Sidewise. Aggressive Traders can take Long position near “Sell Gen” either retesting or crossed from Below & vice-versa i.e. can take Short position near “Buy Gen” either retesting or crossed downward from Above.
L#4: If the candle crossed & stays below the “Sell Gen”, it is treated / considered a Bearish bias.
L#5: Possibility / Probability of REVERSAL near RLS#1 & USTgt
HZB (Buy side) & HZS (Sell side) => Hurdle Zone,
*** Specialty of “HZB#1, HZB#2 HZS#1 & HZS#2” is Sidewise (behaviour in Nature)
Rest Plotted and Mentioned on Chart
Color code Used:
Green =. Positive bias.
Red =. Negative bias.
RED in Between Green means Trend Finder / Momentum Change
/ CYCLE Change and Vice Versa.
Notice One thing: HOW LEVELS are Working.
Use any Momentum Indicator / Oscillator or as you "USED to" to Take entry.
⚠️ DISCLAIMER:
The information, views, and ideas shared here are purely for educational and informational purposes only. They are not intended as investment advice or a recommendation to buy, sell, or hold any financial instruments. I am not a SEBI-registered financial adviser.
Trading and investing in the stock market involves risk, and you should do your own research and analysis. You are solely responsible for any decisions made based on this research.
"As HARD EARNED MONEY IS YOUR's, So DECISION SHOULD HAVE TO BE YOUR's".
Do comment if Helpful .
In depth Analysis will be added later
BITCOINCRYPTOCAP:BTC is currently trading in a rising wedge, a classic bearish reversal pattern. Not too concerned though, as Bitcoin has historically invalidated multiple rising wedges before. Target sits around $169K if momentum continues to hold strong.

SOL Chaser?🧩 Every candle is another clue in the ever-changing puzzle.
🔥 CRYPTOCAP:SOL continues to ride hot narratives—first memecoins, now tokenized stocks. Momentum never sleeps.
💵 SOL/USD:
Flipped key resistance into support.
March 2024 ATH at $210 now acting as a floor, with a retest on the horizon.
Current resistance sits near $228.
📌 Game Plan:
No adds yet. Waiting for that $200–$195 demand zone, a cluster of swing highs, swing lows, and weekly closes. That’s where the real decision point lies.
🚨 Until then, patience. The next big move will be built on these levels.

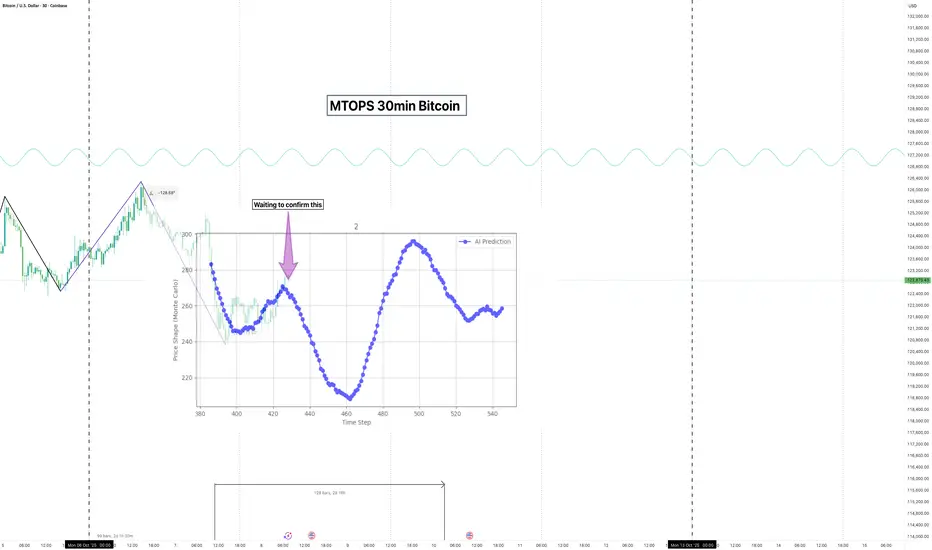
AI FORECAST OUT - waiting on confirmation the base model seems to be on fire, with 5 out of 5 forecasts correct
I am putting this one out early should we get ahead of the curve
As always, keep your trade sizes responsible if following these calls
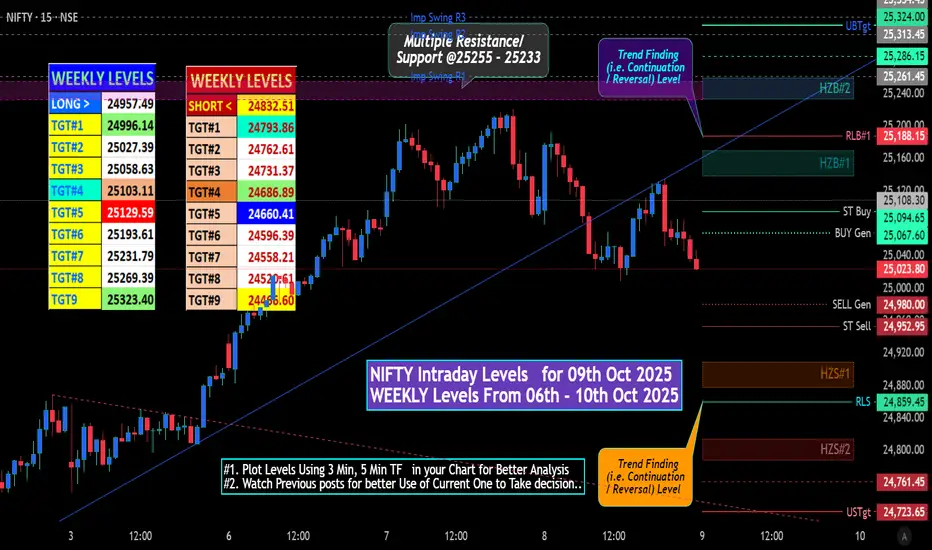
NIFTY Intraday Levels for 09th Oct 2025NIFTY Intraday Levels for 09th Oct 2025
# "WEEKLY Levels" mentioned in BOX format.
^^^^^^^ Plot Levels Using 3 Min, 5 Min Time frame in your Chart for Better Analysis ^^^^^^^
L#1: If the candle crossed & stays above the “Buy Gen”, it is treated / considered as Bullish bias.
L#2: Possibility / Probability of REVERSAL near RLB#1 & UBTgt
L#3: If the candle stays above “Sell Gen” but below “Buy Gen”, it is treated / considered as Sidewise. Aggressive Traders can take Long position near “Sell Gen” either retesting or crossed from Below & vice-versa i.e. can take Short position near “Buy Gen” either retesting or crossed downward from Above.
L#4: If the candle crossed & stays below the “Sell Gen”, it is treated / considered a Bearish bias.
L#5: Possibility / Probability of REVERSAL near RLS#1 & USTgt
HZB (Buy side) & HZS (Sell side) => Hurdle Zone,
*** Specialty of “HZB#1, HZB#2 HZS#1 & HZS#2” is Sidewise (behaviour in Nature)
Rest Plotted and Mentioned on Chart
Color code Used:
Green =. Positive bias.
Red =. Negative bias.
RED in Between Green means Trend Finder / Momentum Change
/ CYCLE Change and Vice Versa.
Notice One thing: HOW LEVELS are Working.
Use any Momentum Indicator / Oscillator or as you "USED to" to Take entry.
⚠️ DISCLAIMER:
The information, views, and ideas shared here are purely for educational and informational purposes only. They are not intended as investment advice or a recommendation to buy, sell, or hold any financial instruments. I am not a SEBI-registered financial adviser.
Trading and investing in the stock market involves risk, and you should do your own research and analysis. You are solely responsible for any decisions made based on this research.
"As HARD EARNED MONEY IS YOUR's, So DECISION SHOULD HAVE TO BE YOUR's".
Do comment if Helpful .
In depth Analysis will be added later
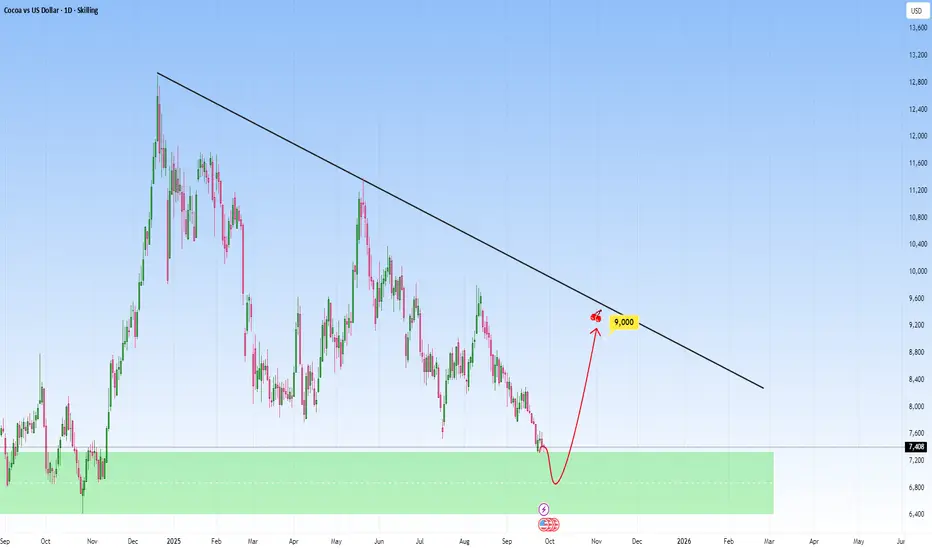
COCOA: Meets Strong SupportCocoa has been decreasing strongly, with sellers driving the market lower in a clear bearish run. However, price has now reached a strong support zone, an area where buyers previously stepped in with conviction. This zone will be critical to watch: if sellers lose momentum here and buyers defend the level, it could trigger a bullish reaction and the start of a corrective leg upward.
If rejection confirms, that becomes your signal anticipating buyers to take control and push price back toward higher levels. I would anticipate price can climb around 9000.
id10t error on my previous forecast. I was TOO ZOOMED INBeta testing is a teacher. And it taught me to remember the fundamentals when I use this amazing tech
In this instance I was way too zoomed in.
When correcting the market cycle size on my screen, I got to see the forecast that came out on the 6 October was fire. Yup, it showed us that this $5000 drop was coming in.
It's hard to be human lol

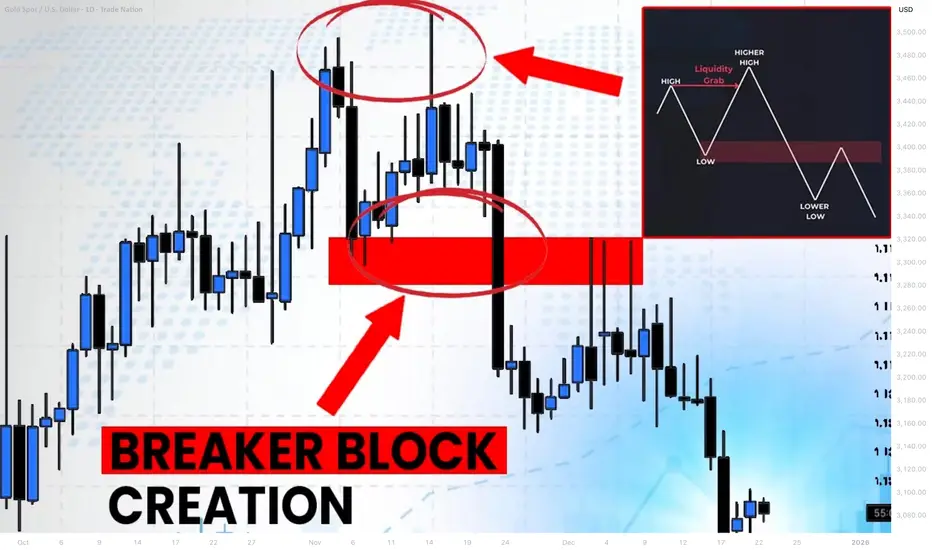
What is Bullish/Bearish Breaker Block & How to Find It Easily
Breaker blocks are easier to find than you think.
In this article, I will share with you very efficient price models for the identification of Order Blocks and Breaker Blocks.
You will learn their meaning, how to draw and use them in trading Smart Money Concepts SMC.
Bullish Trend Model & Breaker Block.
Let's start with an essential theory .
Please, examine a following price model:
In a classic bullish structure where the price consistently updates Higher Highs HH and Higher Lows HH, a bullish order block zone will be the area based on the last Higher How.
I will explain how to draw that zone in the examples below.
In some instances, a bullish order block zone will fail to deliver a bullish wave. Its bearish breakout will follow after its test instead.
It will be a critical event that is called a market structure shift in Smart Money Concepts SMC.
A formation of a new low will signify a violation of a bullish trend and a highly probable change of the market sentiment.
A broken bullish order block zone will turn into a Bearish Breaker Block.
The zone from where the next bearish wave will most likely follow.
It will provide a very safe place to sell from.
Market structure shift in a bullish trend is not a random event.
It usually occurs after a test of a significant supply zone with a liquidity grab.
It can help you to predict the change of the sentiment way before it happens.
That's an example of such a price model on GBPAUD forex pair.
We see a confirmed bullish liquidity sweep in uptrend after a test of a historic supply zone.
A bearish wave followed then and a bullish order block zone was broken.
To draw Order Block Zone, I picked the level of the last higher low as its lower boundary and a low of a body of that candlestick as the upper boundary.
After a breakout, it turned into a Bearish Breaker Block.
A bearish continuation occurred after its test.
Bearish Trend Model & Breaker Block.
Please, check this model:
In a classic bearish structure where the price consistently updates Lower Lows LL and Lower Highs LH, a bearish order block zone will be the area based on the last Lower High.
In some instances, a bearish order block zone will fail to deliver a bearish wave. Its bullish breakout will follow after its test instead.
It will be a significant event that is called a bullish market structure shift in Smart Money Concepts SMC.
A formation of a new high will signify a violation of a bearish trend and a highly probable change of the market sentiment.
A broken bearish order block zone will turn into a Bullish Breaker Block.
The zone from where the next bullish wave will most likely follow.
It will provide a very safe place to buy from.
Market structure shift in a bearish trend is not a random event.
It usually occurs after a test of a significant demand zone with a liquidity grab.
That's a real example of such a price model on WTI Crude Oil.
A bearish structure was violated after a test of a demand zone.
A bearish order block was broken, and it turned into a Bullish Breaker Block Zone then.
(Drawing a bullish order block zone, I picked the level of the last lower high as its upper boundary and a high of a body of that candle as its lower boundary )
A bullish movement followed after a deep test of that.
A proper combination of structure mapping and liquidity analysis will help you to predict a market structure shirt and a breaker block creation before they happen.
The models that I shared will help you to confirm bullish and bearish breaker blocks trading Forex or any other markets with Smart Money Concepts SMC ICT.
❤️Please, support my work with like, thank you!❤️
I am part of Trade Nation's Influencer program and receive a monthly fee for using their TradingView charts in my analysis.
EURGBP - strong sellers are putting pressure on the market Inability to continue the uptrend. The price faces resistance at 0.8752 and breaks the support of the ascending triangle, which indicates buyer weakness.
A close below 0.8674 will confirm the breakdown of the structure and may increase pressure on the price, which in turn will lead to a decline.
The current distribution may target two support zones: 0.8634, 0.861

US Dollar: Wait For The +BOS, Then Buy It!Welcome back to the Weekly Forex Forecast for the week of Oct 6 - 10th.
In this video, we will analyze the following FX market: USD Dollar
The USD is technically still bearish, trying to find support for higher prices. A US government shutdown is not helping that case! However, personally, I am still looking toward the upside.
Price is still holding at a bullish discount array, an +OB. As long as the +OB is respected, I am looking for higher prices.
A bearish BOS will make looking for higher prices invalid.
So, let the market show its bias before entering a trade. Look for the confirmations to its direction.
Don't take trades inside the middle of consolidations!
Wait and react. Do not predict.
Enjoy!
May profits be upon you.
Leave any questions or comments in the comment section.
I appreciate any feedback from my viewers!
Disclaimer:
I do not provide personal investment advice and I am not a qualified licensed investment advisor.
All information found here, including any ideas, opinions, views, predictions, forecasts, commentaries, suggestions, expressed or implied herein, are for informational, entertainment or educational purposes only and should not be construed as personal investment advice. While the information provided is believed to be accurate, it may include errors or inaccuracies.
I will not and cannot be held liable for any actions you take as a result of anything you read here.
Conduct your own due diligence, or consult a licensed financial advisor or broker before making any and all investment decisions. Any investments, trades, speculations, or decisions made on the basis of any information found on this channel, expressed or implied herein, are committed at your own risk, financial or otherwise.

NZDUSD: Bearish! Look For Valid Sell Setups!Welcome back to the Weekly Forex Forecast for the week of Oct. 6 - 10th
In this video, we will analyze the following FX market: NZDUSD
NZDUSD made a very impulsive bearish move, and spent last week retracing to the -FVG.
Now, the expectation is price will potentially begin the next bearish impulse.
Wait for a bearish BOS, and sell the pullback on the LTFs.
Enjoy!
May profits be upon you.
Leave any questions or comments in the comment section.
I appreciate any feedback from my viewers!
Like and/or subscribe if you want more accurate analysis.
Thank you so much!
Disclaimer:
I do not provide personal investment advice and I am not a qualified licensed investment advisor.
All information found here, including any ideas, opinions, views, predictions, forecasts, commentaries, suggestions, expressed or implied herein, are for informational, entertainment or educational purposes only and should not be construed as personal investment advice. While the information provided is believed to be accurate, it may include errors or inaccuracies.
I will not and cannot be held liable for any actions you take as a result of anything you read here.
Conduct your own due diligence, or consult a licensed financial advisor or broker before making any and all investment decisions. Any investments, trades, speculations, or decisions made on the basis of any information found on this channel, expressed or implied herein, are committed at your own risk, financial or otherwise.

USOIL SENDS CLEAR BEARISH SIGNALS|SHORT
USOIL SIGNAL
Trade Direction: short
Entry Level: 62.52
Target Level: 60.15
Stop Loss: 64.10
RISK PROFILE
Risk level: medium
Suggested risk: 1%
Timeframe: 7h
Disclosure: I am part of Trade Nation's Influencer program and receive a monthly fee for using their TradingView charts in my analysis.
✅LIKE AND COMMENT MY IDEAS✅

NZD/USD BULLS ARE GAINING STRENGTH|LONG
NZD/USD SIGNAL
Trade Direction: long
Entry Level: 0.576
Target Level: 0.584
Stop Loss: 0.571
RISK PROFILE
Risk level: medium
Suggested risk: 1%
Timeframe: 9h
Disclosure: I am part of Trade Nation's Influencer program and receive a monthly fee for using their TradingView charts in my analysis.
✅LIKE AND COMMENT MY IDEAS✅

EUR/USD BUYERS WILL DOMINATE THE MARKET|LONG
Hello, Friends!
We are now examining the EUR/USD pair and we can see that the pair is going down locally while also being in a downtrend on the 1W TF. But there is also a powerful signal from the BB lower band being nearby indicating that the pair is oversold so we can go long from the support line below and a target at 1.168 level.
Disclosure: I am part of Trade Nation's Influencer program and receive a monthly fee for using their TradingView charts in my analysis.
✅LIKE AND COMMENT MY IDEAS✅

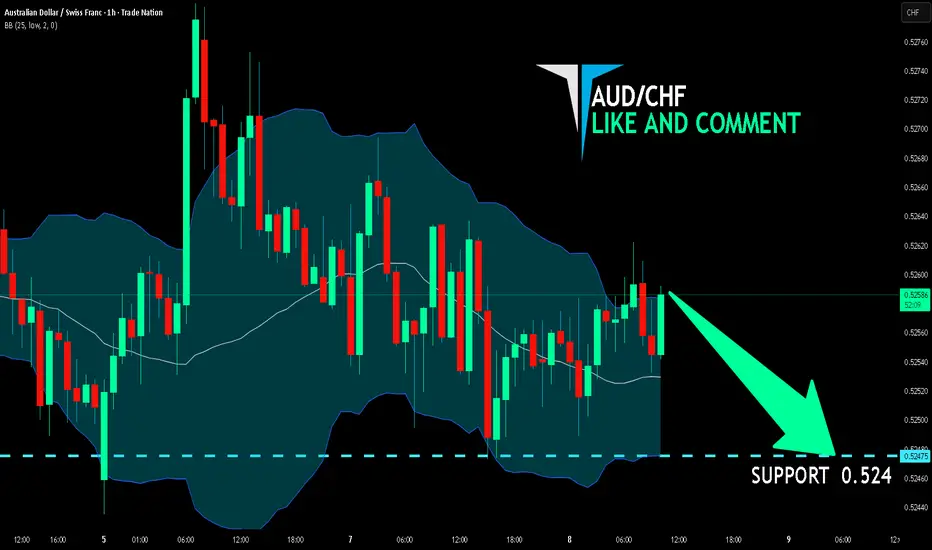
AUD/CHF BEARISH BIAS RIGHT NOW| SHORT
Hello, Friends!
It makes sense for us to go short on AUD/CHF right now from the resistance line above with the target of 0.524 because of the confluence of the two strong factors which are the general downtrend on the previous 1W candle and the overbought situation on the lower TF determined by it’s proximity to the upper BB band.
Disclosure: I am part of Trade Nation's Influencer program and receive a monthly fee for using their TradingView charts in my analysis.
✅LIKE AND COMMENT MY IDEAS✅
XAUUSD - SET UP TRADE I Oct/08/2025SET UP
🕯 BUY GOLD: 4030 – 4032
⚠️ SL: 4027
✔️ TP: 4036 → 4040 → 4044
** Gold is currently pushing too high with strong momentum. Entering FOMO buys at these levels is extremely risky, as the market may correct on the H4 timeframe, leading to unnecessary stop-loss hits.
👉 Therefore:
Stay disciplined, avoid emotional entries.
Wait for price to retrace to value zones before taking new buy positions.
Remember: Capital protection is always more important than chasing one trade.

seeing the market in layers.. "A 3PART SERIES"The Art and Science of Timeframes (Part I): Matching Timeframes to Your Trading Style
Every trader operates within a different rhythm. Some thrive on fast scalps, others on slow swings. The secret is to match your personality to the right timeframe not the other way around.
1. Scalpers (1M–15M)
Term: Short
Characteristics: Lightning-fast execution, exploiting small intraday moves.
Pros: Frequent setups, many profit opportunities.
Cons: High stress, risk of overtrading, spreads and slippage matter.
Best For: Traders who enjoy instant feedback and thrive on volatility.
MTFA Tip: Use 15M for structure, 5M for setup, 1M for entries.
2. Day Traders (15M–1H)
Term: Short to Medium
Characteristics: Combine intraday technicals with small-scale structure.
Pros: Clear daily cycles, lower overnight risk.
Cons: Requires constant attention and discipline.
Best For: Traders with time during active sessions.
MTFA Tip: Use 1H for bias, 15M for setup, 5M for execution.
3. Swing Traders (1H–4H)
Term: Medium
Characteristics: Ride waves lasting several days to weeks.
Pros: Less screen time, cleaner structure.
Cons: Exposure to weekend gaps and news spikes.
Best For: Professionals balancing trading with other commitments.
MTFA Tip: Use Daily for bias, 4H for setup, 1H for execution.
4. Position Traders (Daily–Weekly)
Term: Long
Characteristics: Focus on macro trends and fundamentals.
Pros: Larger reward potential, fewer decisions.
Cons: Patience required; drawdowns can be larger.
Best For: Investors and macro traders.
MTFA Tip: Use Weekly for trend, Daily for confirmation, 4H for entries.
The Takeaway: Timeframes as a Symphony
Think of the market as a piece of music, each timeframe a different instrument. The higher timeframe sets the melody, the mid-timeframe adds rhythm, and the lower timeframe provides texture and precision. When they play in harmony, your trades flow with the market instead of fighting it.
The Art and Science of Timeframes (Part II): The Multi-Timeframe Edge
Every price candle tells a story but no single timeframe tells the whole story. To trade with clarity instead of confusion, you need to see how the market breathes across multiple scales. That’s where Multi-Timeframe Analysis (MTFA) becomes a trader’s most powerful lens.
Most beginners lock themselves into a single chart, maybe a 15-minute or 1-hour and miss the broader context that defines the real opportunity. Professionals, on the other hand, zoom in and out like astronomers switching between telescopes, observing both the vast structure and the fine detail of price action.
Let’s break down the science behind this art.
1. Choose Your Timeframes
The key is to pick two to three timeframes that serve different purposes:
Higher Timeframe (HTF) → defines the trend and macro structure.
Mid Timeframe (MTF) → helps you spot setups and consolidation zones.
Lower Timeframe (LTF) → fine-tunes entries and exits.
Example for a swing trader:
Trend: Daily (D1)
Setup: 4H
Entry: 1H or 15M
Each timeframe acts like a different layer of resolution from the forest down to the individual leaves.
2. Analyze the Higher Timeframe (HTF)
Always begin from the top down. The higher timeframe shows the path of least resistance.
Ask:
Is price trending or ranging?
Where are the key supply/demand or support/resistance zones?
What is the dominant direction of institutional flow?
This framework prevents you from buying into resistance or shorting into demand. Remember: the HTF is the map; the LTF is the magnifying glass.
3. Study the Mid Timeframe (MTF)
This is where traders plan their battlefield. The MTF captures structure, accumulation, and distribution phases.
You might see:
Trend continuation flags
Range breakouts
Retests and confluence zones
It bridges the macro and micro perspectives. When the HTF is bullish, you look for higher-low formations or break-and-retest setups on the MTF to align with the major flow.
4. Drop to the Lower Timeframe (LTF)
The LTF is where precision lives. Here, you look for:
Candlestick confirmations
Liquidity sweeps
Minor structure breaks
But precision means little without context. Always ensure your LTF entries echo the HTF narrative. When the HTF trend and LTF setup agree, your probability improves dramatically.
5. Align All Timeframes
Confluence is your compass. If all your timeframes tell a consistent story, say, higher highs on the D1, bullish structure on the 4H, and breakout retests on the 15M, the trade idea gains strength.
If they conflict, patience is the best position. Misalignment breeds confusion, and confusion costs money.
6. Confirm with Indicators (Optional)
Multi-timeframe analysis is primarily price-action-based, but technical indicators can complement your judgment.
Think of RSI, MACD, or moving averages as secondary confirmation tools not decision-makers.
7. Plan and Execute
With all layers aligned, define your:
Entry
Stop-loss
Take-profit levels
Ensure a risk-reward ratio of at least 1:2, ideally better. Plan your trade on the MTF, execute it on the LTF, and manage it according to the HTF.
Part III : The Multi-Timeframe Breakdown
In the next last section of the publication, I’ll apply this framework to a real market showing how multiple timeframes converge to shape high-probability setups on a live chart. We’ll analyze BTCUSD class step by step from the MONTHLY map to the 4HR trigger.
remember: timeframes don’t just measure time; they reveal structure.
1MONTH CHART :
Starting off on the monthly chart, first highlighted the all time high @ 126296.00 based on the exchange i used and the supply CP represented by the orange horizontal line of proximal price @ 115,697.37 and also significant previous high @ 100,390.00 and also identified liquidity pool represented by rectangle zone ranging from @ 96429.84 to 93354.22..
WEEKLY
weekly i only added a rectangle zone which connects recent supply level and the supply cp and trendline indicating current market still having bullish momentum and daily i had no levels to mark...
4HR
4hr we found support at liquidity pool connecting recent high and low @ 121,115.33 and 121523.68 with possible shorts at 123,796.00 which is supply and also demand cp and also there is fib retracement of 61.9% and 50.0% taken from intraday high 126296.00 and low 120,636.00 with price currently reacting to the 38.2% which can cause price to drop without having to go to the supply level...
another alternative the support can hold and cause price to rise to the all time high and maybe create a new ath as shown below..
There are reasons to support both upside and downside for Bitcoin currently. What matters is weighting the signals (technical + on-chain + macro) and letting price confirm. Below I’ll lay out bullish evidence, bearish risks, and how a trader might synthesize these into a balanced view.
Bullish Evidence (Reasons Bitcoin might rise)
Record ETF and institutional inflows
Bitcoin and crypto ETFs recently attracted $5.95 billion in a week, with a large share into Bitcoin.
The rally is being underpinned by institutional demand rather than pure speculative retail flow.
Reuters
Deepening institutional participation tends to anchor support and reduce volatility (if sustained).
New all-time highs & momentum breakout
Bitcoin has pushed to new highs (above ~ USD 125,000) in recent trading days.
Price breaking past a resistance level often triggers fresh buying (breakout momentum).
Analysts see the market in a “decisive phase” after breaking above prior peaks.
Macro tailwinds / safe-haven rotation
As the U.S. dollar shows signs of pressure and economic uncertainty looms (e.g. U.S. government shutdown), investors are leaning into safe-haven / non-correlated assets like gold and Bitcoin.
Bitcoin’s narrative as “digital gold” gains more weight in such contexts.
Messaging from major banks (e.g. Deutsche Bank) that Bitcoin is approaching reserve-asset status adds psychological weight.
Barron's
Technical structure — retest and consolidation
Even though price has surged, many analysts suggest that after the breakout, Bitcoin might pause or retrace slightly (to ~ USD 118k) before continuing upward.
That kind of “breakout → retest → continuation” structure is common in strong trends.
Also, technicals show that if support levels hold, there is room for extension.
Maturing volatility trend / more stable regime
Over time, Bitcoin’s volatility (on a yearly scale) has shown a decreasing trend, which suggests the market may be maturing.
Fidelity Digital Assets
A somewhat calmer environment can attract more risk capital and reduce fear of large intraday drawdowns.
Bearish Risks / Evidence to Watch (Reasons Bitcoin might drop or pull back)
Overbought conditions / exhaustion
After such a rapid rally, markets often pause or correct. Momentum traders may already be booking profits.
Some crypto news sources refer to a loss of momentum or a slide after the recent highs.
Leverage, liquidations, and risk unwinds
Crypto markets are still sensitive to leveraged positions. A sharp reversal could trigger cascades of liquidations.
In prior sessions, large liquidations contributed to dips.
Macroeconomic policy / central bank moves
If central banks (especially the U.S. Fed) surprise markets with hawkish tone, less rate cuts, or quantitative tightening, that could strengthen the dollar and put downward pressure on crypto.
Uncertainty in fiscal policy (e.g. government shutdown) could cut toward risk-off flows.
Support breakdown / structural failure
If Bitcoin fails to hold key support zones (for instance, if the retest fails, or prior swing support is broken), it might reverse more aggressively.
Analysts warn of consolidation or retracement if momentum stalls.
Regulation / policy risk
Though not as immediate lately, regulatory shifts especially in major jurisdictions (U.S., EU, China) can swing sentiment violently.
Balanced View: What the Evidence Suggests Right Now
Given all this, one can’t confidently predict either direction with certainty but we can lean. Here’s how a well-calibrated, probability-based view might look:
Primary base case (moderately bullish): Bitcoin continues upward, but with intermittent pullbacks or consolidation phases. The recent breakout is validated by institutional flows, and the macro weather is somewhat favorable. If the retest (e.g. ~ USD 118k) holds, it could become a launchpad to new highs.
Alternate bear scenario (guarded): If the retest fails and support breaks, or macro sentiment shifts hawkish, we could see a deeper correction possibly toward older support zones.
Invalidation / risk threshold: A break and close below major structural support (on a daily / weekly chart) would weaken the bullish thesis. That becomes a warning zone.
put together by : Pako Phutietsile as @currencynerd
Beautiful HH HL.HUBC Analysis
CMP 216.60 (08-10-2025)
Beautiful HH HL.
Retest of Breakout level.
Sustaining 209 - 210 may lead it towards
240+ again.
Crossing 245 with Good Volumes may take
the price towards 270
191 should not break this time.

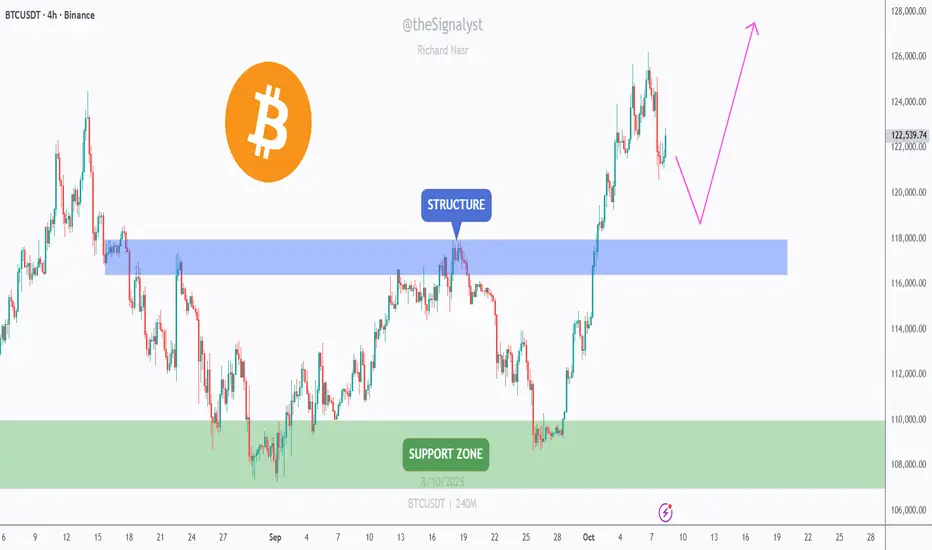
BTC – Eyeing a Retest of the $118K Structure!CRYPTOCAP:BTC broke above the $117K–$119K structure (blue zone) with strong momentum.
I’m now watching for a pullback to this area to form a higher low and resume the uptrend.
As long as price holds above $117K–$119K, I’ll look for trend-following longs toward $125K–$128K, then the $130K handle.
If the blue zone fails, the next support sits at $106K–$110K (green zone), where bulls may regroup.
⚠️ Disclaimer: This is not financial advice. Always do your own research and manage risk properly.
📚 Stick to your trading plan regarding entries, risk, and management.
Good luck! 🍀
All Strategies Are Good; If Managed Properly!
~Richard Nasr
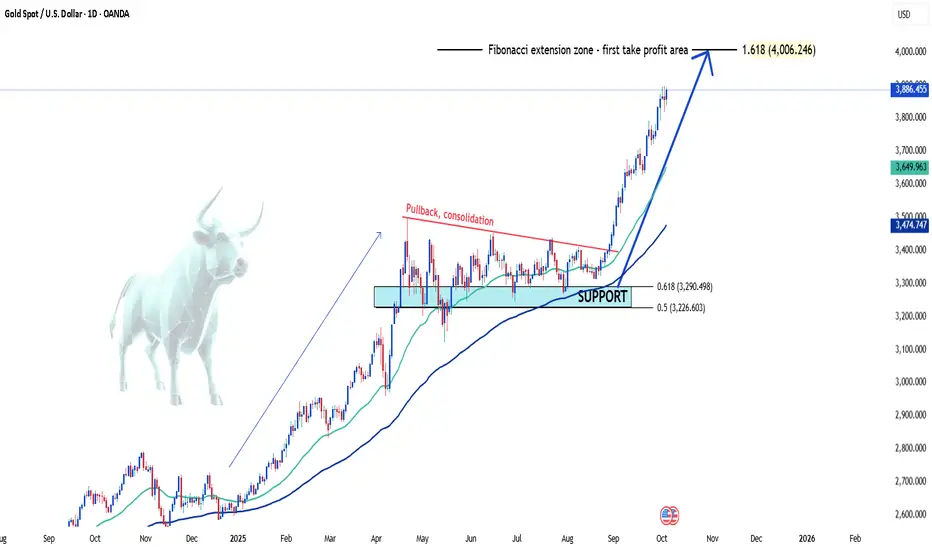
XAUUSD Continues on Its Path to Conquer Record-High Levels👋Hello everyone, what are your thoughts on the trend of OANDA:XAUUSD ?
Today, I'll provide a long-term perspective. XAUUSD has recently surged, driven by global instability, particularly the Fed's rate cuts. The risk of a U.S. government shutdown has also led investors to turn to gold as a safe haven, contributing to the significant price increase.
From a technical standpoint, gold is showing a strong bullish structure over the long term, with a clear breakout above key resistance levels. After consolidating around the Fibonacci 0.5 retracement support zone, the price has rebounded and is now heading towards the Fibonacci extension zone. This area is considered the first major take-profit target, also coinciding with the psychological level at $4,000 ( a common target for 2025 ).
With both market structure and fundamental analysis supporting the bullish outlook, I remain optimistic about both the short and long-term prospects for XAUUSD. What do you think about the XAUUSD trend? Feel free to leave your thoughts in the comments!
USDJPY: Waiting for bullish pullback signalsNews about Japan’s incoming Prime Minister has fueled expectations for more accommodative monetary policy.
* Trend: assessed using at least three trend indicators, with market structure as the primary guide.
** Weak or Reversal Signals: Assessed based on one of our criteria for trend reversal signals.
*** Support/Resistance: Selected from multiple factors – static (Swing High, Swing Low, etc.), dynamic (EMA, MA, etc.), psychological (Fibonacci, RSI, etc.) – and determined based on the trader’s discretion.
**** Our advice takes into account all factors, including both fundamental and technical analysis. It is not intended as a profit target. We hope it can serve as a reference to help you trade more effectively. This advice is for informational purposes only and we assume no responsibility for any trading results based on it.
Please like and comment below to support our traders. Your reactions will motivate us to do more analysis in the future 🙏✨
George Vann @ ZuperView

NZDCAD: Bullish Move From Trend Line 🇳🇿🇨🇦
NZDCAD may bounce from a strong falling trend line that
I spotted on a daily time frame.
As a confirmation, the price formed a double bottom
pattern on an hourly time frame and violated its neckline.
Goal - 0.8051
❤️Please, support my work with like, thank you!❤️
