EUR/CAD LONG FROM SUPPORT
Hello, Friends!
EUR/CAD pair is trading in a local uptrend which know by looking at the previous 1W candle which is green. On the 9H timeframe the pair is going down. The pair is oversold because the price is close to the lower band of the BB indicator. So we are looking to buy the pair with the lower BB line acting as support. The next target is 1.629 area.
Disclosure: I am part of Trade Nation's Influencer program and receive a monthly fee for using their TradingView charts in my analysis.
✅LIKE AND COMMENT MY IDEAS✅
Contains image

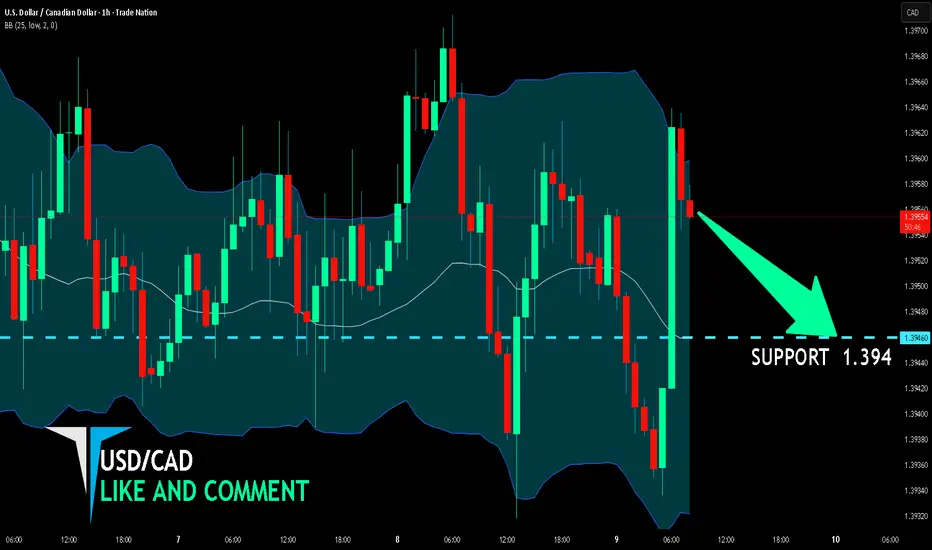
USD/CAD BEARS WILL DOMINATE THE MARKET|SHORT
Hello, Friends!
We are going short on the USD/CAD with the target of 1.394 level, because the pair is overbought and will soon hit the resistance line above. We deduced the overbought condition from the price being near to the upper BB band. However, we should use low risk here because the 1W TF is green and gives us a counter-signal.
Disclosure: I am part of Trade Nation's Influencer program and receive a monthly fee for using their TradingView charts in my analysis.
✅LIKE AND COMMENT MY IDEAS✅
GBP/AUD BEARS ARE STRONG HERE|SHORT
Hello, Friends!
We are going short on the GBP/AUD with the target of 2.029 level, because the pair is overbought and will soon hit the resistance line above. We deduced the overbought condition from the price being near to the upper BB band. However, we should use low risk here because the 1W TF is green and gives us a counter-signal.
Disclosure: I am part of Trade Nation's Influencer program and receive a monthly fee for using their TradingView charts in my analysis.
✅LIKE AND COMMENT MY IDEAS✅

GBP/NZD BULLISH BIAS RIGHT NOW| LONG
Hello, Friends!
GBP/NZD pair is trading in a local downtrend which we know by looking at the previous 1W candle which is red. On the 6H timeframe the pair is going down too. The pair is oversold because the price is close to the lower band of the BB indicator. So we are looking to buy the pair with the lower BB line acting as support. The next target is 2.323 area.
Disclosure: I am part of Trade Nation's Influencer program and receive a monthly fee for using their TradingView charts in my analysis.
✅LIKE AND COMMENT MY IDEAS✅

Gold Holds 4,010 Ahead of Powell as Shutdown Clouds CPI OutlookHey Traders,
In today’s session, we’re keeping a close eye on XAUUSD for a potential buy setup around the 4,010 zone. Gold remains in a broader uptrend, and the current pullback brings price action near a key support and trend confluence that could attract fresh buyers.
All eyes are on Fed Chair Powell’s remarks later today. With the U.S. government shutdown disrupting key economic releases, including a possible delay of next week’s CPI data, Powell’s tone could heavily influence short-term Dollar sentiment—and by extension, Gold momentum.
If Powell hints at policy caution amid data uncertainty, the safe-haven narrative could re-emerge quickly. We’ll be watching closely for a potential technical trigger to align with the macro backdrop.
Trade safe,
Joe.

XAUUSD - MARKET CONTEXT I Oct/09/20251. Market Context
• Gold is moving around 4031, just retesting the PoC zone ~4037 after a short correction.
• On the H30 timeframe, price remains in an uptrend, but there is a tug-of-war around the Liquidity zone 4020 – 4037.
• Recent macro news (partial U.S. government shutdown, weak labor data) keeps safe-haven demand intact.
2. Key Zones
• VaH / Resistance Zone H4: 4057 – 4073 → strong resistance, potential profit-taking.
• PoC Zone H1/H30: 4037 → current trading focal point.
• Liquidity Zone: 4020 – 4025 → short-term support; if broken, price may go deeper.
• Demand Zone: 3982 – 3990 → major support, protecting the long-term uptrend.
3. Trade Scenarios
🔹 Scenario 1: BUY with the trend (priority)
• Condition: Price holds above 4020 – 4030 with bullish confirmation (Pin bar, Engulfing).
• Entry: 4025 – 4035
• TP1: 4057 | TP2: 4073
• SL: below 4015
👉 Reason: Overall trend remains bullish, every dip is being bought.
🔹 Scenario 2: Short-term SELL (counter-trend)
• Condition: Price fails to break 4057 – 4073 and shows rejection (long wick, red engulfing).
• Entry: 4055 – 4065
• TP1: 4037 | TP2: 4020
• SL: above 4078
👉 Reason: 4057 – 4073 is a strong resistance (VaH H4), potential trap for buyers before correction.
🔹 Scenario 3: BUY from Demand Zone
• Condition: Price breaks 4020 and retests 3982 – 3990.
• Entry: 3985 – 3995
• TP1: 4030 | TP2: 4070
• SL: below 3970
👉 Reason: Demand Zone H4 is a strategic support; if retested, it may trigger strong buying.
4. Conclusion
• Short-term: Wait for price reaction around 4020 – 4037 to decide the next direction.
• Medium-term: Main trend is still bullish — priority on BUY at supports.
• News impact: With U.S. uncertainty and safe-haven flow, gold has upside advantage, but 4057 – 4073 remains the key test.
⚠️ Reminder: Manage risk strictly, avoid FOMO near resistance zones.

GBP/CAD SELLERS WILL DOMINATE THE MARKET|SHORT
Hello, Friends!
GBP/CAD pair is in the uptrend because previous week’s candle is green, while the price is obviously rising on the 12H timeframe. And after the retest of the resistance line above I believe we will see a move down towards the target below at 1.867 because the pair overbought due to its proximity to the upper BB band and a bearish correction is likely.
Disclosure: I am part of Trade Nation's Influencer program and receive a monthly fee for using their TradingView charts in my analysis.
✅LIKE AND COMMENT MY IDEAS✅

Lingrid | GOLD Psychological Barrier Cleared Upside IntactThe price perfectly fulfilled my previous idea . OANDA:XAUUSD continues its climb inside the upward channel, holding above the key 4,000 support after a clean rebound. Price action shows consistent higher lows supported by the upward trendline, signaling sustained bullish momentum. As long as the 4,000 level remains intact, a move toward 4,100 and potentially higher remains in play. The structure points to buyers consolidating for another extension within the ongoing trend.
⚠️ Risks:
A break below 4,000 could trigger a deeper retracement toward 3,950 support.
Rising U.S. yields or FOMC meeting may dampen gold’s momentum.
Profit-taking near psychological resistance could slow short-term upside continuation.
If this idea resonates with you or you have your own opinion, traders, hit the comments. I’m excited to read your thoughts!

USDJPY: Bull Run Continues 🇺🇸🇯🇵
USDJPY is rallying without breaks.
The price has violated a significant daily resistance cluster
and closed above that.
It opens a potential for more growth.
The next historic resistance is 154.3.
❤️Please, support my work with like, thank you!❤️
I am part of Trade Nation's Influencer program and receive a monthly fee for using their TradingView charts in my analysis.

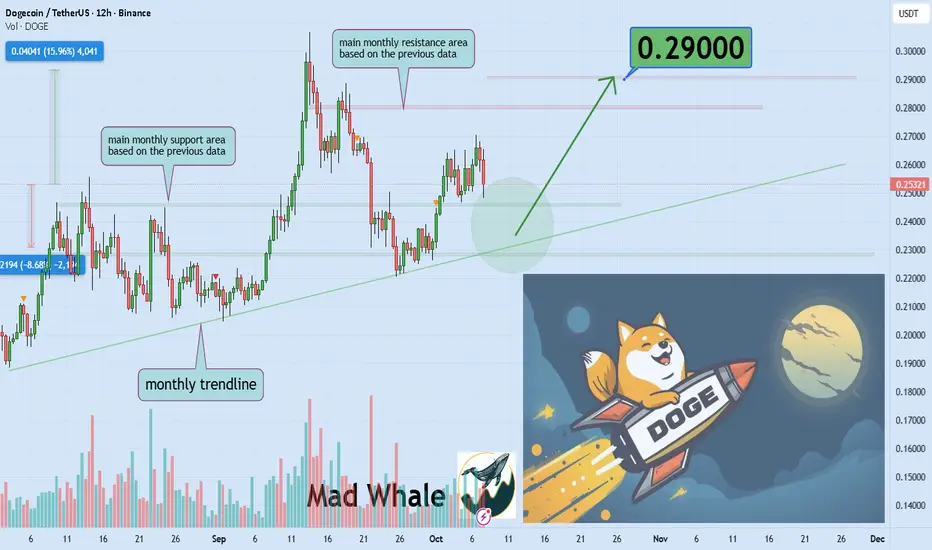
Dogecoin Approaching Key Support, 16% Gain Possible To 0.29$Hello✌️
Let’s analyze Dogecoin’s price action both technically and fundamentally 📈.
🔍Fundamental analysis:
Dogecoin (DOGE) has seen major accumulation by CleanCore Solutions, reducing supply and boosting potential demand. Pending ETF approvals could bring more legitimacy, but SEC caution on meme coins remains. 🐶📈
📊Technical analysis:
BINANCE:DOGEUSDT is trading inside its ascending channel, approaching a strong monthly trendline.
If this support level holds, the price could see a 16% rally.
Potential target for this move is around 0.29. 🚀📈
📈Using My Analysis to Open Your Position:
You can use my fundamental and technical insights along with the chart. The red and green arrows on the left help you set entry, take-profit, and stop-loss levels, serving as clear signals for your trades.⚡️ Also, please review the TradingView disclaimer carefully.🛡
✨We put love into every post!
Your support inspires us 💛 Drop a comment we’d love to hear from you! Thanks, Mad Whale
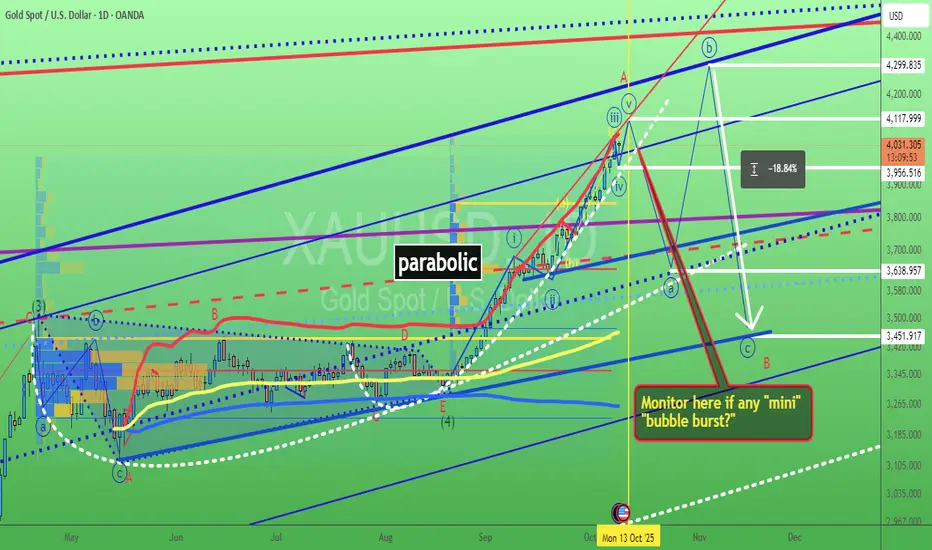
Gold waiting for its "mini" bubble burst? 9/Oct/25XAUUSD is forming another parabolic moves = the basic sign of bubble after triangle breakout. It has surged nonstop with many "mini bubble" inside big bubble So Watchout sudden small bubble burst first before surging for bigger bubble.
Dollar TVC:DXY
DXY Technical Outlook
The U.S. Dollar Index has successfully broken out of the long-term descending trendline and is showing strong bullish momentum.
Trend: Turning Bullish

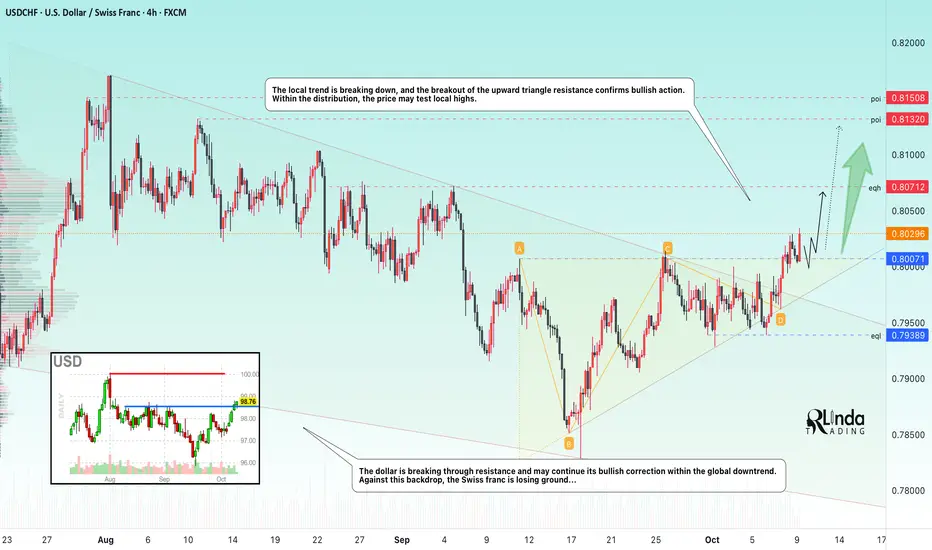
USDCHF → Change in local trend. Confirmation...FX:USDCHF confirms a change in the downtrend and is ready to move into a distribution phase amid growth in the dollar index.
The dollar is breaking through resistance and may continue its bullish correction within the global downtrend. Against this backdrop, the Swiss franc is losing ground...
The currency pair is forming a breakout of the local trend. The breakout of the resistance of the ascending triangle confirms bullish action. As part of the distribution, the price may test local highs.
Resistance levels: 0.8071, 0.8132
Support levels: 0.800
A consolidation of the price above 0.800 may form an intermediate bottom, which will provide support for the bulls before the next run.
Best regards, R. Linda!
GBPCAD - NEW BREAKDOWN!Hello Traders!
The GBPCAD price formed a rectangle pattern.
Currently, the support level is broken!
So, I expect a bearish move📉
_____________
TARGET: 1.86540🎯

Lingrid | USDCHF Key Handle 0.8000 Buy OpportunityThe price perfectly fulfilled my previous idea . FX:USDCHF is moving above the 0.8000 upward trendline following a breakout from the descending channel. The structure reveals an inverse head and shoulders formation, signaling a potential bullish reversal toward the 0.8090 resistance zone. As long as price holds above 0.8000, further upside toward 0.8100 remains favorable. Momentum suggests buying pressure is building for a retest of the upper resistance boundary.
⚠️ Risks:
A drop below 0.8000 could invalidate the bullish setup and trigger a decline toward 0.7846.
USD weakness driven by dovish macro data could cap momentum.
Unexpected shifts in risk sentiment or SNB policy could limit further upside potential.
If this idea resonates with you or you have your own opinion, traders, hit the comments. I’m excited to read your thoughts!

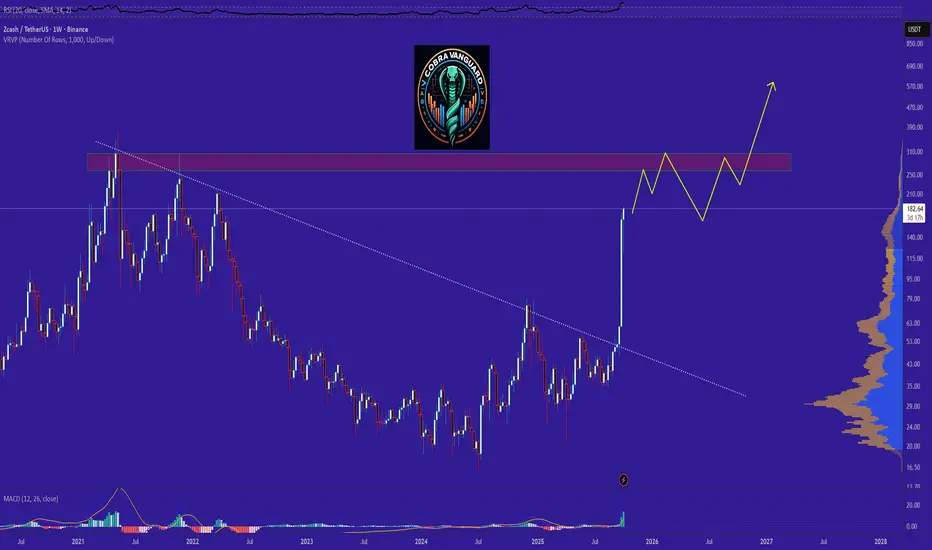
ZEC road map (4h)The way ZEC is growing, I think its alt season has already started before other alts, and it can easily break its previous high and see significant growth.
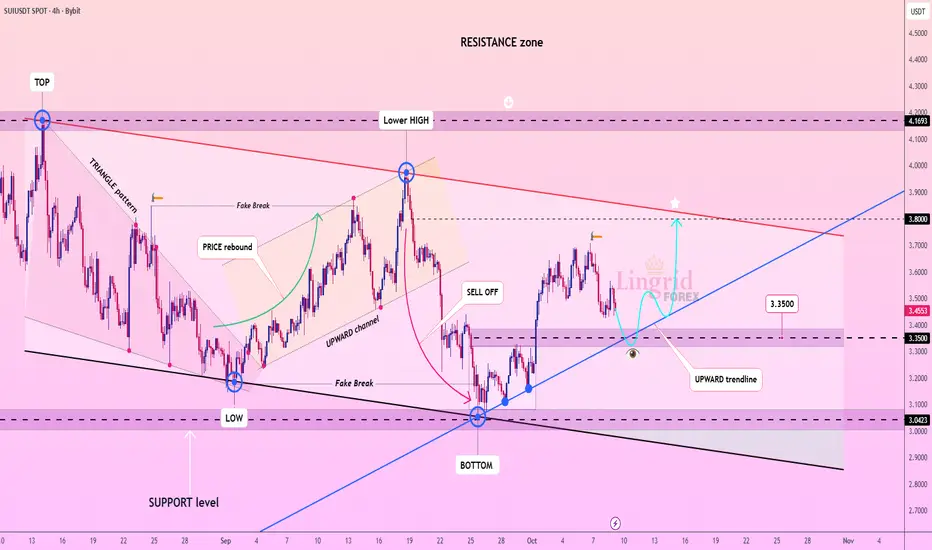
Lingrid | SUIUSDT Support Hold Recovery StabilizationBINANCE:SUIUSDT is pulling back to support 3.35 and upward trendline after a sharp rebound from support zone. The structure shows a recovery attempt within a broader upward correction, suggesting potential move toward 3.80. As long as price holds above 3.35 support, a bullish continuation toward 3.80 remains valid. Momentum is stabilizing, hinting that buyers may regain strength for another test of the upper resistance channel.
⚠️ Risks:
A close below 3.35 could trigger a retest of 3.00 support.
Weakness across major altcoins may limit upside recovery.
Unexpected market sentiment shifts or BTC corrections could suppress the rebound attempt.
If this idea resonates with you or you have your own opinion, traders, hit the comments. I’m excited to read your thoughts!
ARAM (Aram Group) — ADX 15Min BuyARAM pulled off a monster 106% move, breaking out of a large basing structure near 0.95 and rocketing up to 3.18. After this euphoric move, price formed a rising wedge, followed by a sharp correction and now a bull flag breakout — textbook bull continuation pattern.
The current candle just broke out from the falling wedge to the upside, signaling a fresh impulsive leg may be underway.
🔀 Trend & Breakout Structure:
Primary trend: Bullish AF
Consolidation: Falling wedge after rising wedge → bullish continuation
Breakout Trigger: Break of wedge resistance at ~2.65
🎯 Trade Setup:
Entry: 2.78 (Breakout Confirmation)
Stop Loss: 2.30 (Below wedge low)
Take Profit: 3.98
Risk/Reward: ~3 R
Max $ Risk: 1–3% of capital
"Let your winners run, cut your losers short." – Jesse Livermore
⚠️ Disclaimer:
This is not financial advice. ARAM appears to be a high-risk, small-cap momentum play. Use strict risk management and ensure your position size reflects your capital tolerance.

Inverse Head & Shoulders (NZD/JPY)Setup: possible long term bottom and bullish trend reversal
- inverse head and shoulders (pattern incomplete)
Signal:
A) At current breakout
B) Buy on gap fill during pullback
Nornally I follow trends - but seems like FX market bottoming out in several places...
Is this a bottom? or trend still lower, and better sell?

Double Bottoms and Double Tops Providing some education about market shifting shapes alongside live market conditions
Also, I am being taught by the AI mentor whilst is works with the live markets

DOT's situation+next targets and expected movementsThe price on the daily timeframe is within an ascending triangle, which can be promising. If the price breaks this pattern with bullish candles, it could easily rise by the distance of AB=CD, If my view is correct, DOT will rise to $5 .
And if this pattern is correct and breaks, higher targets are possible.

The Role of Central Bank Policies in the Global MarketIntroduction
Central banks serve as the backbone of every modern economy. Their primary objectives include maintaining monetary stability, controlling inflation, ensuring sustainable growth, and safeguarding the financial system. However, in an increasingly globalized world, central bank policies have far-reaching implications that extend beyond national borders. The global market—characterized by interconnected trade, capital flows, and investment—responds sharply to policy decisions made by major central banks such as the U.S. Federal Reserve (Fed), the European Central Bank (ECB), the Bank of Japan (BOJ), and others.
In the 21st century, as economies became more interdependent, the influence of central banks grew exponentially. Their monetary policies—ranging from interest rate adjustments to quantitative easing (QE), exchange rate interventions, and forward guidance—shape everything from currency valuations to commodity prices, stock market performance, and capital movement across borders. This essay explores the role, objectives, instruments, and global impacts of central bank policies, emphasizing how these policies shape the dynamics of the world market.
1. Understanding Central Banking
A central bank is a national financial institution responsible for regulating the supply of money and credit in the economy. It acts as the lender of last resort, ensures financial stability, and supports economic policy through various tools. Examples include the Federal Reserve (U.S.), European Central Bank (EU), Bank of England (UK), Bank of Japan, Reserve Bank of India, and People’s Bank of China (PBOC).
Central banks typically have two primary objectives:
Price Stability – Controlling inflation and preventing deflation.
Economic Stability – Promoting growth, employment, and financial resilience.
Beyond these goals, central banks also manage foreign reserves, stabilize currency values, and regulate the banking system to avoid crises.
2. Key Monetary Policy Tools
Central banks use several tools to influence the economy:
a) Interest Rate Policy
The most fundamental tool is the manipulation of the policy interest rate—such as the Federal Funds Rate (Fed), the Repo Rate (RBI), or the Refinancing Rate (ECB). Lowering interest rates makes borrowing cheaper, encouraging businesses and consumers to spend and invest. Conversely, raising rates curbs excessive spending and inflation.
Interest rate decisions affect global financial markets instantly. For example, a Fed rate hike can strengthen the U.S. dollar, weaken emerging market currencies, and cause capital outflows from developing nations.
b) Open Market Operations (OMO)
These involve the buying and selling of government securities to regulate liquidity in the banking system. When central banks buy securities, they inject liquidity; when they sell, they withdraw liquidity. OMOs are crucial for maintaining short-term interest rate targets and ensuring stability in money markets.
c) Quantitative Easing (QE)
Introduced extensively after the 2008 Global Financial Crisis (GFC), QE involves large-scale asset purchases by central banks to stimulate economic activity when interest rates are already near zero. The U.S. Fed, ECB, and BOJ used QE to inject trillions of dollars into the financial system, boosting asset prices, reducing yields, and encouraging lending.
d) Reserve Requirements
Central banks can alter the percentage of deposits that banks must hold as reserves. Lowering reserve ratios increases the lending capacity of commercial banks, thereby expanding credit in the economy.
e) Forward Guidance
This communication tool involves signaling future policy intentions to influence market expectations. For example, when a central bank announces that rates will remain low for an extended period, it boosts investor confidence and encourages spending.
f) Exchange Rate Intervention
Some central banks, especially in export-driven economies, intervene directly in the foreign exchange market to control currency appreciation or depreciation. China’s central bank has historically done this to maintain a competitive export advantage.
3. Objectives of Central Bank Policies
The goals of central bank policies are often shaped by domestic priorities but also have implications for the global market:
Inflation Targeting – Most modern central banks aim to keep inflation around a target (usually 2%).
Full Employment – Encouraging job creation through economic stimulus.
Financial Stability – Preventing crises in banking and capital markets.
Exchange Rate Stability – Avoiding extreme currency fluctuations that can hurt trade competitiveness.
Sustainable Growth – Promoting long-term economic expansion without overheating.
4. Central Banks and Global Market Interdependence
In the globalized economy, the actions of one central bank can significantly affect others. This interconnectedness is visible in several areas:
a) Spillover Effects
When the U.S. Federal Reserve changes its policy stance, global financial markets react instantly. For example, higher U.S. interest rates can lead to:
Strengthening of the U.S. dollar.
Capital outflows from emerging markets.
Rising bond yields globally.
Volatility in global equity and commodity markets.
Similarly, the European Central Bank’s decisions on QE or rate cuts can impact the Eurozone and ripple through Asian and American markets.
b) Exchange Rate Volatility
Monetary policy divergence—when different central banks follow opposing directions—creates fluctuations in exchange rates. For instance, when the Fed tightens policy while Japan maintains ultra-low rates, the yen depreciates relative to the dollar, affecting trade balances and export competitiveness worldwide.
c) Inflation and Commodity Prices
Central bank policies influence inflation expectations globally. Loose monetary policies (like QE) often drive up commodity prices—especially gold, oil, and metals—as investors seek inflation hedges. Tightening policies, on the other hand, can deflate commodity bubbles.
d) Cross-Border Capital Flows
When advanced economies adopt low-interest policies, investors search for higher returns in emerging markets—known as “carry trade.” This inflow strengthens developing nations’ currencies temporarily but can reverse sharply when interest rates in advanced economies rise, leading to financial instability in emerging markets.
5. Case Studies of Major Central Banks and Their Global Impact
a) The U.S. Federal Reserve (Fed)
The Fed is arguably the most influential central bank in the world. Its monetary policy decisions set the tone for global markets because the U.S. dollar is the world’s primary reserve currency.
During the 2008 crisis, the Fed reduced interest rates to near zero and initiated several rounds of Quantitative Easing, purchasing trillions in government and mortgage-backed securities. This policy stabilized U.S. markets but also led to a global surge in asset prices and liquidity inflows into emerging economies.
In contrast, post-2015 rate hikes triggered capital outflows from developing countries and strengthened the dollar, causing many emerging markets to face currency depreciation and inflationary pressures.
The Fed’s post-pandemic policies (2020–2023) followed similar trends. During COVID-19, ultra-loose monetary policy supported recovery but later contributed to global inflation. The subsequent rapid rate hikes from 2022–2024 affected every market—from crypto assets to sovereign debt.
b) The European Central Bank (ECB)
The ECB governs the euro area and focuses primarily on price stability. After the 2008 crisis and the Eurozone debt crisis (2010–2012), the ECB introduced negative interest rates and massive bond-buying programs. This policy weakened the euro, boosted exports, and lowered borrowing costs for heavily indebted nations like Greece, Italy, and Spain.
However, ECB policies also led to capital shifts toward U.S. markets, as investors sought higher yields abroad. Recently, in response to high inflation (2022–2024), the ECB followed the Fed in tightening monetary conditions, showing how policy synchronization affects global markets.
c) Bank of Japan (BOJ)
The BOJ pioneered ultra-loose monetary policy to combat decades of deflation. Its “Yield Curve Control” (YCC) strategy caps long-term bond yields while maintaining low short-term rates. This has weakened the yen, supporting Japan’s exporters but also creating global imbalances, as Japanese investors sought higher returns overseas.
d) People’s Bank of China (PBOC)
The PBOC plays a unique role in the world economy. China’s central bank manages monetary policy with dual objectives: supporting domestic growth and maintaining a stable exchange rate for the yuan. The PBOC often uses reserve ratio cuts, liquidity injections, and currency interventions to sustain its economic expansion while avoiding financial instability.
Given China’s role as the world’s manufacturing hub, its monetary decisions influence commodity demand, global supply chains, and emerging market trade balances.
e) Reserve Bank of India (RBI)
The RBI balances inflation control with growth objectives. India’s high exposure to global capital flows makes it sensitive to Fed and ECB decisions. When U.S. rates rise, foreign investors often pull out from Indian markets, causing the rupee to weaken and import costs to rise. The RBI uses repo rate adjustments, foreign exchange interventions, and liquidity management to stabilize the economy.
6. The Role of Central Banks in Crisis Management
Central banks play a crucial role during economic crises. They act swiftly to prevent collapses and stabilize markets.
a) 2008 Global Financial Crisis
The Fed, ECB, and BOJ implemented unprecedented QE programs and zero-interest policies. These measures prevented a global depression but also led to long-term asset inflation and income inequality, as wealth concentrated in financial markets.
b) COVID-19 Pandemic (2020)
Global central banks responded with massive liquidity injections and fiscal coordination. The Fed’s unlimited QE, the ECB’s Pandemic Emergency Purchase Program (PEPP), and similar measures by other central banks ensured credit flow. However, the post-pandemic phase brought supply chain disruptions and record inflation, leading to synchronized tightening by 2022.
c) Financial Market Volatility (2022–2025)
Rapid rate hikes to curb inflation caused global debt pressures. Developing nations faced currency depreciation, capital flight, and debt servicing challenges. Central banks now face the delicate balance between price stability and economic growth.
7. Challenges Facing Central Banks in the Global Market
Global Inflation Pressures – Post-pandemic recovery and geopolitical tensions have caused persistent inflation worldwide.
Debt Burden – High global debt limits the room for aggressive tightening.
Financial Market Dependence – Markets have grown dependent on central bank liquidity; withdrawing it causes volatility.
Digital Currency Evolution – The rise of Central Bank Digital Currencies (CBDCs) introduces new policy challenges related to cross-border payments and cybersecurity.
Geopolitical Fragmentation – Sanctions, trade wars, and currency blocs complicate global coordination.
Climate and Green Finance – Central banks increasingly consider sustainability and environmental risks in policy frameworks.
8. The Future of Central Bank Policy in a Global Context
The future of central bank policies will likely focus on balance and innovation. Policymakers will need to harmonize inflation control with growth and stability. Key future trends include:
Greater International Coordination – To prevent spillover shocks, especially during crises.
Digital Transformation – Adoption of CBDCs and real-time payment systems.
Green Monetary Policy – Supporting sustainable investments and green bonds.
Macroprudential Regulation – Enhanced oversight to prevent asset bubbles and systemic risks.
Transparency and Communication – Forward guidance will remain critical for stabilizing expectations.
In the long term, global financial integration means that no central bank operates in isolation. Policies will need to be flexible and globally coordinated to manage shared challenges like inflation, debt, and digital disruption.
Conclusion
Central bank policies form the foundation of global economic stability. Through tools like interest rate management, quantitative easing, and forward guidance, central banks shape not only domestic economies but also the trajectory of global markets. The ripple effects of decisions made by the Federal Reserve, ECB, or PBOC influence capital flows, currency values, commodity prices, and financial stability across continents.
In an era of globalization, central banks have evolved from national guardians to global actors. Their policies must now consider international spillovers, financial integration, and the balance between stability and innovation. As the world navigates inflation, digitalization, and geopolitical uncertainty, the future of global markets will continue to hinge on how central banks manage their dual role—national stability and global responsibility.
Global Market Insights: Trends, Forces, and Future Directions1. Introduction
The global market represents the interconnected network of buyers, sellers, producers, investors, and consumers spread across the world. It is an intricate web of economic interactions driven by trade, finance, technology, geopolitics, and consumer demand. Understanding global market insights means analyzing how various regions, sectors, and macroeconomic indicators collectively shape global commerce and financial systems.
Over the past few decades, globalization has blurred national boundaries in trade and investment. However, in recent years, challenges such as geopolitical conflicts, supply chain disruptions, climate change, and digital transformation have reshaped the contours of the global market. This essay provides a comprehensive overview of the global market—its evolution, structure, driving forces, sectoral trends, challenges, and future outlook.
2. Evolution of the Global Market
The global market has evolved through several distinct phases over centuries:
a. Early Trade Networks
Trade routes such as the Silk Road and maritime spice routes laid the foundation for global commerce. Goods, ideas, and cultures moved across continents, linking civilizations in Europe, Asia, and Africa.
b. The Industrial Revolution (18th–19th Century)
The Industrial Revolution marked the birth of modern capitalism. Mass production, mechanization, and steam transportation transformed trade and manufacturing. Britain became the epicenter of industrial and financial expansion.
c. Post-World War II Era
After 1945, international institutions such as the IMF, World Bank, and GATT (now WTO) emerged, stabilizing global finance and promoting free trade. This era saw the rise of the U.S. dollar as the global reserve currency and the dominance of multinational corporations.
d. Globalization and Technology (1980s–2000s)
The information revolution, internet expansion, and financial liberalization led to an unprecedented integration of markets. Cross-border capital flows surged, and supply chains became truly global.
e. The 21st Century: Multipolar Globalization
Today’s global market is defined by multipolarity—economic power is distributed across several major economies, including the U.S., China, the EU, Japan, and emerging nations like India and Brazil. The digital economy and sustainability imperatives now drive global business models.
3. Structure of the Global Market
The global market is not a monolith—it consists of interrelated segments:
a. Goods and Services Market
International trade in goods (manufactured products, commodities, etc.) and services (finance, IT, tourism, education) forms the backbone of the global economy. The World Trade Organization (WTO) regulates much of this exchange.
b. Capital Markets
Global financial markets—stocks, bonds, currencies, and derivatives—facilitate investment, liquidity, and risk management. Centers like New York, London, Hong Kong, and Singapore play crucial roles.
c. Commodity Markets
Energy, metals, and agricultural commodities are traded globally, influencing inflation, production costs, and geopolitical relations.
d. Labor Markets
Global labor mobility, remote work, and outsourcing link labor forces across borders. The rise of gig and digital work platforms further globalizes employment.
e. Digital and Technology Markets
Tech giants, e-commerce, digital services, and data-driven economies now dominate global valuations, marking the shift toward an information-based economy.
4. Key Drivers of the Global Market
Several macroeconomic, political, and technological forces drive global market behavior:
a. Global Trade and Investment Flows
Trade agreements, tariffs, and investment treaties shape international exchange. Free trade areas like the European Union (EU), ASEAN, and NAFTA (now USMCA) facilitate market integration.
b. Monetary Policy and Interest Rates
Central banks—especially the U.S. Federal Reserve—have a global impact. Interest rate changes influence capital flows, currency valuations, and asset prices worldwide.
c. Exchange Rates
Fluctuations in exchange rates affect export competitiveness, import costs, and investment returns, linking currency markets directly with trade flows.
d. Technology and Innovation
Artificial intelligence, blockchain, automation, and green energy innovation reshape industries, productivity, and competitiveness across economies.
e. Geopolitical Developments
Conflicts, sanctions, and trade wars (e.g., U.S.–China tensions, Russia–Ukraine conflict) influence global supply chains and capital movement.
f. Consumer Demand and Demographics
A growing global middle class, especially in Asia and Africa, drives consumption trends, while aging populations in developed nations shift focus toward healthcare and retirement services.
g. Environmental and ESG Considerations
Sustainability, carbon neutrality, and ethical investing (ESG) now define long-term corporate and investor strategies, altering capital allocation globally.
5. Major Regional Market Insights
a. North America
United States: The U.S. remains the largest economy, driven by innovation, consumer spending, and financial dominance.
Canada and Mexico: Key players in manufacturing, natural resources, and trade partnerships under USMCA.
b. Europe
The European Union represents a massive integrated market with advanced industries, strong social systems, and leading roles in climate policy and regulation. However, energy dependency and aging demographics pose challenges.
c. Asia-Pacific
Asia is now the engine of global growth:
China: The world’s manufacturing hub and second-largest economy.
India: A rising powerhouse in IT, pharmaceuticals, and digital services.
Japan and South Korea: Leaders in technology, robotics, and electronics.
ASEAN nations: Fast-growing emerging markets benefiting from supply chain shifts.
d. Middle East and Africa
Middle East: Dominated by energy exports but diversifying through Vision 2030-style initiatives.
Africa: Rich in resources and demographic potential but constrained by infrastructure and governance challenges.
e. Latin America
Known for commodities and agriculture, Latin America’s growth is tied to global demand cycles and political stability.
6. Sectoral Trends and Insights
a. Technology
Digital transformation drives value creation across industries. AI, cloud computing, and 5G technologies are redefining communication, production, and logistics.
b. Energy
The energy market is undergoing a green transition. Renewable energy, electric vehicles, and battery innovation are reshaping traditional oil and gas dominance.
c. Finance
Global finance is transforming through digital banking, fintech, and decentralized finance (DeFi). Central Bank Digital Currencies (CBDCs) may revolutionize monetary systems.
d. Healthcare
The COVID-19 pandemic accelerated global collaboration in healthcare R&D and supply chains. Biotechnology and telemedicine are emerging frontiers.
e. Manufacturing and Supply Chains
Nearshoring, automation, and smart manufacturing are responses to supply chain fragility exposed during the pandemic.
f. Agriculture and Food Security
Climate change, food inflation, and technological innovation (like precision farming) define the future of agriculture markets.
7. Challenges Facing the Global Market
a. Geopolitical Tensions
Conflicts, trade wars, and sanctions disrupt trade flows, increase volatility, and create market uncertainty.
b. Inflation and Monetary Tightening
Post-pandemic inflation and interest rate hikes have led to slower growth and volatile financial conditions worldwide.
c. Supply Chain Disruptions
Global logistics have been tested by pandemics, wars, and natural disasters, prompting rethinking of global sourcing strategies.
d. Technological Inequality
The digital divide between advanced and developing nations risks deepening economic disparities.
e. Climate Change
Extreme weather, carbon emissions, and environmental degradation pose risks to industries like agriculture, insurance, and energy.
f. Financial Instability
Debt crises in emerging markets, volatile capital flows, and speculative bubbles threaten financial stability.
8. The Role of Institutions in Global Markets
Institutions such as the IMF, World Bank, WTO, and OECD provide regulatory, financial, and developmental support to stabilize global markets.
Multilateral cooperation—through the G20, UN, and regional development banks—helps coordinate fiscal, trade, and climate policies.
Additionally, private sector institutions (investment banks, rating agencies, multinational corporations) hold significant influence over market direction and capital allocation.
9. Data, Analytics, and Market Intelligence
In the digital age, data analytics underpins market insights. Predictive models, real-time indicators, and sentiment analysis drive investment and policy decisions.
Tools such as AI-driven trading, big data analytics, and machine learning enable deeper understanding of consumer behavior, supply chain resilience, and financial risk.
Moreover, transparency and cybersecurity have become critical, as financial data breaches and misinformation can trigger large-scale disruptions.
10. Future of Global Markets
a. Digital and Decentralized Economies
Cryptocurrencies, blockchain, and digital identity systems are decentralizing finance and trade infrastructure.
b. Sustainable Capitalism
ESG investing and carbon-neutral initiatives are steering capital toward green energy, ethical production, and inclusive growth.
c. Multipolar Economic Order
The U.S. and China will remain dominant, but regional blocs (India, ASEAN, EU, Africa) will exert growing influence, reducing single-nation hegemony.
d. Artificial Intelligence in Market Forecasting
AI will drive automation in trading, logistics, and forecasting, making markets more efficient but potentially more volatile.
e. Demographic Shifts
Young populations in Africa and Asia will fuel consumption, while aging populations in the West will reshape healthcare and pension systems.
f. Global Cooperation vs. Fragmentation
The balance between globalization and protectionism will determine whether the world economy remains integrated or splinters into regional blocs.
11. Strategic Insights for Investors and Policymakers
Diversification: Spreading assets across regions and sectors mitigates volatility.
Sustainability Integration: ESG is no longer optional—it’s a market imperative.
Technological Adoption: Nations and businesses that lead in AI, data, and digital infrastructure will gain a competitive edge.
Resilience Building: Strengthening supply chains and fiscal buffers is key to managing future shocks.
Policy Coordination: Fiscal and monetary alignment across countries is essential for global stability.
12. Conclusion
The global market is a living system—dynamic, adaptive, and deeply interconnected. Its evolution reflects the interplay of human ambition, technological progress, and policy choices. While challenges such as geopolitical fragmentation, climate risk, and inequality persist, opportunities abound in innovation, sustainability, and emerging markets.
In the years ahead, success in navigating global markets will depend on strategic foresight, technological agility, and global cooperation. Understanding market insights is not just about predicting numbers—it is about interpreting the underlying forces that shape humanity’s economic future.