Breaking: SoFi Technologies, Inc. (SOFI) Surge 4% In PremarketSoFi Technologies, Inc. (NASDAQ: NASDAQ:SOFI ) spike 4% in Tuesday's premarket session but sharply consolidated 2.62% .
The daily price chart shows a cup and handle pattern with eyes on the $40 resistant. As of the time of writing, NASDAQ:SOFI has an RSI of 54 giving more room to capitalize on the RSI.
In another news, SoFi Reports Third Quarter 2025 with Record Net Revenue of $962 Million, Record Member and Product Growth, Net Income of $139 Million.
About SOFI
SoFi Technologies, Inc. provides various financial services in the United States, Latin America, Canada, and Hong Kong. It operates through three segments: Lending, Technology Platform, and Financial Services.
The company offers lending and financial services and products that allows its members to borrow, save, spend, invest, and protect money; and personal loans, student loans, home loans, and related services.
Contains image

Coinbase May Be CoilingCoinbase Global has done little as the broader market climbs, but some traders may expect the cryptocurrency exchange to start moving.
The first pattern on today’s chart is the series of higher lows since early September. Those may suggest that buyers are lurking.
Second, COIN’s 50-day simple moving average (SMA) had a “golden cross” above the 200-day SMA in late June. Is the long-term trend getting bullish?
Third, the 8-day exponential moving average (EMA) just crossed back above the 21-day EMA. That may reflect an increasingly positive short-term trend.
Next, stochastics are rebounding from an oversold condition.
Finally, COIN is an active underlier in the options market. (Its average daily volume of 249,000 contracts in the last month ranks 15th in the S&P 500, according to TradeStation data.) That could help traders take positions with calls and puts.
TradeStation has, for decades, advanced the trading industry, providing access to stocks, options and futures. If you're born to trade, we could be for you. See our Overview for more.
Past performance, whether actual or indicated by historical tests of strategies, is no guarantee of future performance or success. There is a possibility that you may sustain a loss equal to or greater than your entire investment regardless of which asset class you trade (equities, options or futures); therefore, you should not invest or risk money that you cannot afford to lose. Online trading is not suitable for all investors. View the document titled Characteristics and Risks of Standardized Options at www.TradeStation.com . Before trading any asset class, customers must read the relevant risk disclosure statements on www.TradeStation.com . System access and trade placement and execution may be delayed or fail due to market volatility and volume, quote delays, system and software errors, Internet traffic, outages and other factors.
Securities and futures trading is offered to self-directed customers by TradeStation Securities, Inc., a broker-dealer registered with the Securities and Exchange Commission and a futures commission merchant licensed with the Commodity Futures Trading Commission). TradeStation Securities is a member of the Financial Industry Regulatory Authority, the National Futures Association, and a number of exchanges.
Options trading is not suitable for all investors. Your TradeStation Securities’ account application to trade options will be considered and approved or disapproved based on all relevant factors, including your trading experience. See www.TradeStation.com . Visit www.TradeStation.com for full details on the costs and fees associated with options.
Margin trading involves risks, and it is important that you fully understand those risks before trading on margin. The Margin Disclosure Statement outlines many of those risks, including that you can lose more funds than you deposit in your margin account; your brokerage firm can force the sale of securities in your account; your brokerage firm can sell your securities without contacting you; and you are not entitled to an extension of time on a margin call. Review the Margin Disclosure Statement at www.TradeStation.com .
TradeStation Securities, Inc. and TradeStation Technologies, Inc. are each wholly owned subsidiaries of TradeStation Group, Inc., both operating, and providing products and services, under the TradeStation brand and trademark. When applying for, or purchasing, accounts, subscriptions, products and services, it is important that you know which company you will be dealing with. Visit www.TradeStation.com for further important information explaining what this means.

KSE-100 | 1H TF| 28 OCT 2025 | The Chart AlchemistTechnical Analysis of KSE-100 | 1H TF| 28 OCT 2025 | The Chart Alchemist
The KSE-100 index is trading in a symmetrical triangle pattern, touching the immediate support level of 159,950.
Support Levels:
1. Immediate Support: 159,950 (touched today)
2. Secondary Support: 157,800
Outlook:
The index has formed a bearish channel within the symmetrical triangle and hasn't shown signs of upward reversal. A breakout above this channel is required for a bullish consideration.
Trading Advice:
Exercise extreme caution, position sizing and SL, as the index is trading in a bearish channel.

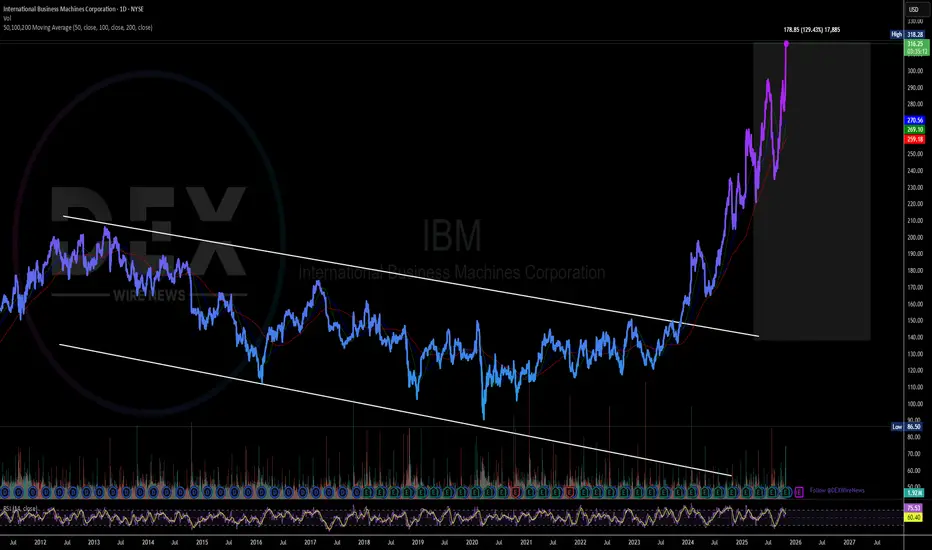
International Business Machines (IBM) Gearing for Breakout Ever since breaking out of a falling wedge on November 2023, International Business Machines (IBM) spike 130% breaking highs after highs.
In recent news, IBM plans to launch a platform that will enable financial institutions, governments and corporations to manage digital assets across various blockchains while meeting their compliance obligations.
The IBM Digital Asset Haven is being developed in collaboration with Dfns, a digital wallet infrastructure provider that has created 15 million wallets for 250 clients, the companies said in a Monday (Oct. 27) press release.
About IBM
International Business Machines Corporation, together with its subsidiaries, provides integrated solutions and services in the Americas, Europe, the Middle East, Africa, and the Asia Pacific. It operates through Software, Consulting, Infrastructure, and Financing segments. The Software segment offers hybrid cloud and AI platforms that allows clients to realize their digital and AI transformations across the applications, data, and environments in which they operate.
Breaking: TEN Holdings, Inc. (NASDAQ:XHLD) Spike Over 100% TodayThe price of TEN Holdings, Inc. (NASDAQ NASDAQ:XHLD ) broke out of a falling wedge spiking over 100% today during Tuesday early market session.
With buying momentum increasing as seen by the RSI at 88, NASDAQ:XHLD might reclaim the $2 resistance in the short to long term.
In another news, TEN Holdings, Inc. (NASDAQ NASDAQ:XHLD ) recently announces a strategic agreement with V-Cube, Inc., its controlling stockholder and a leader in the global virtual events industry in Japan and Singapore.
TEN Holdings and V-Cube are unifying their respective technologies and expertise to deliver advanced communication and event technology tailored for the North American enterprise market, valued at USD 34.39 billion in 2024 (Grand View Research).
About XHLD
TEN Holdings, Inc. provides event planning, production, and broadcasting services in the United States. The company organize virtual, hybrid, and physical events, including conferences, marketing events, product launches, trainings, and investors and shareholder meetings. Its events are enabled by its Xyvid Pro Platform, an internet-based broadcast platform with interactive engagement tools designed to provide web broadcast audiences with a dynamic, interactive, and engaging virtual event experience.

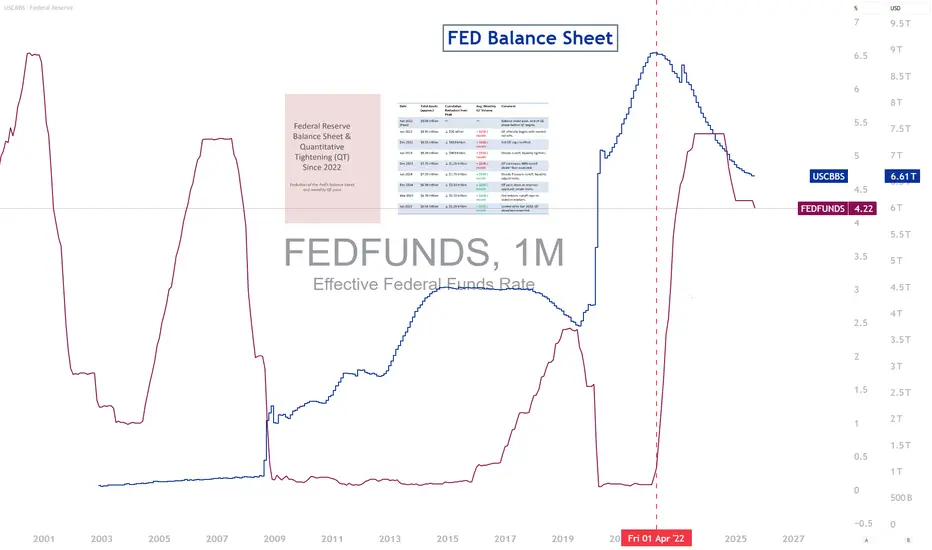
Upcoming End of the Fed’s Quantitative Tightening?This Wednesday, October 29, 2025, could mark a decisive turning point for U.S. monetary policy and, by extension, for global markets.
All eyes are on the Federal Reserve (Fed), which is expected to announce a cut to its main interest rate.
But investors are paying even closer attention to another key question: the potential end of Quantitative Tightening (QT) — the process through which the Fed reduces the size of its balance sheet.
1) What is QT, and why might the Fed slow it down again?
Since 2022, the Fed has been implementing QT to gradually withdraw the excess liquidity injected during the post-Covid period.
In practice, this means allowing part of its Treasury and mortgage-backed securities holdings to mature without reinvesting the proceeds.
As a result, the amount of dollars in circulation declines, credit conditions tighten, and global liquidity contracts.
Several signals now point toward a shift in stance.
The U.S. economy is slowing, some regional banks are showing renewed signs of stress, and inflationary pressures are easing.
In this environment, the Fed may conclude that it’s time to ease financial conditions to avoid an excessive economic slowdown.
Ending QT — or even slowing its pace further — would effectively inject liquidity back into the financial system.
This would mean bank reserves rising again, facilitating credit flows and encouraging risk-taking in the markets.
2) A positive impact on risk assets
Historically, each time the Fed stopped shrinking its balance sheet, equity markets rebounded.
The logic is straightforward: more liquidity in the system typically leads to higher asset prices.
A slower QT would likely come alongside lower bond yields and a weaker U.S. dollar — two factors that generally favor stock market rallies and risk asset performance.
This support seems all the more crucial today, as the S&P 500 remains near its all-time high valuations.
The chart below shows the QT program since 2022, with a gradually declining monthly pace since 2024.
3) Jerome Powell’s key message
Finally, Jerome Powell’s speech will be critical.
Markets will react not only to the policy decisions themselves but also to the tone:
• What pace for balance sheet reduction?
• What flexibility in responding to inflation?
• What outlook for 2026?
If Powell hints that the Fed is preparing to end QT, the message will be clear: liquidity is returning, and with it, a renewed appetite for risk across financial markets.
DISCLAIMER:
This content is intended for individuals who are familiar with financial markets and instruments and is for information purposes only. The presented idea (including market commentary, market data and observations) is not a work product of any research department of Swissquote or its affiliates. This material is intended to highlight market action and does not constitute investment, legal or tax advice. If you are a retail investor or lack experience in trading complex financial products, it is advisable to seek professional advice from licensed advisor before making any financial decisions.
This content is not intended to manipulate the market or encourage any specific financial behavior.
Swissquote makes no representation or warranty as to the quality, completeness, accuracy, comprehensiveness or non-infringement of such content. The views expressed are those of the consultant and are provided for educational purposes only. Any information provided relating to a product or market should not be construed as recommending an investment strategy or transaction. Past performance is not a guarantee of future results.
Swissquote and its employees and representatives shall in no event be held liable for any damages or losses arising directly or indirectly from decisions made on the basis of this content.
The use of any third-party brands or trademarks is for information only and does not imply endorsement by Swissquote, or that the trademark owner has authorised Swissquote to promote its products or services.
Swissquote is the marketing brand for the activities of Swissquote Bank Ltd (Switzerland) regulated by FINMA, Swissquote Capital Markets Limited regulated by CySEC (Cyprus), Swissquote Bank Europe SA (Luxembourg) regulated by the CSSF, Swissquote Ltd (UK) regulated by the FCA, Swissquote Financial Services (Malta) Ltd regulated by the Malta Financial Services Authority, Swissquote MEA Ltd. (UAE) regulated by the Dubai Financial Services Authority, Swissquote Pte Ltd (Singapore) regulated by the Monetary Authority of Singapore, Swissquote Asia Limited (Hong Kong) licensed by the Hong Kong Securities and Futures Commission (SFC) and Swissquote South Africa (Pty) Ltd supervised by the FSCA.
Products and services of Swissquote are only intended for those permitted to receive them under local law.
All investments carry a degree of risk. The risk of loss in trading or holding financial instruments can be substantial. The value of financial instruments, including but not limited to stocks, bonds, cryptocurrencies, and other assets, can fluctuate both upwards and downwards. There is a significant risk of financial loss when buying, selling, holding, staking, or investing in these instruments. SQBE makes no recommendations regarding any specific investment, transaction, or the use of any particular investment strategy.
CFDs are complex instruments and come with a high risk of losing money rapidly due to leverage. The vast majority of retail client accounts suffer capital losses when trading in CFDs. You should consider whether you understand how CFDs work and whether you can afford to take the high risk of losing your money.
Digital Assets are unregulated in most countries and consumer protection rules may not apply. As highly volatile speculative investments, Digital Assets are not suitable for investors without a high-risk tolerance. Make sure you understand each Digital Asset before you trade.
Cryptocurrencies are not considered legal tender in some jurisdictions and are subject to regulatory uncertainties.
The use of Internet-based systems can involve high risks, including, but not limited to, fraud, cyber-attacks, network and communication failures, as well as identity theft and phishing attacks related to crypto-assets.
GOLD: Bullish, But Retracing! Short Term Sell Opportunity!In this Weekly Market Forecast, we will analyze the Gold (XAUUSD) for the week of Oct. 27 - 31st.
Gold is still bullish, the current pullback it's in notwithstanding. Waiting patiently for valid buy setups is the sure way to go.
That being said, there is sell setup that could present an short-term opportunity. The Daily -FVG is currently holding price in check. Should price return to it and it continues to hold, a valid sell opportunity could present itself.
Be careful, as it is counter-trend. They can be lower-probability.
Enjoy!
May profits be upon you.
Leave any questions or comments in the comment section.
I appreciate any feedback from my viewers!
Like and/or subscribe if you want more accurate analysis.
Thank you so much!
Disclaimer:
I do not provide personal investment advice and I am not a qualified licensed investment advisor.
All information found here, including any ideas, opinions, views, predictions, forecasts, commentaries, suggestions, expressed or implied herein, are for informational, entertainment or educational purposes only and should not be construed as personal investment advice. While the information provided is believed to be accurate, it may include errors or inaccuracies.
I will not and cannot be held liable for any actions you take as a result of anything you read here.
Conduct your own due diligence, or consult a licensed financial advisor or broker before making any and all investment decisions. Any investments, trades, speculations, or decisions made on the basis of any information found on this channel, expressed or implied herein, are committed at your own risk, financial or otherwise.

SPX - The Road to 6900 Begins “History never repeats itself. Man always does.”
A deep look into SPX History exposes the path of a market cycle and tells us the truth on where markets are headed.
Percentages don't lie.
See you guys at 6900!

GPTUSD — Key Resistance Tested, Eyes on Weak Low!GBPUSD — Tuesday, October 28
Welcome traders! 👋
I’m glad to have you here — we’re all learning and growing together in this amazing trading journey.
Let’s dive into today’s analysis on GPTUSD 👇
As mentioned in yesterday’s analysis, GPTUSD moved exactly as expected, reacting beautifully from our marked POI zones. For the upcoming trading session, I have the following scenario in focus:
📍 Price is now sitting inside a significant Daily POI and resistance area.
If we see a clear rejection and confirmation, the price is likely to head toward the Weak Low target zone.
💰 Take-profit attention:
Look for profit-taking opportunities at OBS liquidity points — those often serve as the last liquidity grabs before continuation.
🎯 Educational Note:
At OBS levels, never open trades against the trend.
Instead, use these zones to align with the dominant direction — they’re great areas for continuation setups when confirmations are present.
Remember: the market is never 100% certain.
Always wait for confirmation before entering any trade, manage your risk wisely, and stay alert for USD-related news this week — volatility may increase.
This analysis is valid for Tuesday, October 28 only.
I’d love to hear your thoughts and setups in the comments below 💬
📘 Educational Note:
This analysis is for educational and illustrative purposes only.
Always follow your own plan, confirm with your strategy, and manage risk carefully.
Success in trading comes from discipline, patience, and consistency. 💪
🚀 Empowering traders through clarity, confidence & clean charts.
Follow 👉 parisa_tl for more SMC setups and weekly insights 💙
#GPTUSD #SmartMoneyConcepts #SMCTrading #LiquidityHunt #OrderBlock #FairValueGap #POI #PriceAction #SupplyAndDemand #MarketStructure #SwingTrading #ForexAnalysis #DayTrading #TechnicalAnalysis #SMCStrategy #LiquidityGrab #TradingEducation #ChartAnalysis #ForexSetups #TradeSmart #RiskManagement #TraderMindset #TradingCommunity #parisa_tl

GOLD Free Signal! Sell!
Hello,Traders!
GOLD reacted precisely from the horizontal supply area, showing displacement and lower-timeframe structure breaks. A bearish move is expected as liquidity above the previous high was swept.
-------------------
Stop Loss: 3,993$
Take Profit: 3,882$
Entry: 3,938$
Time Frame: 3H
-------------------
Sell!
Comment and subscribe to help us grow!
Check out other forecasts below too!
Disclosure: I am part of Trade Nation's Influencer program and receive a monthly fee for using their TradingView charts in my analysis.

Mind the gapsNASDAQ:BYND is in the middle of a possible Gamma squeeze. There are chart gaps both above and below current price. Earnings is coming on November 4, look for a major catalyst in either direction. Expect high volatility going forward.

Gold Consolidates Weakly Around $3925 – Sellers Still in Control📊 1. Market Overview
Gold prices rebounded slightly from the $3900 level, reaching $3931 before losing momentum. The market is now moving sideways around $3925 in a weak consolidation phase. The U.S. dollar remains firm as Treasury yields stay elevated, while traders await the upcoming PCE inflation data, limiting gold’s recovery potential.
🔍 2. Technical Analysis
• Main Trend: Bearish, with weak corrective rebounds.
• Immediate Resistance: $3930 – $3935
• Higher Resistance: $3948 – $3960
• Near-term Support: $3900 – $3890
• EMA50 & EMA200 (H1): EMA50 remains below EMA200, confirming the ongoing bearish bias.
• Candlestick Pattern: Small lower-tail candles around 3925 indicate mild buying but no clear reversal signal.
• RSI (H1): 45 – neutral, suggesting potential range-bound movement before breaking above 3930 or below 3900.
💡 3. Outlook
Gold is currently in a short-term accumulation phase after a steep drop, but the broader trend remains bearish. A rejection from the $3930–$3935 resistance zone could trigger another decline toward $3900 or even $3880. Conversely, a decisive breakout above $3935 with strong volume may extend the rebound toward $3960.
🎯 4. Trading Strategy
🔻 SELL XAU/USD: $3928 – $3932
🎯 TP: 40 / 80 / 200 pips
🛑 SL: $3938

Emerging Markets vs. Developed MarketsIntroduction
Global financial markets can broadly be divided into two categories — developed markets and emerging markets. This classification plays a vital role in understanding investment strategies, economic potential, and risk-return dynamics. Developed markets, often referred to as advanced economies, are characterized by stability, technological innovation, and mature financial systems. In contrast, emerging markets represent nations that are transitioning toward industrialization and modernization but still face structural, political, and economic challenges.
The distinction between emerging and developed markets is not merely geographical; it reflects differences in income levels, governance quality, capital flows, infrastructure, and market maturity. Understanding these differences helps investors, policymakers, and corporations make strategic decisions in global trade, investment diversification, and growth planning.
Definition and Classification
Developed Markets
Developed markets are countries with high per capita income, robust industrialization, stable political systems, and mature financial infrastructure. These economies exhibit slow but steady economic growth and low volatility. The International Monetary Fund (IMF), the World Bank, and financial index providers like MSCI and FTSE classify countries such as the United States, United Kingdom, Japan, Germany, France, Canada, and Australia as developed markets.
Key characteristics include:
High GDP per capita (typically above $12,000).
Advanced infrastructure and technological capabilities.
Stable currency and monetary systems.
Transparent legal and regulatory frameworks.
Deep and liquid financial markets.
Emerging Markets
Emerging markets refer to countries undergoing rapid growth and industrialization, moving from a developing to a developed status. These markets display expanding economic activity, growing middle classes, and increasing integration into global trade systems. Examples include China, India, Brazil, South Africa, Indonesia, Mexico, and Turkey.
Emerging economies typically show:
Moderate to high GDP growth rates.
Rapid industrialization and urbanization.
Expanding capital markets but with higher volatility.
Political and institutional challenges.
Greater potential for long-term returns coupled with higher risk.
Organizations like MSCI Emerging Markets Index include over 25 nations that collectively represent a significant share of global GDP and trade.
Economic Growth and Development Patterns
The most striking difference between emerging and developed markets lies in their growth trajectories. Developed markets tend to have slow but stable growth, whereas emerging markets exhibit fast but volatile expansion.
Developed Markets: Economies like the U.S. or Japan grow at annual rates of around 1–3%. Their mature industrial bases and saturated markets limit further expansion, but the growth is sustained by innovation, services, and technology.
Emerging Markets: Countries such as India and China have historically grown between 5–8% per year, driven by manufacturing, exports, infrastructure, and consumption. The catch-up effect — where developing nations grow faster as they adopt technologies and practices from advanced economies — explains their higher growth rates.
However, this rapid expansion is often accompanied by inflationary pressures, income inequality, and dependency on external capital.
Infrastructure and Industrial Base
Infrastructure is a key determinant of market classification.
Developed Markets: They possess world-class infrastructure, including efficient transportation, advanced energy grids, and digital networks. Industries in these economies are diversified, with a focus on high-value sectors such as aerospace, biotechnology, artificial intelligence, and financial services.
Emerging Markets: Infrastructure development remains a top priority. Many nations are still expanding highways, energy networks, and digital access. Industrialization is often manufacturing-driven, with growth concentrated in textiles, automotive, and electronics sectors. The Make in India initiative or China’s Belt and Road Initiative are prime examples of infrastructure-led growth strategies in emerging economies.
Political and Regulatory Environment
The political and regulatory climate significantly influences investor confidence.
Developed Markets: Typically feature stable democracies, established rule of law, and predictable regulatory systems. This fosters investor trust and reduces systemic risk. Regulatory institutions such as the U.S. Securities and Exchange Commission (SEC) or the European Central Bank (ECB) ensure market integrity and transparency.
Emerging Markets: Political systems vary from stable democracies (India) to authoritarian regimes (China). Policy changes can be abrupt, and corruption or bureaucratic inefficiencies may persist. Currency controls, trade barriers, and sudden regulatory reforms create uncertainty, impacting investment sentiment.
Despite these challenges, emerging markets are progressively adopting governance reforms and digital transparency measures to attract foreign capital.
Financial Markets and Investment Opportunities
Developed Market Dynamics
Developed financial markets are highly liquid and efficient. They are characterized by:
Strong institutional participation (pension funds, mutual funds, hedge funds).
Sophisticated instruments like derivatives, ETFs, and structured products.
Stable interest rates and monetary policies.
Lower transaction costs and higher transparency.
For example, the New York Stock Exchange (NYSE) and London Stock Exchange (LSE) represent mature ecosystems with global influence.
Emerging Market Potential
Emerging financial markets, while less liquid, provide substantial growth potential. Factors such as urbanization, rising consumer demand, and technological leapfrogging create massive investment opportunities in sectors like infrastructure, energy, and digital finance. However, market volatility, limited liquidity, and political interference can heighten risks.
Instruments such as Emerging Market ETFs or sovereign bonds allow global investors to gain exposure while balancing risks. The BRICS economies (Brazil, Russia, India, China, South Africa) collectively represent more than 40% of the world’s population, making them central to global growth narratives.
Currency and Inflation Dynamics
Currency stability and inflation management are central to economic maturity.
Developed Markets: Maintain stable currencies (like USD, EUR, GBP, JPY) supported by independent central banks and deep foreign exchange reserves. Inflation rates typically range from 1–3%, ensuring purchasing power stability.
Emerging Markets: Frequently face volatile exchange rates due to capital flows, current account deficits, or political uncertainty. Inflation can rise rapidly due to supply chain disruptions or weak fiscal discipline. For instance, Argentina and Turkey have experienced persistent inflation crises, while India and Indonesia have improved monetary control through institutional strengthening.
Trade and Global Integration
Emerging markets increasingly drive global trade. They serve as both manufacturing hubs and consumer markets for multinational corporations.
Developed Markets: Have historically dominated global exports in high-tech goods, services, and intellectual property. They also invest heavily in emerging regions to tap into new markets.
Emerging Markets: Are now central to global supply chains. China, often referred to as the “world’s factory,” exports everything from electronics to automobiles. India’s service sector — particularly IT and outsourcing — contributes significantly to global digital trade. However, emerging markets remain vulnerable to trade wars, tariff policies, and commodity price fluctuations.
Demographics and Labor Markets
Demographics form a vital structural difference between emerging and developed markets.
Developed Economies: Often face aging populations, shrinking labor forces, and rising dependency ratios. Japan and much of Western Europe experience demographic challenges that constrain productivity and fiscal stability.
Emerging Economies: Benefit from youthful populations and expanding labor pools. India, for example, has a median age below 30, providing demographic dividends that fuel consumption and innovation. However, unemployment, underemployment, and skill mismatches pose challenges to maximizing this advantage.
Technological and Digital Transformation
Technology acts as a bridge between economic stages.
Developed Markets: Lead global innovation with dominant technology firms (Apple, Microsoft, Amazon). They invest heavily in research, AI, and digital infrastructure.
Emerging Markets: Rapidly adopt new technologies, often leapfrogging traditional stages. The rise of fintech in Kenya (M-Pesa), e-commerce in India (Flipkart), and digital payments in China (Alipay, WeChat Pay) illustrate how innovation in emerging economies can reshape global business models.
Risk and Return Trade-Off
Investors differentiate markets based on the balance between risk and reward.
Developed Markets: Offer predictable but modest returns. Their stability and low-risk profiles make them suitable for conservative investors and institutional portfolios.
Emerging Markets: Present higher growth potential but come with greater volatility. Political instability, currency fluctuations, and weaker governance contribute to risk. Yet, investors seeking alpha — above-average returns — often find emerging markets attractive, particularly during global economic expansions.
Diversification strategies often combine both market types to balance safety and growth.
Impact of Globalization
Globalization has blurred the line between emerging and developed markets. Capital, technology, and labor now flow more freely across borders. Multinational corporations operate seamlessly in both categories, integrating global supply chains. However, globalization also exposes emerging markets to external shocks — such as the 2008 financial crisis or the 2020 pandemic — which can rapidly disrupt capital inflows and currency stability.
Developed markets, on the other hand, face increased competition from low-cost emerging producers, compelling them to innovate and shift toward service- and knowledge-based industries.
Sustainability and ESG Trends
Environmental, Social, and Governance (ESG) factors increasingly define global investment patterns.
Developed Markets: Lead in green finance and sustainability policies. They set global climate standards and promote decarbonization through regulatory frameworks.
Emerging Markets: Confront the dual challenge of sustaining growth while managing environmental impact. Nations like India and Brazil are investing in renewable energy, but limited capital and institutional capacity often hinder progress.
The integration of ESG principles is creating new partnerships between developed and emerging economies, driving sustainable global development.
Future Outlook
The future global economic landscape will likely feature greater convergence between emerging and developed markets. The digital revolution, demographic shifts, and policy reforms are enabling emerging economies to catch up rapidly. Meanwhile, developed markets continue to lead in innovation, capital formation, and governance models.
However, geopolitical tensions, climate challenges, and automation could reshape comparative advantages. The balance of global economic power is gradually tilting toward Asia — particularly China and India — signaling a multi-polar economic order.
Conclusion
The comparison between emerging and developed markets reveals a complex yet complementary global ecosystem. Developed markets offer stability, innovation, and mature institutions, while emerging markets provide dynamism, growth, and opportunity. Both are indispensable to global prosperity.
For investors and policymakers, the key lies in understanding their distinct risk-return profiles, structural differences, and evolving interdependencies. In an interconnected world, the lines between “emerging” and “developed” continue to blur — giving rise to a new era of global economic synergy and shared growth.
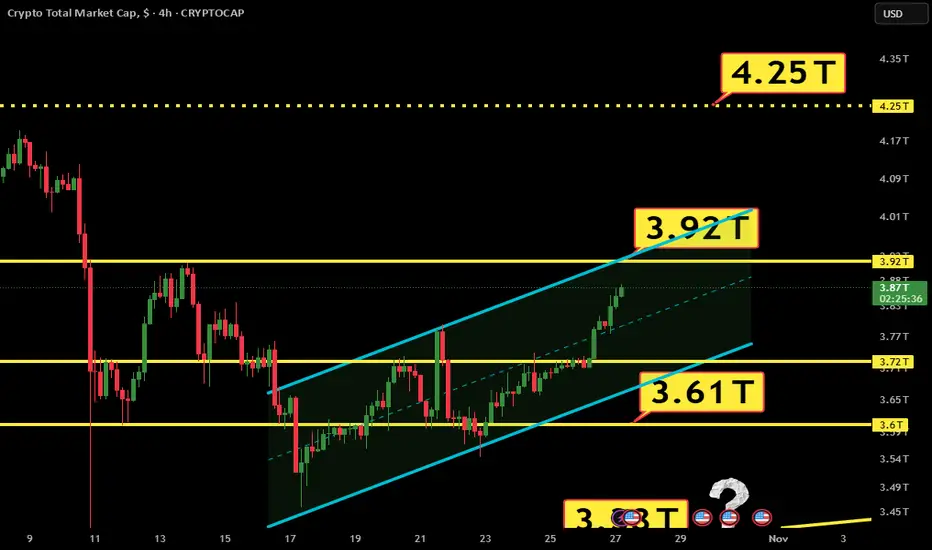
Total is getting close to a major technical crossroads.Total is still moving within the blue channel, now approaching resistance.
If the FED and BOJ events don’t go as expected, we’ll likely head lower within the channel.
But if resistance breaks to the upside, the path toward 4.25 opens wide.
EURUSD: Local Bullish Bias! Long!
My dear friends,
Today we will analyse EURUSD together☺️
The price is near a wide key level
and the pair is approaching a significant decision level of 1.16583 Therefore, a strong bullish reaction here could determine the next move up.We will watch for a confirmation candle, and then target the next key level of 116654.Recommend Stop-loss is beyond the current level.
❤️Sending you lots of Love and Hugs❤️

AUD/JPY SENDS CLEAR BEARISH SIGNALS|SHORT
Hello, Friends!
AUD/JPY pair is trading in a local uptrend which we know by looking at the previous 1W candle which is green. On the 1D timeframe the pair is going up too. The pair is overbought because the price is close to the upper band of the BB indicator. So we are looking to sell the pair with the upper BB line acting as resistance. The next target is 98.106 area.
Disclosure: I am part of Trade Nation's Influencer program and receive a monthly fee for using their TradingView charts in my analysis.
✅LIKE AND COMMENT MY IDEAS✅

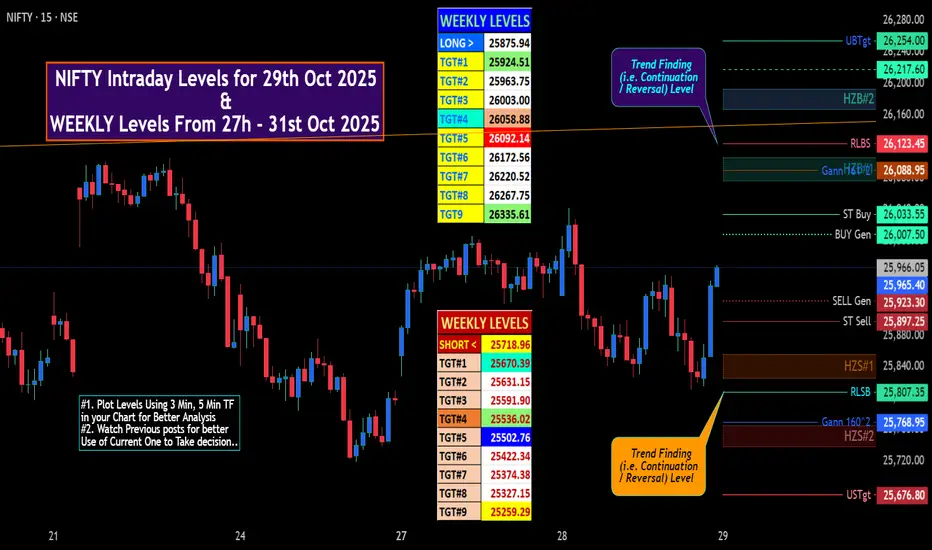
NIFTY IntraSwing Levels for 29th Oct 2025🚀 "WEEKLY Levels" mentioned in BOX format.
🌡️Plot Levels Using 3 Min, 5 Min Time frame in your Chart for Better Analysis
L#1: If the candle crossed & stays above the “Buy Gen”, it is treated / considered as Bullish bias.
L#2: Possibility / Probability of REVERSAL near RLBS & UBTgt
L#3: If the candle stays above “Sell Gen” but below “Buy Gen”, it is treated / considered as Sidewise. Aggressive Traders can take Long position near “Sell Gen” either retesting or crossed from Below & vice-versa i.e. can take Short position near “Buy Gen” either retesting or crossed downward from Above.
L#4: If the candle crossed & stays below the “Sell Gen”, it is treated / considered a Bearish bias.
L#5: Possibility / Probability of REVERSAL near RLSB & USTgt
HZB (Buy side) & HZS (Sell side) => Hurdle Zone,
*** Specialty of “HZB#1, HZB#2 HZS#1 & HZS#2” is Sidewise (behaviour in Nature)
Rest Plotted and Mentioned on Chart
Color code Used:
Green =. Positive bias.
Red =. Negative bias.
RED in Between Green means Trend Finder / Momentum Change
/ CYCLE Change and Vice Versa.
Notice One thing: HOW LEVELS are Working.
Use any Momentum Indicator / Oscillator or as you "USED to" to Take entry.
⚠️ DISCLAIMER:
The information, views, and ideas shared here are purely for educational and informational purposes only. They are not intended as investment advice or a recommendation to buy, sell, or hold any financial instruments. I am not a SEBI-registered financial adviser.
Trading and investing in the stock market involves risk, and you should do your own research and analysis. You are solely responsible for any decisions made based on this research.
"As HARD EARNED MONEY IS YOUR's, So DECISION SHOULD HAVE TO BE YOUR's".
Do comment if Helpful .
In depth Analysis will be added later (If time Permits)
Zec can se more gain 40% gain toward370$Hi
the support and resistances on the chart are based on the previous data and weekly candlesticks if BINANCE:ZECUSDT holds this last support the potential of 40% gain is logical toward 370$

Gold 1H Trend Reversal Setup | 4000 | 4100Market Outlook
Gold has recently shown signs of a potential bullish reversal after breaking above a descending trendline.
The market has shifted from a short-term bearish trend into a possible accumulation phase, with buyers stepping in near 3896–3940 support.
🧭 Technical Breakdown
1️⃣ Structure Break:
Price broke the descending trendline, showing momentum shifting from bearish to bullish control.
2️⃣ Retest Zone:
Retest area 3939–3960 aligns with a previous short-term supply zone, now turning into potential demand.
3️⃣ Target Zone:
If bullish momentum holds, the next major upside target lies between 4120–4160, where higher-timeframe resistance and liquidity exist.
4️⃣ Invalidation Level:
A clean 1H close below 3939 would invalidate this bullish setup and suggest further downside toward 3896.
Trade Idea (Educational Purpose Only)
Parameter Price Level Explanation
Buy Zone 3940–3960 Retest of broken structure
Targets 4040 → 4120 → 4160 Major resistance & liquidity area
Invalidation Below 3939 Break below support invalidates setup
💬 Summary
Gold is setting up for a possible reversal rally, but confirmation is key — wait for a strong bullish candle on retest before considering continuation.
⚠️ This analysis is for educational and discussion purposes only — not financial advice.

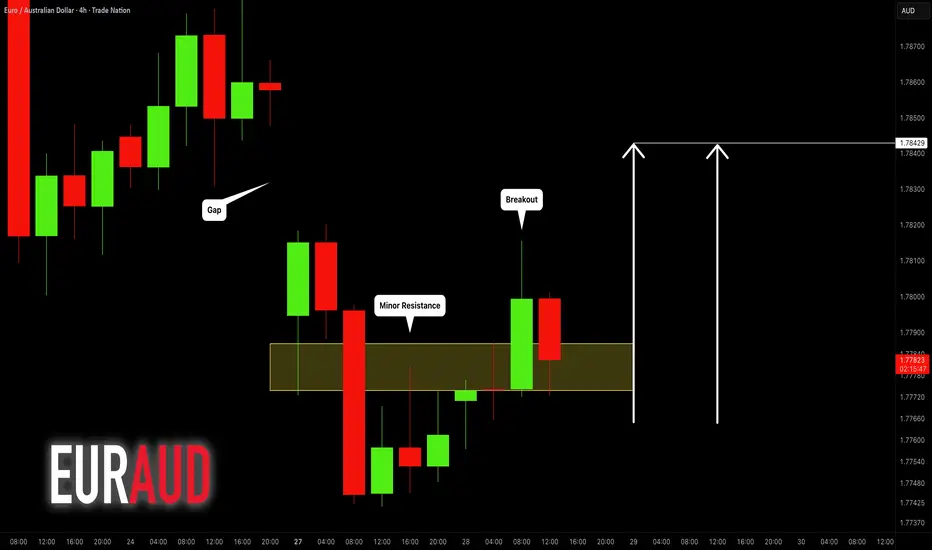
EURAUD: Time to Grow? 🇪🇺🇦🇺
EURAUD is going to fill a gap down opening soon.
I see a strong bullish confirmation with a breakout
of an intraday resistance on a 4H time frame.
Expect a rise at least to 1.482 level.
❤️Please, support my work with like, thank you!❤️
I am part of Trade Nation's Influencer program and receive a monthly fee for using their TradingView charts in my analysis.
$ZEC (4-HOUR): DEAD CAT bounce next, BUYING the dip?CRYPTOCAP:ZEC has dipped 10% in value since my warning post from last night, it was no magic, just decent TA, perhaps. Or maybe luck, who knows.
Jokes aside, 16% down from the ATH made last Monday night ($275), so let me go on a limb and say that another ATH will not happen anytime soon.
No guesswork, I'm basing this thesis on the ELLIOT'S WAVES count, which is pretty clear in #zcash case. The last impulsive wave upwards completed at ATH (that was WAVE 5), I even got a STRONG SELL signal yesterday, and the correction has begun.
So, once the current WAVE A is complete, a WAVE B to the upside is next. Unlikely to break an all-time record again, but could be a good opportunity to LONG.
I'm sticking to my strategy published last night (and quoted here), and watching smaller timeframes. $282 - $304 zone is the most likely area for a reversal back to the upside.
My priority over #zec is #Monero as far as privacy coins go. The narrative is powerful and likely to stay in crypto for a bit.
💙👽
#PrivacyMatters

S&P 500: watching for retestThe S&P 500 is following a pattern of retesting previous highs, with the previous high around $6,194. The retest usually starts when RSI is overbought and shows bearish divergence with price. Although there isn't a divergence with RSI yet, it is entering overbought territory, so it’s important to watch this closely.

EURJPY the sell is open and soon dump will leadTechnical analysis of the EUR/JPY chart identifies the 178.00 level as a critical resistance zone. Price action is currently testing this level while simultaneously encountering selling pressure from a key descending trendline, creating a significant technical confluence.
This convergence of resistance factors increases the probability of a bearish rejection. A confirmed break below the immediate support level following this test would validate the bearish outlook.
The measured move projection from this potential reversal pattern suggests a minimum downward target of 500 pips. A strategic short position may be considered upon bearish confirmation, with a stop-loss placed above the 178.00 resistance confluence to manage risk effectively.
DISCLAIMER: ((trade based on your own decision))
<<press like👍 if you enjoy💚
