No Bearish Divergence yet on Shorter TF.
No Bearish Divergence yet on Shorter TF.
Good Support is around 465 - 467.
However, Crossing 520 with Good Volumes
may lead it towards 600+
Even In worst case, it should not break 400.
Contains image

Watching Volume Clusters for Short Opportunities on NZD/CADThe OANDA:NZDCAD pair is respecting a clear bearish market structure on the weekly timeframe. Price remains below the Ichimoku cloud (Span A at 0.8081 and Span B at 0.8218), confirming ongoing bearish momentum.
Price is now hovering around the Point of Control (POC) from the volume profile of the last major move — between 0.822 and 0.815, an area of high transaction activity and potential resistance. This zone presents a valid area to initiate short positions, especially given the lack of bullish breakout.
However, the optimal supply zone lies slightly higher between 0.823 and 0.838, which also corresponds to the second-highest volume node in the current range. If price pushes into this area and shows rejection, it may offer a cleaner entry for higher reward setups.
The target for this bearish scenario is the previous swing low at 0.7687, which marks a significant support level. The invalidating level for the bearish bias is a break above 0.8480, which sits above the recent structural high.
Trade Setup Summary:
Short Entry Zone 1 (aggressive): 0.822 – 0.815 (POC area)
Short Entry Zone 2 (optimal): 0.823 – 0.838 (supply zone)
Stop Loss: Above 0.8480
Target: 0.7687
The TSI indicators are near neutral but slightly negative:
TSI(10): -0.13
TSI(20): -0.04
This confirms the bearish pressure remains, but the move is not oversold, leaving room for further downside continuation.
The New Zealand dollar remains under pressure due to softening economic data and expectations of dovish monetary policy from the RBNZ, while the Canadian dollar has recently found support from stronger oil prices and relatively stable BoC guidance. Although both currencies are commodity-linked, CAD's correlation with energy gives it an edge in current conditions. As long as this divergence holds, the bias on NZD/CAD remains to the downside, in line with the current technical structure.
Disclaimer: This content is for educational and informational purposes only. It does not represent financial advice or a recommendation to buy or sell any financial instrument. Trading involves risk, and you should only trade with money you can afford to lose.

Bullish on Monthly TF.
Bullish on Monthly TF.
17.71 is the Monthly Resistance.
Immediate Support is around 16.80 - 17
Breaking 15 will bring more pressure towards
is around 13.50
Upside Targets once 17.71 - 17.80 is Crossed,
can be around 22 - 23

Hidden Bullish Divergence on Weekly TF.Hidden Bullish Divergence on Weekly TF.
Crossing & Sustaining 44.20 may lead it
towards 55 initially & then towards 65 -70 -80
if there wont be any Bearish Divergence.
But if it closes below 30, more Selling Pressure
can be seen.

AUD/JPY at Key Demand Zone, Watching for Trend ContinuationOANDA:AUDJPY is showing signs of a bullish reaction from the key support zone between 89.00 and 86.00, an area that has acted as demand multiple times in the past. Price remains below the Ichimoku cloud (Span A at 92.13, Span B at 96.63), but the structure is still technically bullish as long as the current support holds.
The Trend Strength Index (TSI) indicators are deep in oversold territory:
TSI(10): -0.83
TSI(20): -0.86
This signals that bearish momentum is weakening, and a bounce is likely if the support zone continues to hold. The market could now aim to retest the 97.47 – 100.73 resistance area, which aligns with the cloud base and recent structural highs.
A bullish breakout above 100.73 would confirm a continuation of the bullish trend, with a potential new higher high toward 109.17 — the previous major swing high.
On the other hand, if price breaks below 86.00, the bullish structure would be invalidated, possibly marking the beginning of a trend reversal and opening the door for deeper declines.
Scenarios to Watch:
Bullish Continuation (If Support Holds)
Entry from: 89.00–86.00
Resistance/TP zone: 97.47 – 100.73
Break above 100.73 targets: 109.17
Structure remains bullish above 86.00
Bearish Breakdown
Break and close below 86.00 invalidates the bullish thesis
Retest of broken support may act as resistance
Lower lows expected if support fails
AUD/JPY is a cross driven by risk sentiment and yield differentials. The Reserve Bank of Australia has adopted a cautious stance, holding rates steady while keeping the door open for tightening if inflation picks up. Meanwhile, the Bank of Japan maintains an ultra-loose policy, though speculation about a slow shift toward normalization is growing. As a result, AUD/JPY remains sensitive to shifts in risk appetite and global yields. A continued risk-on environment would support AUD strength and help maintain the bullish structure — but any risk-off sentiment or sudden JPY strength could quickly shift the pair lower.
Disclaimer: This content is for educational and informational purposes only. It does not represent financial advice or a recommendation to buy or sell any financial instrument. Trading involves risk, and you should only trade with money you can afford to lose.

No Bearish Divergence on Monthly Tf.No Bearish Divergence on Monthly Tf.
But 39-40 is a Very Strong Resistance
that needs to Cross & Sustain with Good Volumes to
reach 45 - 46 & then 50+
We should not ignore that it has taken Support
from a Very Important Fib level around 32.40
Monthly Closing above 33.60 would be a Very Healthy sign.
So any dip towards 32.50 - 33.50 can be a Buying Opportunity.
However, it should not break 31.80 otherwise we
may witness further Selling Pressure towards 28.50 - 28.70

Play Wisely
Monthly Closing above 22.80 - 23 would
be a positive sign.
Note that there are few Resistances till
28 & the stock will start a Bullish Momentum once
it will Cross 28 with Good Volumes.
and if 21.70 breaks, we may find a Strong
Support around 20 - 20.10

Defined Resistance Zone465 - 502 is a Resistance Zone.
Those who are already holding it, should keep
the Stoploss of 339.
Fresh Entrants may wait for 502 to Cross & Sustain
targeting 545 - 550 & then 600 - 650.

Range Play on GBP/CHF – Buy Support, Sell ResistanceThe OANDA:GBPCHF is sitting on a strong weekly support zone between 1.0900 and 1.0600, where previous bullish reactions have occurred. The current price is also below the Ichimoku cloud (Span A at 1.1055 and Span B at 1.1203), indicating bearish conditions in the medium term.
Both TSI indicators are in oversold territory:
TSI(10): -0.7
TSI(20): -0.3
This setup suggests a possible short-term bounce from current levels, especially considering price is testing the bottom of the long-established range. If the market reacts bullishly, the supply zone between 1.1400 and 1.1650 becomes a high-probability area to watch for short entries, as it aligns with prior rejections and sits just below the cloud.
However, if price breaks below 1.0600, the structure would turn fully bearish. In that case, we would expect a retest of the broken support followed by continuation to the downside, confirming a possible longer-term downtrend.
Bullish Rejection (Short Setup Later)
Long-term resistance: 1.14 – 1.1650 (supply zone)
Short bias from this zone with stop above 1.1650
Downside targets: 1.09, then 1.06
Bearish Breakdown
Break of 1.0600 invalidates bounce scenario
Watch for retest and continuation lower
Structure supports deeper bearish move toward psychological levels near parity
GBP/CHF remains sensitive to both UK and Swiss economic signals. The Bank of England is currently under pressure due to slowing inflation and stagnant growth, which may push it closer to rate cuts. Meanwhile, the Swiss National Bank (SNB) already began cutting rates in early 2024, weakening the franc slightly, though safe-haven flows still support CHF during global uncertainty. This creates a mixed environment for GBP/CHF: structurally bearish but with room for short-term rebounds, especially if UK macro data stabilizes.
Disclaimer: This content is for educational and informational purposes only. It does not represent financial advice or a recommendation to buy or sell any financial instrument. Trading involves risk, and you should only trade with money you can afford to lose.

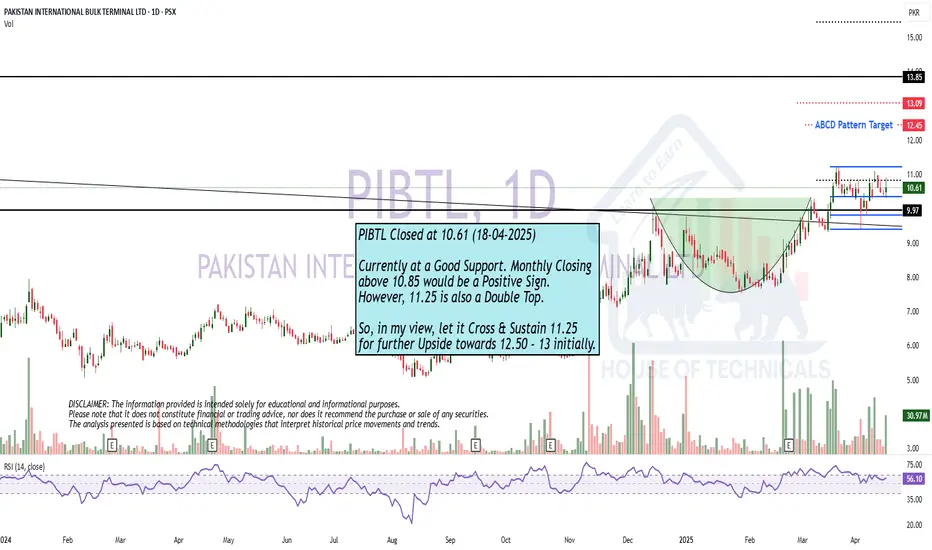
Monthly Closing MattersCurrently at a Good Support. Monthly Closing
above 10.85 would be a Positive Sign.
However, 11.25 is also a Double Top.
So, in my view, let it Cross & Sustain 11.25
for further Upside towards 12.50 - 13 initially.
Potential Long Setup Forming as USD/JPY Tests DemandThe FX:USDJPY is showing a deep correction within a bullish long-term structure. Price is now below the Ichimoku cloud (Span A and B at 149.22), which reflects bearish momentum in the short term. However, the market is approaching a strong weekly demand zone between 142.00 and 137.00, where previous bullish rallies were initiated.
Both Trend Strength Index (TSI) values are well into oversold territory:
TSI(10): -0.85
TSI(20): -0.81
This indicates that bearish momentum may be nearing exhaustion, and a reversal or bounce is increasingly likely. The zone between 142.00 – 137.00 becomes a key area to watch for bullish reaction, potentially offering a high reward-to-risk opportunity for long setups.
If the price reacts from this demand zone, the next major resistance lies between 148.00 – 151.77, which aligns with the bottom and mid-section of the Ichimoku cloud and past structural levels. Further upside potential extends toward 161, a previous swing high.
Trade Setup Idea:
Long Entry Zone: 142 – 137 (demand zone)
TP1: 148 – 151 (resistance + cloud structure)
TP2 (extended): 161
SL: Below 137
The structure supports a bullish continuation if this zone holds, making it a key region for swing buyers.
The Japanese yen continues to weaken as the Bank of Japan maintains ultra-loose monetary policy, in contrast with the Federal Reserve’s more hawkish stance. Although U.S. rate cut expectations have increased for late 2025, strong labor and inflation data from the U.S. have kept the dollar supported. In contrast, Japan’s inflation remains soft, and no strong signs of BoJ tightening have emerged. This divergence in monetary policy keeps the USD/JPY biased to the upside, especially if yields in the U.S. stay elevated.
Disclaimer: This content is for educational and informational purposes only. It does not represent financial advice or a recommendation to buy or sell any financial instrument. Trading involves risk, and you should only trade with money you can afford to lose.

GTC Eyes Reversal from Accumulation Base GTC/USDT is bouncing off a long-term descending channel’s base, showing possible signs of accumulation. A move toward the $0.55–$0.75 supply zone is expected, with a potential breakout targeting $2.23 if momentum sustains. We must pay a close attention to a breakdown below $0.248 which will open a downward move towards $0.074 as final and critical support.

Bitcoin on Edge: US Deregulates, China Cracks DownHello,
Bitcoin Bearish Outlook – April 2025
Market Structure & Technical Overview
Bitcoin continues to underperform as a safe haven asset, falling short of the optimism once compared to gold. Following a consistent formation of lower highs, BTC has once again broken down—hinting at a potential continuation of this bearish trend.
Current Price: Just below the 1M Pivot Point (PP) at $84621.067.
This area is crucial — if price accepts this level as resistance, we are likely to see further downside.
The most recent 1M high stands at $88,781.70 — a level to watch but currently being respected as a ceiling.
Should the price fail to reclaim 84k, the next target is the 1Y PP at $80,283.483. A rejection here opens the door for a move toward strong 1M support at $72,345.065.
Below that, 1Y PP structural support comes into question. If the support gives out, the maximum decline target sits near $56,000, which would represent a full reset of the bullish macro narrative.
Fundamental Headwinds: A Storm Brews
Trump's Latest Move: President Trump has repealed the IRS rule expanding the "broker" definition to decentralized exchanges, a move aimed at deregulating crypto and laying groundwork for a potential U.S. Bitcoin reserve.
China’s Crackdown Intensifies:
China’s courts and local governments are actively liquidating seized crypto through offshore channels.
The lack of a centralized system raises corruption concerns, but near-consensus is forming around formal asset recognition and centralized liquidation.
Despite a domestic ban, China holds 15,000 BTC, potentially making it the 14th largest holder globally.
The decentralized anonymity principle of cryptocurrency is under increasing threat, as both China and the U.S. shift toward centralized control, regulation, and even reserve-building strategies. This movement contradicts the original ethos of Bitcoin, leading to a bearish sentiment among long-term holders.
Sentiment Snapshot
Metric Status
Technical Structure Bearish
Market Sentiment Neutral, leaning bearish
Macro Fundamentals Bearish
Key Resistance (1M PP) $84,621.067
Next Support (1Y PP) $80,283.483
Strong Support (1M) $72,345.065
Max Decline Scenario $56,000
📉 Mark these key levels:
$88,781.70 – Previous 1M High
$84,621.067– 1M Pivot (Current Resistance)
$80,283.483 – 1Y Pivot (Mid Support)
$72,345.065 – 1M Strong Support
$56,000 – Max Bearish Target
Overlay sentiment zones:
Green (above FWB:88K ): Bullish
Orange (between $80k– FWB:88K ): Neutral
Red (below $80k): Bearish Continuation
The Support and Resistance outlined in green and red are the respective support/resistance for this pair currently for 1M-1Y timeframes!
No Nonsense. Just Really Good Market Insights. Leave a Boost
TradeWithTheTrend3344

GOLD HITS RECORD $3,300/OZ – WHAT IS IT TELLING US?Since 2020, stocks and gold have danced to very different rhythms. Initially, equities ran far ahead, but now… the tide is turning fast.
📉 As the equity market sinks into a bear phase, capital is pouring into gold.
Just in the last 9 months, gold has surged over $1,000/oz — a historic move rarely seen outside of crisis periods.
💬 We’ve been calling this for over a year: Gold is now the ONLY global safe haven.
US bonds are no longer the refuge they once were. Investors are voting with their wallets — and gold is winning.
Let’s put it into perspective:
➡️ Over the last 20 years:
• Gold is up +620%
• S&P 500 is up +580%
📈 Gold is trading like we’re in a modern depression — quietly pricing in risk, instability, and loss of trust in traditional instruments.
🧠 The question is no longer "why is gold rising?" — it’s "why didn’t more people see this coming?"

Bullish Rounding Bottom!📈 GHST Update – Bullish Rounding Bottom! 🚀
👀 GHST has formed a bullish rounding bottom. If breakout red resistance zone target green line level.
🔑 We are waiting for a breakout above the red resistance zone to target the green line level.
Keep a close eye on GHST!

Breaking: $FARTCOIN Gearing For A Breakout To 1 Bln Market CapThe price of fartcoin has been surging consecutively, but failed to break the $1 pivot or resistant point withholding the asset from breaking the $1 billion market threshold.
The memecoin was created on the Solana blockchain through pump.fun, shortly after the community took over the project making it graduate to Raydium- a DEX on Solana ecosystem. Gaining momentum, the asset was listed on few CEX like Kucoin, GateIo, BingX, etc.
Fartcoin ($FARTCOIN) has made 3 attempts to break pass the $1 resistant but each move was denied making the asset to form a short-term head and shoulder pattern. while the asset is consolidating after the recent fit, failure to break the $1 resistant for $FARTCOIN might resort to a retracement to the $0.60 support point before picking liquidity up for a reversal.
Fartcoin Price Data
The Fartcoin price today is $0.760227 USD with a 24-hour trading volume of $292,550,722 USD. Fartcoin is down 15.66% in the last 24 hours. The current CoinMarketCap ranking is #77, with a market cap of $760,225,448 USD. It has a circulating supply of 999,998,256 FARTCOIN coins and a max. supply of 1,000,000,000 FARTCOIN coins.

BTC Box Range Low, long alternative daily path As a perp long im looking to take here; I shared a plan at the doji bullish OB if it loses the box range low, another shot for me is at 84K after a sweep, BTC is looking strong here, the daily pattern here is one I have backtested and presents more often in LTF, box range low can provide a good opportunity to long to the liquidity. Again, invalidation is tight and simple, watching out for Sunday as we are currently in sell off weekends, especially on Sundays

DOGEUSDT Potetial DownsidesHey Traders, in today's trading session we are monitoring DOGEUSDT for a selling opportunity around 0.17000 zone, DOGEUSDT is trading in a downtrend and currently is in a correction phase in which it is approaching the trend at 0.17000 support and resistance area.
Trade safe, Joe.

Celsius Holdings Outperforms Market with Strong YTD GainsCelsius Holdings Inc. (CELH) continues to attract significant investor attention, closing at $37.24 on April 17, up $0.58 (1.58%). The functional energy drink maker has delivered impressive year-to-date returns of 41.38%, substantially outpacing the S&P 500's 10.18% gain during the same period.
For the current quarter, analysts expect earnings of $0.20 per share, representing a 25.9% year-over-year decline. However, consensus estimates have improved dramatically with a 32.8% upward revision over the last 30 days. The full-year outlook appears more favorable, with projected earnings of $0.99 per share indicating a 41.4% annual increase, followed by 15.1% growth to $1.14 per share next fiscal year.
Current quarter sales are expected to decline slightly to $345.26 million (-2.9%), but full-year revenue estimates show robust growth of 55.3% to $2.1 billion, followed by 19.4% growth next fiscal year. Celsius has demonstrated strong execution recently, beating earnings estimates in three of the last four quarters.
Technical Analysis
Technically, the chart shows a strong recovery from its $21.10 low. Price has recently broken above the 50-day moving average but remains below the 200-day moving average, suggesting improving momentum within a longer-term downtrend. Key resistance appears around $47-49, marked by a horizontal level that previously acted as support.
Volume has increased during recent price advances, adding credibility to the current uptrend. The next major challenge will be overcoming the $49 resistance zone before potentially continuing toward higher targets as indicated in the chart projection. If price faces rejection, it is likely to drop back to support at around $25.

Gold's Glory Fades: Bearish Setup in MotionHello,
🟥 XAUUSD – Pro Bearish Playbook
Resistance Breached, But the Rally Looks Exhausted
Gold (XAUUSD) has just smashed through the 1M strong resistance at 3272.314, but let’s not kid ourselves — this move is running on fumes. The rally is heavily overbought, and macro sentiment is shifting fast.
🗞 Macro Trigger: Tariff War Cooling
President Trump has thrown a curveball, suggesting the U.S. may hold off on further tariff hikes, citing concerns about the impact on American consumers.
“At a certain point, people aren’t gonna buy,” he said.
He’s not ruling out new tariffs entirely, but the tone has clearly softened. Even China is stepping back, opting not to match U.S. hikes — and now the TikTok deal is on pause until trade talks settle. This reduces geopolitical risk, and that’s a red flag for gold bulls.
📉 Why We're Bearish:
Overbought Conditions: Gold is bloated. RSI, momentum, and fundamentals all scream “top-heavy.”
Safe-Haven Demand Shrinking: With tariffs cooling and equities catching a bid, gold demand is set to fade.
False Breakout Potential: The push above 3272.314 may be a trap if we don’t get follow-through.
🧭 Bearish Strategy – The Breakdown Plan
We’re not just throwing darts — here’s how we map the fall:
🔻 Level 💰 Price 📌 Role
🟧 1D Pivot Point Use live data Key trigger – watch for bearish confirmation below here.
🟨 1M Resistance (Now Suspect Support) 3272.314 Already breached; likely won’t hold on retest.
🟥 1W Pivot Point 3146.658 Next major target if momentum continues.
🚨 Bear Max Target 2466.313 Full breakdown scenario if risk-off vanishes.
🔥 Execution Plan – What to Do
✅ Wait for confirmation below 1D Pivot.
🔻 Short the rejection at 3272.314 if it acts as resistance on retest.
🎯 Target 3146.658, then trail stops toward 2466.313 on continued weakness.
🚫 Avoid blind entries – confirmation only. This isn’t guesswork.
We’re not chasing gold higher at these levels. We’re waiting for the turn, and when it confirms — we strike.
The Support and Resistance outlined in green and red are the respective support/resistance for this pair currently for 1M-1Y timeframes!
No Nonsense. Just Really Good Market Insights. Leave a Boost
TradeWithTheTrend3344

EURUSD Sell - 240 PIPsI think the EU is getting ready to drop for about 240 pips. I have two entries on this trade and my second entry should be activated in about 30 pips.

Keurig Dr Pepper Holds Steady Ahead of Quarterly EarningsKeurig Dr Pepper (KDP) shares have shown resilience in recent weeks, climbing 5.9% over the past month while the broader S&P 500 declined by 6.9%. The beverage giant currently trades at $35.40, up $0.29 (0.83%), with 13.96 million shares traded. Analysts maintain a consensus "Hold" rating as KDP approaches its upcoming earnings announcement.
Wall Street expects the company to report earnings of $0.38 per share, unchanged from the year-ago quarter, while revenue is projected to reach $3.56 billion, representing a 2.8% year-over-year increase.
The company has seen minor positive revisions to its earnings estimates, with consensus EPS projections increasing by 0.1% over the past 30 days. This modest upward adjustment could signal improving analyst sentiment about KDP's near-term performance.
Breaking down the revenue expectations by segment, analysts forecast U.S. Refreshment Beverages will lead growth at $2.23 billion, up 6.6% year-over-year. Meanwhile, U.S. Coffee is expected to contract slightly to $884.51 million (-2.9%), and International sales may decrease to $448.32 million (-3.4%).
Technical Analysis
From a technical perspective, KDP has established an ascending trend line since reaching a low of $30.12. The stock currently trades above both its 50-day, 100-day and 200-day moving averages, suggesting positive momentum. The chart shows resistance around the $36 level, with support at the trend line near $33.60. Trading volume has increased during recent uptrend, potentially indicating stronger buyer conviction.

Bitcoin Dominance Quick UpdateThe high happened in February 2025. 7-April produced a lower high.
The session that produced the lower high is also a hammer. A hammer here can indicate an upcoming change of trend.
As long as BTC.D remains below 64% it has a very high probability of starting a descent.
If BTC Dominance moves and closes daily above 64%, this analysis and signals become invalid.
If the BTC.D hovers below 64%, the longer it stays below this level the weaker it becomes.
When this index goes down, everything Cryptocurrency grows, including Bitcoin.
It will be very interesting to see how it all develops. More and more signals are pointing toward an Altcoins market bullish wave developing now, not later. Do you agree?
Thank you for reading.
Namaste.
