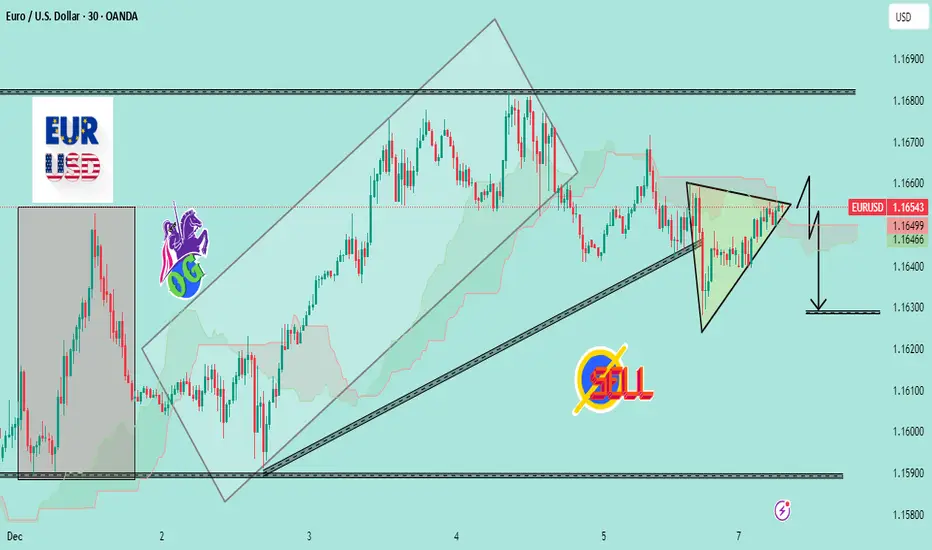
EURUSD Coiling for Breakdown — Triangle Ready to Crack📉 EURUSD Analysis — Bearish Breakout Setting Up
EURUSD is trading inside a tight symmetrical triangle after breaking its previous ascending channel. Price is compressing right under the Ichimoku cloud, showing weak buying momentum.
The structure suggests a bearish continuation:
The uptrend channel is already broken, shifting market bias from bullish to neutral–bearish.
Price is repeatedly getting rejected at the triangle’s upper boundary — showing sellers defending the level.
The cloud is flat and thin, signaling lack of bullish strength.
A clean break below the triangle support should trigger downside continuation toward the next demand level.
📌 Bearish Trigger
A breakout below 1.1640 with momentum confirms the sell.
🎯 Downside Target
TP: 1.1630 zone (marked on chart)
⚠ Invalid Setup
If price breaks above the triangle and closes inside the previous range, the bearish setup weakens
Contains image
Wait for Valid Breakout!2223
Closed at 96.10 (08-12-2025)
Important to Sustain 97 - 97.50 for further upside.
Immediate Resistance seems to be around 104 - 105.
Breaking 84 may bring more selling pressure.

Weekly Bullish Divergence4349
Closed at 8.21 (08-12-2025)
Weekly Bullish Divergence is appearing so Crossing 8.30 - 8.50 may bring a
Good Upside move.
Immediate Resistance can be around 8.80 - 9.20 & then around 10.
However, if 8 is broken, we may witness further selling pressure towards 7 - 7.21

GBPCHF FREE SIGNAL|SHORT|
✅GBPCHF price has tapped into a higher-timeframe supply zone after running buy-side liquidity above recent swing highs, creating an ICT bearish rejection that shifts order-flow toward discount levels and favors a corrective move lower.
—————————
Entry: 1.0754
Stop Loss: 1.0782
Take Profit: 1.0710
Time Frame: 6H
—————————
SHORT🔥
✅Like and subscribe to never miss a new idea!✅

EUR-AUD Free Signal! Sell!
Hello,Traders!
EURAUD has broken out beneath the horizontal supply area after distributing at premium, sweeping buy-side liquidity and shifting order-flow decisively bearish. This SMC breakout favors continuation lower toward the next discount zone.
--------------------
Stop Loss: 1.7602
Take Profit: 1.7510
Entry: 1.7559
Time Frame: 6H
--------------------
Sell!
Comment and subscribe to help us grow!
Check out other forecasts below too!
Disclosure: I am part of Trade Nation's Influencer program and receive a monthly fee for using their TradingView charts in my analysis.

Lvvausdt heading towards strong supportLVVAUSDT appears to be heading toward the main demand zone, potentially completing a mid-term round-bottom formation. The plan is to accumulate within the outlined buy zone and monitor price reaction near the main supply area. A confirmed breakout above this level could trigger stronger momentum toward the final target around $0.033589.

Confluent (NASDAQ: $CFLT) Surges on $11B IBM Deal TalksConfluent Inc. (NASDAQ: CFLT) surged nearly 28% in premarket trading after reports from The Wall Street Journal indicated that IBM is in advanced talks to acquire the real-time data-streaming company for approximately $11 billion. The move would represent one of IBM’s largest strategic pushes into cloud infrastructure and artificial intelligence, reinforcing the company’s ambition to strengthen its enterprise-grade data capabilities.
Confluent, valued around $8.1 billion prior to the report, plays a critical role in enterprise data modernization. Its platform powers real-time data pipelines at massive scale—technology increasingly essential for companies deploying generative AI and high-speed analytics workflows. IBM, with a market cap of roughly $288 billion, sees real-time event streaming as a foundational layer for AI, hybrid cloud, and automation growth segments.
Sources noted that a formal announcement could come as early as Monday, though negotiations remain fluid and deal terms are not finalized. Neither company has issued public comments. Analysts highlight that enterprise-software consolidation has accelerated in 2025 as competition intensifies around AI infrastructure, with large technology firms increasingly seeking to acquire mission-critical data-handling platforms.
The report follows earlier coverage from Reuters, revealing that Confluent began exploring strategic alternatives in October and retained financial advisers to assess options. Investors will now focus on whether IBM’s offer materializes and whether final pricing reflects Confluent’s strong growth trajectory and essential role in AI-driven data ecosystems.
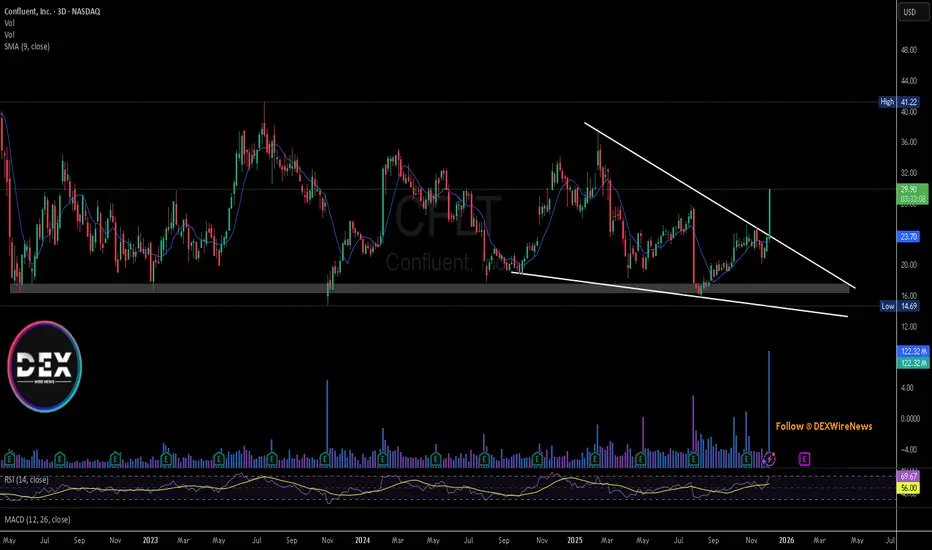
Technical Analysis
The chart shows CFLT breaking out strongly from a long-term descending wedge pattern, fueled by a surge in volume—the highest in several months. Price has cleanly reclaimed the key $23–$24 resistance level and surged toward $30. RSI pushes toward overbought territory, reflecting aggressive momentum.
If the breakout sustains, the next major target sits near $41, the high of 2023. However, failure to hold above former resistance may lead to a pullback toward the breakout zone around $23. The structure supports a bullish continuation as long as price stays above the wedge.
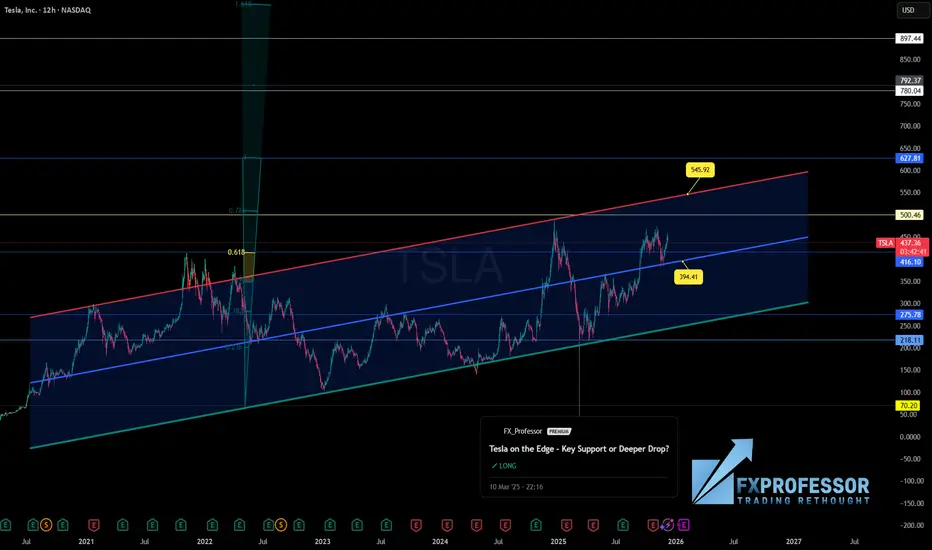
Key Support Worked, but What’s Next for TSLA? 📈 Tesla on the Edge — Key Support Worked, but What’s Next for TSLA? 🔍
Earlier this year, we tagged a textbook support at $218, right on the lower boundary of this macro regression channel — and price respected it beautifully. We’re now trading +100% above that level, just below the $500 psychological barrier and brushing the 0.618 retracement from the all-time high.
Current Key Levels:
• Support: $394.41 and $380.55 — both dynamic mid-channel
• Resistance: $500.46 and upper channel at $545.92
• Fib Golden Ratio: 0.618 zone still acting as macro resistance
Price is clearly in a pause zone — not bearish yet, but no longer early either. The rally from $218 to $440+ matured fast. Momentum may need to cool off unless we get new catalyst fuel.
🔋 Enter the newsflow:
Tesla is pushing hard on a dual front — lower vehicle prices (Model 3 Standard) to protect sales volume, and ambitious bets on AI + autonomy (FSD 14.2, robotaxi rollout). Musk’s recent push to allow "texting while driving" under FSD has regulators watching closely — and so are we.
This means Tesla isn’t just reacting — it’s recalibrating. The market’s trust in these moonshots (robotaxi, Optimus, autonomy) could define the next leg.
Bull Path? Break $500–545 and Tesla could target $627 or even $780+
Bear Path? Lose $394–380 and we likely retest the $275 zone
📉 For now, I expect sideways compression between $380–500 as macro narrative battles chart structure.
Thought of the Day 💡
Most traders get stuck chasing late moves. But if you map the macro channel, learn to wait for value zones, and stay calm when price goes vertical — you’ll separate yourself from the herd. TSLA’s big move already happened. Now comes the patience game.
Disclaimer: What you read here is not financial advice — it’s high-level market philosophy from the FXPROFESSOR himself. Risk is real, and your capital is your responsibility. Learn, adapt, evolve.
Strategy Inc. (NASDAQ: $MSTR) Boosts BTC With $963M BuyStrategy Inc. (NASDAQ: MSTR), the largest publicly traded holder of Bitcoin, expanded its BTC reserves with a major purchase of 10,624 BTC valued at approximately $962.7 million between December 1–7. This marks the company’s largest weekly acquisition since mid-year, signaling renewed confidence as Bitcoin volatility stabilizes. Strategy accumulated the new BTC at an average cost of $90,615, lifting its total holdings to 660,624 BTC purchased for roughly $49.35 billion. At current market prices near $94,000, the stash is now worth about $60.5 billion, translating to an estimated $11 billion in unrealized gains.
The purchase was funded through Strategy’s at-the-market equity program. The company raised $928.1 million through the sale of 5.13 million common shares and $34.9 million through the sale of 442,536 preferred shares. With more than $39 billion in unused issuance capacity across several securities, Strategy continues to position itself as a Bitcoin-focused structured finance entity with significant capital-raising flexibility. Executive Chairman Michael Saylor also highlighted the firm’s BTC Yield metric—up 24.7% year-to-date—which measures Bitcoin growth per diluted share and reinforces Strategy’s long-term accumulation model.
Shares of MSTR saw a modest rebound, gaining roughly 2% after recently dropping near $155 on December 1 following broad weakness in crypto-linked equities. Despite short-term improvements, MSTR remains down more than 50% over the past six months as investors reassess risk across digital-asset equities.
Technical Analysis
The chart shows MSTR rebounding strongly from the $155 support zone, with price reclaiming the horizontal support area. The RSI sits in oversold territory, showing early momentum recovery. Price action suggests the potential for a corrective bounce toward the descending trendline near $300–$330. However, the broader trend remains bearish as long as price stays below the long-term downtrend line. A break above the trendline would indicate a structural reversal, while a rejection may send the stock back toward support.

TSMC Maintains Consensus Buy Rating With Over 20% Upside to $355Taiwan Semiconductor Manufacturing Company (NYSE: NYSE:TSM ) continues to reinforce its position as the world’s most critical chipmaker, with Wall Street maintaining a consensus Buy rating and pointing to more than 20% upside toward the $355 median target. The bullish outlook is supported by broad-based strength across AI, mobile, and high-performance compute, as well as surging demand for advanced packaging.
Recent headlines have also placed TSMC in the center of a high-profile legal case. On November 25, TSMC filed a lawsuit against former senior VP Wei-Jen Lo—now at Intel—asserting violations of non-compete and trade-secret laws. Prosecutors later searched two residences and seized devices as part of a national-security investigation. Intel rejected the allegations, insisting its internal IP safeguards remain intact. Analysts note that the dispute underscores the strategic importance of TSMC’s advanced-node R&D.
Fundamentally, the biggest driver remains AI infrastructure. Bernstein raised its target to $330 for the ADR, citing explosive demand for CoWoS packaging, which is expected to reach 125,000 wafers/month by 2026. The firm models revenue growth of 23% in 2026 and 20% in 2027, supported by N2 adoption, N3 pricing, and improving smartphone demand. EPS is projected to grow at 20% CAGR through 2027 despite elevated capex.
Technical Analysis
TSM continues to respect its long-term ascending trendline, maintaining a strong bullish structure. Price recently bounced cleanly off trendline support around the $285–$290 region. The stock is consolidating beneath its $311 resistance zone, forming higher highs and higher lows.
RSI remains elevated yet stable, showing momentum is intact without signaling major exhaustion. A breakout above $311 could open a clear path toward $330–$355, aligning with analyst targets. Trendline support now sits near $291.

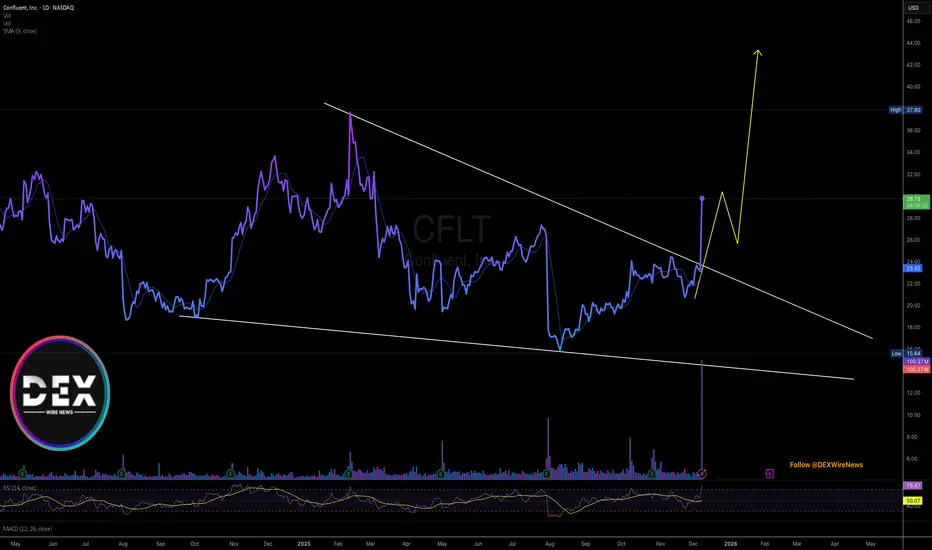
Breaking: Confluent, Inc. (NASDAQ; $CFLT) Spike 28% Today Confluent, Inc. (NASDAQ; NASDAQ:CFLT ) experience a noteworthy uptick of 28% today amidst amidst breaking out of a bullish symmetrical triangle pattern.
The asset broke the ceiling of the triangle near the $23 resistant aiming for a move to the $50 resistant. However, with the RSI at 78, the asset might col off a bit at the ceiling it recently broke in order to pick liquidity up.
In recent news, Confluent, Inc. (NASDAQ: CFLT), today announced they have entered into a definitive agreement under which IBM will acquire all of the issued and outstanding common shares of Confluent for $31 per share, representing an enterprise value of $11 billion. Confluent provides a leading open-source enterprise data streaming platform that connects, processes and governs reusable and reliable data and events in real time, foundational for the deployment of AI.
IDC estimates that more than one billion new logical applications will emerge by 20281, reshaping technology architectures across industries. To fuel meaningful outcomes and drive productivity in operations, these applications, as well as AI agents, need access to connected and trusted data – in real time. IBM and Confluent will enable end-to-end integration of applications, analytics, data systems and AI agents to drive intelligence and resilience in hybrid cloud environments.
About CFLT
Confluent, Inc. operates a data streaming platform in the United States and internationally. The company provides platforms that allow customers to connect their applications, systems, and data layers comprising Confluent Cloud, a managed cloud-native software-as-a-service (SaaS); and Confluent Platform, an enterprise-grade self-managed software.
Paramount makes $108.4 billion bid for Warner Bros DiscoveryParamount Skydance (NASDAQ: NASDAQ:PSKY ) shocked the entertainment world with a hostile $108.4 billion all-cash takeover bid for Warner Bros. Discovery, setting up a dramatic showdown with Netflix. The bid challenges Netflix’s earlier $72 billion deal and positions Paramount as a serious contender to absorb Hollywood’s most iconic studios.
The new offer values WBD at a 139% premium over its September stock price and includes all major cable assets—CNN, TNT, TBS, Discovery—giving Paramount greater leverage in negotiations. CEO David Ellison framed the move as “finishing what we started,” marking Paramount’s sixth attempt to acquire WBD since the bidding war began.
Regulatory pressure is central to this battle. Paramount argues that Netflix’s acquisition would give the streaming giant a 43% global subscriber share, raising antitrust concerns. Trump publicly echoed similar sentiments, calling Netflix’s push “a problem,” adding political weight to the clash.
The combined company would merge Paramount Pictures, CBS, Nickelodeon, and Paramount+ with HBO, Warner Bros., and top sports rights, creating a content powerhouse. Paramount claims over $6 billion in cost synergies, with an emphasis on keeping theatrical releases alive—an issue that has long divided Hollywood, especially given Netflix’s resistance to traditional cinema windows.
WBD shares surged over 7% after the offer, while Netflix dipped more than 2%, signaling investor belief that the bidding war is far from over.
TECHNICALS
PSKY is trading at $14.23, pulling back sharply after rejecting the long-term descending trendline around $19–$20. The chart shows a clear macro downtrend, and price is now approaching the major demand zone near $9.55–$11, where buyers have repeatedly stepped in since 2023.
The 9-SMA sits above price at $15.34, signaling short-term bearish pressure. RSI at 43 shows weakening momentum without being oversold yet. MACD is crossing bearish, supporting the continuation of the pullback.
If PSKY holds above $12, a rebound toward $16–$18 is possible. A breakdown below $11 opens the door to retesting the $9.55 low.

BULLISH MOVE - USDCHFHello traders,
as mentioned in the previous analysis, the USDCHF has formed a descending channel.
Currently, the resistance line is broken!
Based on this breakout, I expect a bullish move.
🎯 TARGET: 0.81000

Gold (XAUUSD):
Gold (XAUUSD):
The overall trend is bullish; the price is currently in a corrective phase.
Key buy zone: 4141–4114
If price reacts from this area, targets are 4242–4265 and 4375–4395.
A break and close below 4110 invalidates the bullish scenario.

SOLANA – Key Support Retest, Watching HTF Structure CloselySOL is interacting with one of the most important HTF zones on the chart — the multi-year support level that has repeatedly defined trend transitions. This zone has served as structural support during expansion phases, a breakout base during the run toward all-time highs, and later as a liquidity pool during corrective cycles. Every major deviation from this line has led to a significant move in the opposite direction, making this retest highly meaningful.
Earlier in the chart, support broke and produced a full liquidity sweep, clearing long-position stop clusters before price reclaimed the level and initiated a multi-month advance. The presence of an order block just above this zone adds additional structure: it acted as a redistribution area during the breakdown, and later as the origin of re-accumulation. The recent taps into this region suggest the market is again probing for resting liquidity and responsive buy orders.
Price is now compressing between HTF support and declining 50/100 EMAs, creating a classic higher-timeframe squeeze. EMAs continue to slope downward, signaling a bearish macro trend, but candles remain supported at the long-term horizontal level. This type of compression typically resolves with a decisive expansion once liquidity is absorbed from one side.
The FVG Reaction Zone earlier in the trend shows how SOL tends to return to inefficiencies before choosing direction. The current circled region may represent the same behavior on a larger scale — an attempt to rebalance price before either reclaiming the EMAs or continuing displacement lower.
Momentum indicators add another layer: Stoch RSI is turning upward from deeply oversold territory, suggesting momentum exhaustion on the downside but not yet confirming a trend reversal. Historically on this timeframe, these rotations have preceded multi-week expansions when aligned with structural reclaim, but have also failed when EMAs continued to reject price.
Overall, SOL is positioned at a pivotal HTF decision point:
Hold support → potential base formation and EMA reclaim attempts
Lose support → opens the door to a fresh liquidity sweep into prior structural lows
Until a break in structure or EMA reclaim occurs, this remains a compression zone with elevated importance for trend continuation or reversal.

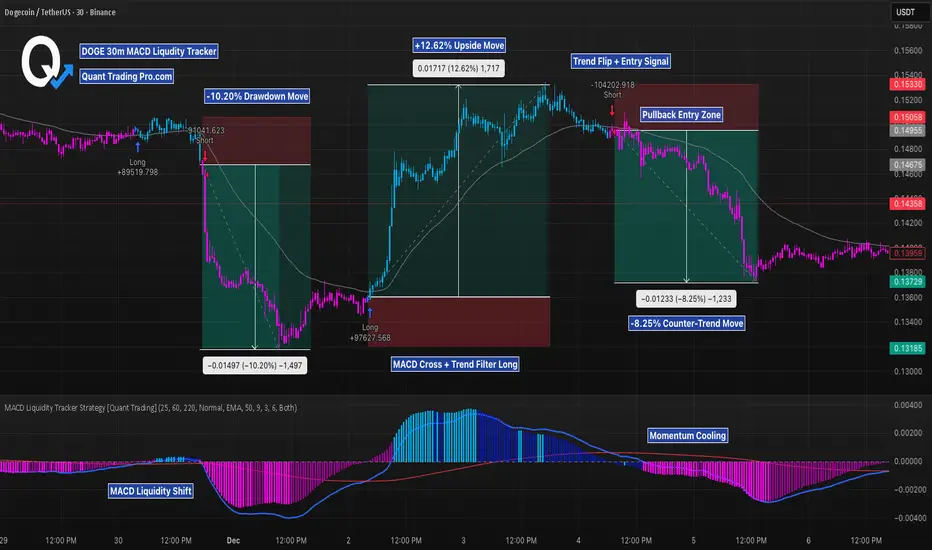
DOGE 30M – MACD Liquidity Tracker Trend Flip in ActionThis 30M chart shows how the MACD Liquidity Tracker Strategy behaves during clear trend rotations. The first shift came after a strong liquidity flip on MACD, followed by alignment with the EMA trend filters. That combination produced a clean long signal and a full trend rotation before momentum began to fade.
The second sequence shows the opposite: a pullback entry formed while momentum was already weakening, leading into a counter-trend move as EMAs rolled over and MACD histogram compressed. This contrast highlights how the strategy performs best when MACD expansion and trend filters sync, and becomes less reliable during momentum decay.
The settings used here were selected through automated backtesting, where multiple MACD lengths and EMA filters were tested to identify combinations that maintained trend clarity and avoided excess chop. The final set reflected the strongest balance between early momentum detection and false-signal reduction.
Backtested Settings:
MACD: 25 / 60 / 220
Signal: 9
EMA Filters: 50 & 100
Mode: Normal
Trend Filter: On
Entry Type: Long + Short enabled
Price is now consolidating under the EMAs while MACD momentum cools. A new trend signal requires a higher low and fresh MACD expansion; otherwise, short-term chop remains likely.
$CNBOT- China’s Trade Surplus Reaches $1T (November/2025)ECONOMICS:CNBOT
November/2025
source: General Administration of Customs
- China’s trade surplus topped a record of $1 trillion in the first 11 months of the year a deepening slump in shipments to the US.
In November alone, the surplus reached $112 billion,
the third-largest on record and well above expectations,
as exports rebounded 5.9% year-on-year after October’s unexpected drop,
outpacing a 1.9% rise in imports.

BTC USDHI GUYS,
This week am changing idea setups, am to share a much clean set up as illustrated above.
no more scalp entries on every move however am switching to identifying path entries ONLY
BTC USD sold last week on a thursday, however the historical price pattern suggest (fri, mon ) price .
so yes i did make entries howvever i expect monday to be bullish to clear the fri, mon sell price pattern.
NOTE. there was manipulation on entry price pattern last week however my detective method still suggest bulls on Monday then sells the same day.

Nothing !!!As you can see, the price is forming two bullish patterns on the 4h timeframe, If my view is correct, TON will rise to $1.9
And if this pattern is correct and breaks, higher targets are possible.

Breaking: Cemtrex, Inc. (CETX) Spike Over 200% TodayThe price of Cemtrex, Inc. (CETX) saw a notable uptick of over 200% albeit market turmoil. the stock broke out of a bullish falling wedge setting the coast for $20 resistant zone.
With next estimated earnings date set for Monday, December 29, 2025, after market close, The stock price has decreased by -92.89% in the last 52 weeks with the last recorded RSI at 39 making it oversold but prior to this surge, the asset is set for $20 resistant zone move.
In a recent news, Cemtrex Enters into Agreement to Acquire Invocon, Adding Proven Aerospace & Defense Engineering Capabilities.
The company has entered into a definitive agreement to acquire Invocon, Inc., a Texas-based systems-engineering firm with a 40-year history designing, manufacturing, and supporting mission-critical instrumentation, wireless sensing systems, and flight hardware for aerospace, defense, and advanced government programs.
About CETX
Cemtrex, Inc. operates as a technology company in the United States and internationally. It operates through Security, Industrial Services, and Cemtrex Corporate segments. The company offers browser-based video monitoring and analytics-based recognition systems, cameras, servers, and access control systems for security and surveillance in industrial and commercial facilities, federal prisons, hospitals, universities, schools, and federal and state government offices.

Gold May Continue Its Short-Term Uptrend📊 Market Overview
• Global gold price is currently around 4,210.89 USD/oz.
• Bullish pressure continues to be supported by expectations that the Federal Reserve (Fed) will cut interest rates in the upcoming meeting — a weaker USD makes gold more attractive to global investors.
• However, the uptrend is showing a slight pullback after gold reached a “short-term high” earlier this week, mainly due to some profit-taking activity.
📉 Technical Analysis
• Key resistance levels: ~ 4,235 USD and ~ 4,260 USD/oz (near last week’s highs).
• Nearest support levels: ~ 4,190 USD and ~ 4,150 USD/oz — potential rebound zones if the price declines.
• EMA 09: Price remains above the EMA 09, indicating that the short-term trend is still bullish.
• Candlestick / volume / momentum: Market is showing signs of a “minor pullback / consolidation.” Volume is weakening compared to previous bullish sessions, reflecting investor caution after a strong rally — suggesting possible sideways movement or light correction before the next move.
📌 Outlook
Gold may continue rising in the short term if the USD keeps weakening, U.S. economic data softens, or the Fed signals a dovish stance. Conversely, if the USD strengthens sharply or inflation data rises, gold may move sideways or undergo a mild correction.
💡 Trading Strategy
• BUY XAU/USD at: 4,150 – 4,153 USD
🎯 TP: 40 / 80 / 200 pips
❌ SL: 4,146.5
• SELL XAU/USD at: 4,240 – 4,243 USD
🎯 TP: 40 / 80 / 200 pips
❌ SL: 4,246.5

KSE-100 INDEX – TECH ANALYSIS | 1H TF | 08 DEC 2025 | By TCAKSE-100 INDEX – TECH ANALYSIS | 1H TF | 08 DEC 2025 | By The Chart Alchemist
1. Accumulation Phase
On the 1-hour timeframe, the KSE-100 Index formed a defined accumulation range between 157,370 points and 166,000 points.
2. Breakout and Retest
Price broke out above the upper accumulation boundary and printed a high at 169,278 points.
A structured retest of the breakout zone followed, validating the breakout on the intraday structure.
3. Target Levels
• Immediate Target: 171,290 points
• Intermediate Target: 173,000 points
• Final Target: 177,350 points
4. Support Levels
• Immediate Support: 165,950 points
• Main Support: 160,670 points
5. Structure Status
Price is currently holding above the breakout level on the 1H timeframe, maintaining higher high–higher low structure above the former resistance zone.
6. Technical Note
Index structure reflects directional flow only. Trade execution remains dependent on individual stock-level confirmation.

Nifty Analysis EOD – December 8, 2025 – Monday🟢 Nifty Analysis EOD – December 8, 2025 – Monday 🔴
Bears Launch Aggressive Counter: All Gains from the Previous 3 Sessions Wiped Out.
🗞 Nifty Summary
The Nifty started flat to negative, quickly breaching the 26104 support and establishing the Initial Balance (IB) range between 26070 ~ 26104.
The market action was clearly controlled by sellers, leading to a massive 100+ point plunge around 1 PM. This sharp fall broke the PDL and tested the important structural support of 25920 ~ 25930.
The market was completely dominated by bears, resulting in a dramatic wipeout of all gains accumulated from the preceding Thursday, Friday, and Wednesday sessions. Nifty closed at 25,960.55, significantly below the psychological 26K level and below the close of the last eight consecutive sessions.
The day ended with an 80-point recovery attempt from the low, which was rejected by the PDL, pushing the index back toward 25920.
🛡 5 Min Intraday Chart with Levels
🛡 Intraday Walk
The initial breakdown below 26104 was a strong signal, indicating that the buyers lacked the conviction seen last week. The range-bound nature of the first half (within the IB Range) was deceptive; the sharp 1 PM drop confirmed the underlying seller dominance.
The ability of the bears to hold the market down and close it below the PDL, despite the 80-point recovery attempt from the day’s low, is a major bearish technical achievement. The market is now testing the base formed back on Wednesday’s low.
📉 Daily Time Frame Chart with Intraday Levels
🕯 Daily Candle Breakdown
Open: 26,159.80
High: 26,178.70
Low: 25,892.25
Close: 25,960.55
Change: −225.90 (−0.86%)
🏗️ Structure Breakdown
Type: Strong Bearish candle (Bearish Engulfing pattern).
Range (High–Low): ≈ 286 points — very high volatility.
Body: ≈ 199 points — reflecting powerful, clear downside pressure.
Upper Wick: ≈ 19 points — buyers attempted a mild push above the open but were immediately rejected.
Lower Wick: ≈ 68 points — some late buying emerged near the bottom (25900 zone).
📚 Interpretation
This is a definitive bearish candle. The long real body and the massive range expansion (engulfing multiple prior sessions) signal a major shift in short-term sentiment. The failure of the small early recovery attempt confirms seller dominance. The close below the PDL puts the market in a precarious position, although the lower wick shows buyers are attempting to defend the 25900 zone.
🕯 Candle Type
Strong Bearish Candle with Lower-Wick Support Attempt — Shows heavy selling pressure and requires strong bullish follow-up to prevent continuation.
🛡 5 Min Intraday Chart
⚔️ Gladiator Strategy Update
ATR: 202.85
IB Range: 101.10 → Medium
Market Structure: Balanced
Trade Highlights:
10:58 Short Trade - Target Hit (R:R 1:5.51) (IBL + Symetrical Traiangle Breakout)
Trade Summary: The strategy successfully identified the directional breakdown below the Initial Balance Low (IBL) and the subsequent move, capturing an outstanding high R:R short trade that maximized profit from the day’s dominant bearish trend.
🧱 Support & Resistance Levels
Resistance Zones:
25985
26030
26070
26104 (Previous Key Support)
Support Zones:
25930 ~ 25920 (Immediate Base)
25860 ~ 25840
25740 ~ 25715
🧠 Final Thoughts
“The fight is now at the 25900 base.”
The bearish engulfing candle has confirmed the start of a deep retracement. The critical battleground for Tuesday is the 25930 ~ 25920 zone.
If bears breach and sustain below this support, we are likely heading for the next major support zone at 25860 ~ 25840. Only a decisive reclamation and close above 26030 can negate the current bearish short-term structure.
✏️ Disclaimer
This is just my personal viewpoint. Always consult your financial advisor before taking any action.
