[SeoVereign] Bitcoin Bearish Outlook – June 17, 2025We are the SeoVereign Trading Team.
With sharp insight and precise analysis, we regularly share trading ideas on Bitcoin and other major assets—always guided by structure, sentiment, and momentum.
🔔 Follow us to never miss a market update.
🚀 Boosts provide strong motivation and drive to the SeoVereign team.
--------------------------------------------------------------------------------------------------------
Hello,
This is SeoVereign, approaching technical analysis not as a result but as a prediction, with a realistic perspective.
I am presenting a bearish view on Bitcoin as of June 17, 2025.
First, based on the fact that a downtrend appeared near the 0.786 level of the overall Fibonacci retracement, I believe strong downward pressure is forming, and thus I am outlining this bearish perspective.
This 0.786 level corresponds to around the 109,000 price range. On the chart, the 109,000–110,600 range is a very strong supply zone where support and resistance have repeatedly been confirmed.
Next, from a wave counting perspective, the 1.272 trend-based Fibonacci extension lies in a similar area as the 0.786 retracement level, which further reinforces my conviction in this view.
After successfully predicting the downward movement from the 11th, I have been continuously counting the recent upward wave, and the wave structure on the chart appears to align naturally, as I see it.
In addition, from a harmonic perspective, the Alt Bat pattern is functioning effectively, and since the movement has been captured within the pre-set X–1.13 range, the confirmation of this pattern can also be considered successful.
The first target is currently set around the 105,700 level.
I will continue to monitor the market closely, and once this idea progresses to a certain point, I will share more specific evidence and the thought process behind the bearish entry through an additional update.
Thank you.
Contains image

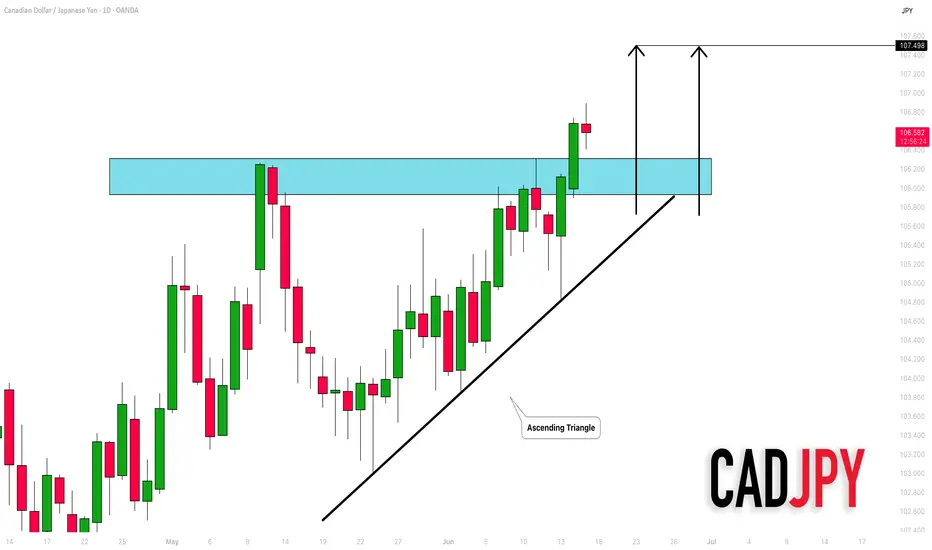
CADJPY: Important Breakout 🇨🇦🇯🇵
CADJPY successfully violated a resistance of an ascending triangle
pattern on a daily time frame.
The broken structure turns into a strong support now.
The pair may continue rising after a pullback.
Next goal - 107.5
❤️Please, support my work with like, thank you!❤️
VIX Trade Plan – May 23, 2025⚠️ VIX Trade Plan – May 23, 2025
📊 Instrument: VIX (Volatility Index)
🎯 Strategy: Long Exposure via Direct Shares
📈 Confidence: 70%
📅 Time Horizon: 3–4 Weeks
📌 Technical & Sentiment Snapshot
Price @ Entry: $21.88
Chart Structure:
• M30 / Daily: Bullish – above 10/50/200 EMAs
• Weekly: Mixed, but showing upward bias
• RSI: Neutral to slightly overbought
• MACD: Bullish cross on intraday; flattening on higher timeframes
Volatility Context:
• VIX up +26.9% over 5 days
• Backwardation in VIX futures
• Elevated VIX/VVIX ratio hints at further fear pricing
Headline Risk:
• Geopolitical + macroeconomic uncertainty
• Trade war tensions and surprise policy risk driving implied vol
🔽 TRADE RECOMMENDATION
Parameter Value
🔀 Direction LONG
💵 Entry Price $21.88
🛑 Stop Loss $20.14 (–8%)
🎯 Target Price $25.62 (+17%)
🧮 Size 100 shares
🏦 Risk Level ~1.5% of account
⏰ Entry Timing Market Open
📆 Hold Time 3–4 weeks
🧠 Rationale Behind the Trade
All 5 models agree on a moderately bullish short- to mid-term trend in VIX.
Momentum is supported by:
Rising geopolitical risks
Backwardated futures curve
Technical setups across intraday/daily charts
Entry point near $21.88 gives strong R/R if VIX spikes toward $25–$27 range.
⚠️ Key Risks to Watch
VIX Mean Reversion: VIX tends to drop quickly if risk subsides.
Overbought Intraday: May cause short-term pullbacks even in a bullish context.
Headline Dependency: Any peace deal, central bank surprise, or good news may instantly crush implied vol.
Liquidity Spreads: Use limit orders on open — VIX ETPs (e.g., VXX, UVXY) can see wide bid/ask gaps.
🧾 TRADE_DETAILS (JSON)
json
Copy
Edit
{
"instrument": "VIX",
"direction": "long",
"entry_price": 21.88,
"stop_loss": 20.14,
"take_profit": 25.62,
"size": 100,
"confidence": 0.70,
"entry_timing": "open"
}
💡 If VIX holds above $21.50 with momentum, this setup offers asymmetric upside. Stop placement near $20.14 helps protect against false breakouts or mean reversion traps.

GLD Weekly Trade Setup — June 16, 2025🪙 GLD Weekly Trade Setup — June 16, 2025
🎯 Instrument: GLD (SPDR Gold Shares)
📉 Strategy: Short Bias via Puts
📅 Entry Timing: Market Open
📈 Confidence Level: 65%
🧠 Technical & Sentiment Snapshot
Current Price: $311.78
5-Min Chart: Below EMAs (10/50/200); RSI ≈ 34 → short-term oversold
Daily Chart: Above 10EMA ($309.94), RSI ≈ 56 → neutral-to-bullish
Bollinger Bands: Near lower band on M5 → volatility likely
Support/Resistance:
• Support: $311.68 / $307.28
• Resistance: $312.20 / $313.00
🗞️ Market Sentiment Overview
VIX: Elevated at 20.82 → high risk premium environment
Options Flow: Heavily put-weighted near $305–$310 strikes
Max Pain: $285 → bearish options bias into expiration
News: Geopolitical tensions increase flight-to-safety temporarily, but fading momentum fuels retrace setups
🔽 Recommended Trade: GLD PUT
Parameter Value
🎯 Strike $307.00
💵 Entry Price $0.84
🎯 Profit Target $1.25–$1.70
🛑 Stop Loss $0.50
📅 Expiry June 20, 2025
📏 Size 1 contract
⚖️ Confidence 65%
🧷 Trade Plan
📥 Entry: At market open
📈 PT Zone: $1.25 to $1.70 premium, based on drop to $306–307
🛑 Stop: If premium drops to $0.50 OR GLD breaks above $313
💰 Risk Mgmt: Keep exposure <2% of total account equity
⚠️ Key Considerations
Upside Risk: Sudden bullish shift or risk-off headlines can drive reversal
Time Decay: Premium erosion risk is higher if GLD consolidates
Volatility Drag: VIX dropping could suppress put premiums quickly
🧾 TRADE_DETAILS (JSON)
json
Copy
Edit
{
"instrument": "GLD",
"direction": "put",
"strike": 307.0,
"expiry": "2025-06-20",
"confidence": 0.65,
"profit_target": 1.25,
"stop_loss": 0.50,
"size": 1,
"entry_price": 0.84,
"entry_timing": "open",
"signal_publish_time": "2025-06-16 16:15:17 UTC-04:00"
}
💡 If GLD struggles to reclaim $312.20 at the open, the put setup becomes attractive. Breakout above $313? Exit quickly.

GBP_AUD LONG FROM SUPPORT|
✅GBP_AUD will soon retest a key support level of 2.0700
So I think that the pair will make a rebound
And go up to retest the supply level above at 2.0800
LONG🚀
✅Like and subscribe to never miss a new idea!✅
Disclosure: I am part of Trade Nation's Influencer program and receive a monthly fee for using their TradingView charts in my analysis.

$CYBERUSDT 6H chart Setup$CYBER/USDT Trade Setup
Breakout Retest on 6H chart
Entry: $1.362–$1.384
SL: $1.275
TP 1:- $1.753
TP 2:- $1.995
Hold above $1.362 for bullish continuation.
Watch for confirmation before entry.
DYRO, NFA

BTC BULLS IS IN CONTROL Bitcoin holds strong in its bullish sentiment, securing a fresh high at 111K.
With momentum on its side, a new projection toward 120K is now firmly in play — the bullish trajectory stays intact. 📈
Momentum traders, stay alert. This leg might just be getting started. follow for more insights , comment and boost idea .

PLEASE BUY XAUUSD !!Buying xauusd have best reason which i can't tell here for that u need to search_assetartisan.fx_on_instagran and follow us

Maple (SYRUP) Bullish Impulse, Final Target & Correction Support+553% since its 7-April bottom, but the third wave is already in. Notice how the volume is super high until 15-May but then it drops as prices continue higher. This means that only the fifth wave remains. After the completion of the fifth wave there should be a correction before additional growth.
The two main targets for this current bullish impulse are shown on the chart but it can go higher of course. A number came up around $1.23 but this chart is just too young.
Once the correction starts, the main support will be where the 1.618 Fib. extension is now. Can wick lower but the 0.786 isn't likely to be tested. Maple Finance SYRUP.
Namaste.

TAOUSDT - This can't belast year, I had an experience with a trader and he said that this was an impossible move.
look at this move prnt.sc
it is similar:
- the growth was
- the sideways has started
- now a fall is needed


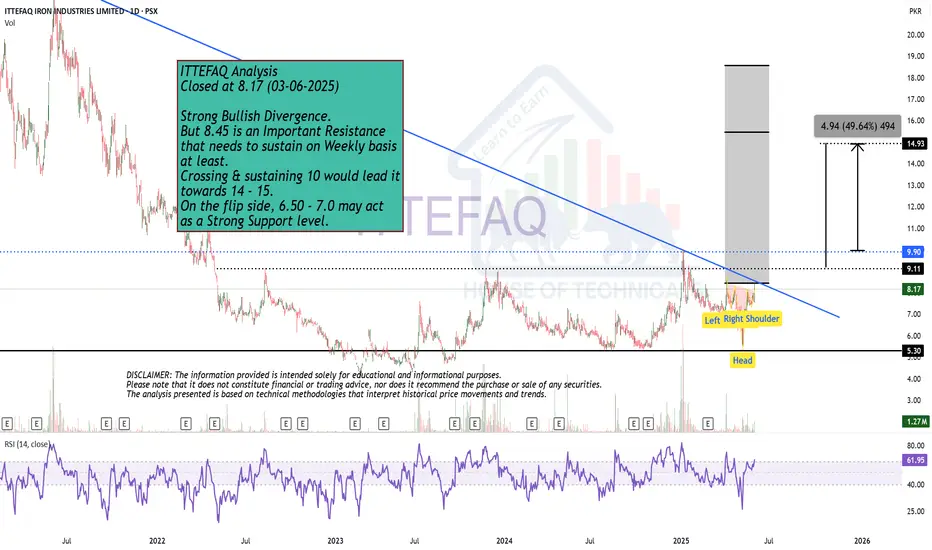
Strong Bullish Divergence. Closed at 8.17 (03-06-2025)
Strong Bullish Divergence.
But 8.45 is an Important Resistance
that needs to sustain on Weekly basis
at least.
Crossing & sustaining 10 would lead it
towards 14 - 15.
On the flip side, 6.50 - 7.0 may act
as a Strong Support level.
Strong Bullish Divergence on Bigger tf.FECTC Closed at 76.81 (16-06-2025)
Strong Bullish Divergence on Bigger tf.
Hidden Bullish Divergence also appearing.
Taken Support from 0.618 fib level.
Cup & Handle Formation on Bigger tf.
Upside Resistance is around 126 - 133
Crossing & Sustaining this level may lead it
towards 220 - 240.
However, it should not break 55 now.

Ronin: Low Risk vs High Reward Potential It is interesting the large amount of volume that has been coming in recently. Just yesterday it was the highest on a daily basis since November 2024 and we know November 2024 was a bullish month.
There is a very strong wipeout candle here, 30-May. These can be taken as a strong reversal signal but only at this juncture of course.
3-Feb we had a wipeout candle but there was no clear bottom in sight yet, and bearish volume was high and thus the market continued lower.
The one from 30-May is preceded by a bottom formation, so we know this one is the final low. Also, this candle is not present on other exchanges which is quite revealing. It means this exchange wanted to liquidate all its leveraged trades and activate all stop-loss orders. It certainly did.
So we ignore this candle but take from it that the bottom is already in. Confirmed. This means that growth will happen next and the high buy volume yesterday confirms this second statement. All in all, we can go LONG with a high probability of success.
Low risk vs a high potential for reward.
Namaste.

Avalanche, The Money Tree; Great Entry Price & TimingWhat's the first thing you consider when looking at a chart? What is the first thing that catches your attention?
When you take the leap, how confident do you feel that your conclusions are correction? Do you doubt yourself? I don't.
The first I look at are the candles and the chart structure. Later comes the volume and price patterns. Finally, if somehow the direction is not yet clear, I add some indicators for additional support. What about you, what is the first thing you consider when looking at a chart?
I think Avalanche is ready to grow based on a rising channel, a structure of a higher lows. This small and young structure is a period of consolidation before maximum growth. Timing is running out. The market is about to go bullish and it will grow with full force.
It doesn't matter what is happening "out there," Crypto is going up.
Looks like a great entry timing is possible on this chart. The price is awesome. It is the same chart setup we've been looking at for months and months. The current price range has been active since early March.
The rise from March, April and May all include the 3-February low. It is certain and highly obvious, this consolidation has been going for too long. The bearish bias is missing. Bullish consolidation means that a bullish breakout will follow when this phase ends. The start of a new uptrend. All those altcoins that moved first revealed what will happen to this pair.
Did you miss those? I showed you some pairs that grew more than 100% in a single day. You know something interesting? The chart on those pairs is exactly the same as this one. The drop, the recovery and the higher low.
Soon, very soon, Avalanche will follow and the rise will be very strong.
Namaste.

EURUSD awaits upcoming newsYesterday, EURUSD climbed back above 1,1600, testing the previous high.
Tomorrow, the market is anticipating the FED’s interest rate decision.
For now, the trend remains clear, with expectations of increased volatility.
Keep an eye out for a higher low and a breakout above the previous high.

Bitcoin Will Continue Rising —Long-Term Chart —$200,000+ New ATHIn November 2021, the week after the all-time high was a crash. The weeks that followed were a continuation and the market went full red and didn't stop dropping until November 2022, a year later.
In May 2025, the week after the all-time high is neutral, sideways. Four weeks later and Bitcoin continues sideways consolidating near resistance, ready to break to new highs and continue rising.
Market conditions now are very, very different compared to 2021. Right now, we are only halfway through the current bull market, for Bitcoin, and we have room left available for plenty of growth.
In a matter of days, maybe 5-6 days, we get a new all-time high and this means not the end of the bull market but the start of the next and final bullish wave.
These targets on the chart are the most accurate of all numbers because they are based on almost 5 years of data.
Next target and minimum price for Bitcoin in the coming months is $155,601 but we know there is likely to be more, much more. With the institutional wave now in full force, banks opening to crypto because they have no other choice and the world evolving faster than anything we thought possible, we are aiming for $200,000 or more.
The next relevant level after $155,600 is $209,125. Which one is your target for this new 2025 all-time high?
Do you think Bitcoin will peak in late 2025 or early 2026?
Do you think you will manage to be successful in this round or are you bound to make the same mistakes? Over-trading, over-leverage, no being patient enough; not waiting for the right time to enter and not selling when the market is trading very high, greed; What will it be?
Do you think you have what it takes to succeed? You do!
Even if you made mistakes in the past or even if you are already doing good, you have what it takes.
If you are doing bad, this experience can be used to improve your game. If you are doing great, great, let's do better. There is never enough growth; we are happy, we are grateful but we accept abundance because we receive abundance thanks to hard work.
It is still very early but the market is starting to heat up. Once the bullish action starts, there is nothing that can stop us. The world will change for us. We will adapt to all market and geopolitical conditions, we will continue to improve and evolve.
The best one is not the one that makes no mistakes but the one that can extract learning from all experiences. Success is not being right all the time, success is never giving up.
Will you give up? Or, will you continue to trade long-term?
» Bitcoin is going up!
Namaste.

ATI – Long Trade Setup!📈
🔍 Pattern: Bull flag breakout attempt
📍 Entry: $85.19 (above triangle breakout)
🎯 Target: $88.16 (prior high / resistance zone)
🛑 Stop-loss: $84.00 (below ascending trendline)
✅ Why this setup?
Clear breakout of falling wedge/bull flag
Strong base near $84 with higher lows
Momentum continuation setup with tight risk
Healthy uptrend visible on intraday structure
📊 Timeframe: 30-minute chart
📈 Bias: Long / Continuation play

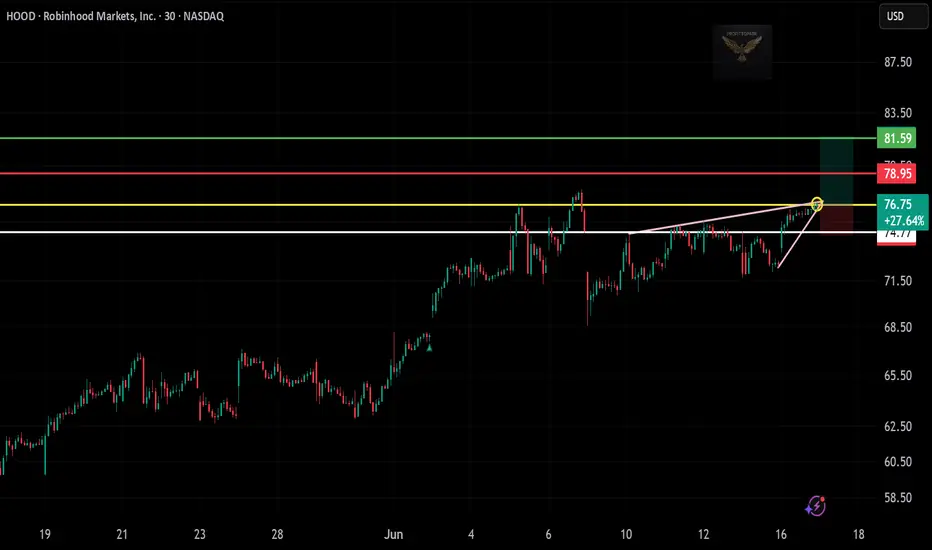
HOOD – Long Trade Setup!📈
🔍 Pattern: Ascending triangle breakout
📍 Entry: $76.75 (breakout candle confirmation)
🎯 Target: $81.59 (green resistance zone)
🛑 Stop-loss: $74.77 (below support trendline)
✅ Why this setup?
Clean breakout from multi-week consolidation
High volume push through resistance zone
Tight risk with large upside target
Strong bullish trend continuation
📊 Timeframe: 30-min chart
📈 Bias: Long / Momentum breakout
IBM – Long Trade Setup📈
🔍 Pattern: Bullish pennant breakout
📍 Entry: Around $281.88 (breakout confirmation)
🎯 Target: $287.52 (green resistance zone)
🛑 Stop-loss: Below $278.50 (support area)
✅ Why this trade?
Strong uptrend with clean pullback
Breakout from consolidation (pennant)
Solid volume and momentum follow-through
Favorable R:R setup above key levels
📊 Timeframe: 30-minute chart
🎯 Bias: Long / Breakout continuation

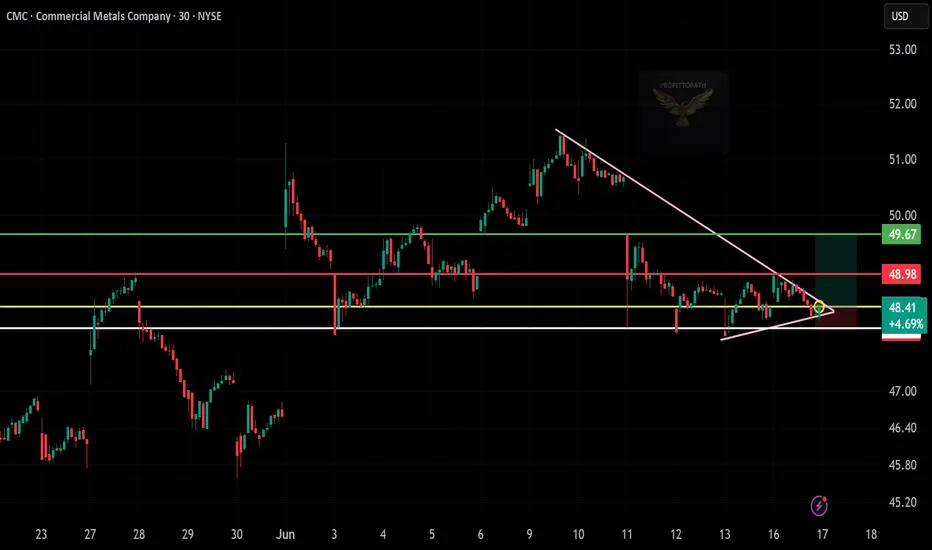
CMC – Long Trade Setup!📈
🔍 Pattern: Symmetrical triangle breakout
📍 Entry: Around $48.41 (bullish breakout candle)
🎯 Target: $49.67 (recent resistance zone)
🛑 Stop-loss: Below $47.50 (white support zone)
✅ Why this setup?
Strong support holding near $47.50
Bullish breakout from triangle and reclaim of yellow level
Favorable R:R ratio (~1.8) with clear structure
📊 Bias: Long
📅 Chart timeframe: 30-minute
BTC at Resistance — Breakdown or Breakout?Bitcoin is trading near $106,600 and still moving cleanly within a well-defined descending channel on the daily chart. Every time price touches the upper boundary, sellers step in aggressively — and this time looks no different. BTC is once again approaching that key resistance zone.
From where I stand, if we don’t see a breakout in the next few sessions, this could be a solid short setup. The structure is clear: fading strength at resistance, targeting the lower channel edge. In this environment, “short the structure — take profit at support” remains a tactical play.
What’s your move? Are you betting on rejection or ready for a breakout?
