USDCAD Technical Analysis! BUY!
My dear subscribers,
USDCAD looks like it will make a good move, and here are the details:
The market is trading on 1.4021 pivot level.
Bias - Bullish
Technical Indicators: Both Super Trend & Pivot HL indicate a highly probable Bullish continuation.
Target - 1.4034
About Used Indicators:
The average true range (ATR) plays an important role in 'Supertrend' as the indicator uses ATR to calculate its value. The ATR indicator signals the degree of price volatility.
Disclosure: I am part of Trade Nation's Influencer program and receive a monthly fee for using their TradingView charts in my analysis.
———————————
WISH YOU ALL LUCK
Contains image

EURUSD FREE SIGNAL|LONG|
✅EURUSD After a strong bearish retracement, price is approaching the demand level where liquidity has already been collected. A short-term reaction from this area is expected, potentially triggering a bullish move up.
—————————
Entry: 1.1650
Stop Loss: 1.1635
Take Profit: 1.1665
Time Frame: 2H
—————————
LONG🚀
✅Like and subscribe to never miss a new idea!✅

$ASTER (4-hour): BAT REVERSAL is on, GOLDEN POCKET testThe BAT has been doing its best on the 4-HOUR SEED_WANDERIN_JIMZIP900:ASTER chart, nearly 20% up from the harmonic pattern's bottom reversal (officially called PRZ - Potential REVERSAL ZONE).
I'm big on volumes, always, the volumes show SMART MONEY intent, and nothing is confirmed with those fat and nice green candles, prefferably with a stealthy OBV support in the background.
And I can't see any strong bars to confirm the reversal, instead, only the usual weekend ones. Red flag for me. It screams caution. I missed the very bottom entry, at $1.01, no chasing, despite TWO buy signals flashing independently on my chart (one of them being an early ELLIOT'S WAVE impulse detector type).
And the GOLDEN ZONE from below is always strong resistance.
As far as the infamous #DeFiLlama #Drama - ASTER is back on the aggregator, which might have been a catalyst to re-ignite an UPTREND soon.
Since it's Sunday i played with my chart a bit, to show where the 'fake volumes and fees' delisting event happened (5/6 OCT), it caused a LOT of FEAR and doubt. The 10/10 collapse compounded the decline but this thing has been holding very well.
I'm expecting either a final quick sell-off to $1+, or a quick rally towards $1.5+ for the ultimate attempt to break into a rally. All depends on CRYPTOCAP:BTC either closing below the 200 SMA/109k, or above.
💙👽

GBP-NZD Local Long! Buy!
Hello,Traders!
GBPNZD price continues to respect the rising support, suggesting that buyers are still in control. A corrective move downward may occur before another bullish leg pushes price toward the target level near 2.3500. Liquidity below the recent lows could provide the fuel for this next impulse.Time Frame 5H.
Buy!
Comment and subscribe to help us grow!
Check out other forecasts below too!
Disclosure: I am part of Trade Nation's Influencer program and receive a monthly fee for using their TradingView charts in my analysis.

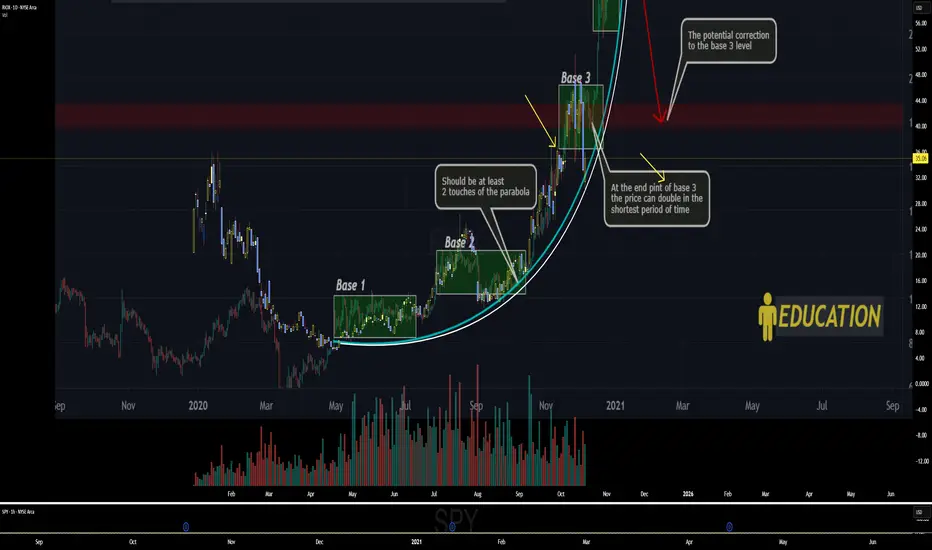
RIOX bottom of base 3RIOX appears to have hit the bottom of base 3, whether or not it moves up and pulls back again before moving up to base 4 im not sure, however RIOX should have made the low
Wall Street Weekly Outlook - Week 43 2025 [20.10.- 24.10.2025]Wall Street Weekly Outlook - Week 43 2025
Every week I release a Wall Street Weekly Outlook that highlights the key themes, market drivers, and risks that professional traders are watching.
+Extra lessons:
Any questions? Drop a comment or reach out directly.
Best,
Meikel

TSLA 4hr Chart- Bullish Setup in Motion Ahead of Earnings Tesla (TSLA) is showing real strength heading into earnings week, closing Friday around $439.31 (+2.46%) with solid momentum. On the 4-hour chart, we’ve been trading inside a descending channel, and that’s important because while it may look bearish at first, this type of channel often leads to bullish breakouts once volume and structure align.
Right now, price is testing the upper side of that channel with a clean bounce from the recent demand zone and reclaiming both the 10 and 20 EMAs. That’s a strong technical sign heading into Monday.
Technical Breakdown
Pattern: Descending Channel (Bullish Continuation Potential)
Trend: Uptrend Confirmed
Momentum: Strong Buy (MAs showing 93.33%)
Oscillators: Leaning Bullish (27.27% Buy Bias)
Entry Zone: Around $435 – $438 (breakout retest area)
Stop Loss: Near $428 (below 61.8% Fib retracement)
Targets:
TP1 → $444.76
TP2 → $454.15
Extended Target → $469.95 (premium supply zone)
Resistance to Watch:
$443.52 – prior swing high
$454.15 – Fib confluence
$469.95 – premium zone and potential top block
Support Levels:
$428 – key breakout retest
$414 – lower boundary of the channel
$401 – major structure support
Heading Into Monday
Bulls are clearly back in control. The chart shows a steady reclaim of momentum with higher lows forming and volume starting to pick up. If price holds above $435, we could see continuation toward $444 – $454 early in the week. A breakout above $443.52 with strong volume would confirm that shift in momentum toward the next leg up.
If we see a short-term dip, I’ll be watching $428 – $414 as the key demand zone where buyers might reload before earnings.
Final Thoughts
Don’t sleep on descending channels — they often set up the biggest bullish reversals once the breakout happens. TSLA is sitting in that pocket right now, with multiple indicators flashing Strong Buy across timeframes. As long as $435 holds, this setup continues to favor the bulls into earnings.
Bias: Bullish
Timeframe: 4H leading into Monday
Expect some volatility, but the trend remains intact and momentum looks healthy.
📘 This is for educational purposes only and not financial advice. Always do your own research before making any trade decisions.

Latest Gold Price Update Today👋Hello everyone, what are your thoughts on OANDA:XAUUSD ?
At the time of writing, XAUUSD is pulling back after reaching its recent peak. This retracement is mainly due to profit-taking by investors after gold hit a near-record high around $4,380.
However, the overall long-term trend still favors the bulls. The main driving force behind this remains strong technical buying momentum. Investors are increasingly turning to gold amid global uncertainties, seeking a safe haven to protect their capital.
Ongoing risks — from a prolonged U.S. government shutdown, escalating U.S.–China trade tensions, political instability in France, and heightened currency volatility — continue to push capital flows into gold, reinforcing its status as the “king of assets.”
From my personal perspective, based on current market momentum, I remain optimistic about gold’s outlook. The next key support levels are around $4,200, followed by $4,100.
💬What about you — how do you see the next move for this precious metal?

SENSEX Intraday & swing Levels for 20th Oct 2025🚀 "WEEKLY Levels" mentioned in BOX format.
🌡️Plot Levels Using 3 Min, 5 Min Time frame in your Chart for Better Analysis
L#1: If the candle crossed & stays above the “Buy Gen”, it is treated / considered as Bullish bias.
L#2: Possibility / Probability of REVERSAL near RLB#1 & UBTgt
L#3: If the candle stays above “Sell Gen” but below “Buy Gen”, it is treated / considered as Sidewise. Aggressive Traders can take Long position near “Sell Gen” either retesting or crossed from Below & vice-versa i.e. can take Short position near “Buy Gen” either retesting or crossed downward from Above.
L#4: If the candle crossed & stays below the “Sell Gen”, it is treated / considered a Bearish bias.
L#5: Possibility / Probability of REVERSAL near RLS#1 & USTgt
HZB (Buy side) & HZS (Sell side) => Hurdle Zone,
*** Specialty of “HZB#1, HZB#2 HZS#1 & HZS#2” is Sidewise (behaviour in Nature)
Rest Plotted and Mentioned on Chart
Color code Used:
Green =. Positive bias.
Red =. Negative bias.
RED in Between Green means Trend Finder / Momentum Change
/ CYCLE Change and Vice Versa.
Notice One thing: HOW LEVELS are Working.
Use any Momentum Indicator / Oscillator or as you "USED to" to Take entry.
⚠️ DISCLAIMER:
The information, views, and ideas shared here are purely for educational and informational purposes only. They are not intended as investment advice or a recommendation to buy, sell, or hold any financial instruments. I am not a SEBI-registered financial adviser.
Trading and investing in the stock market involves risk, and you should do your own research and analysis. You are solely responsible for any decisions made based on this research.
"As HARD EARNED MONEY IS YOUR's, So DECISION SHOULD HAVE TO BE YOUR's".
Do comment if Helpful .
In depth Analysis will be added later (If time Permits)

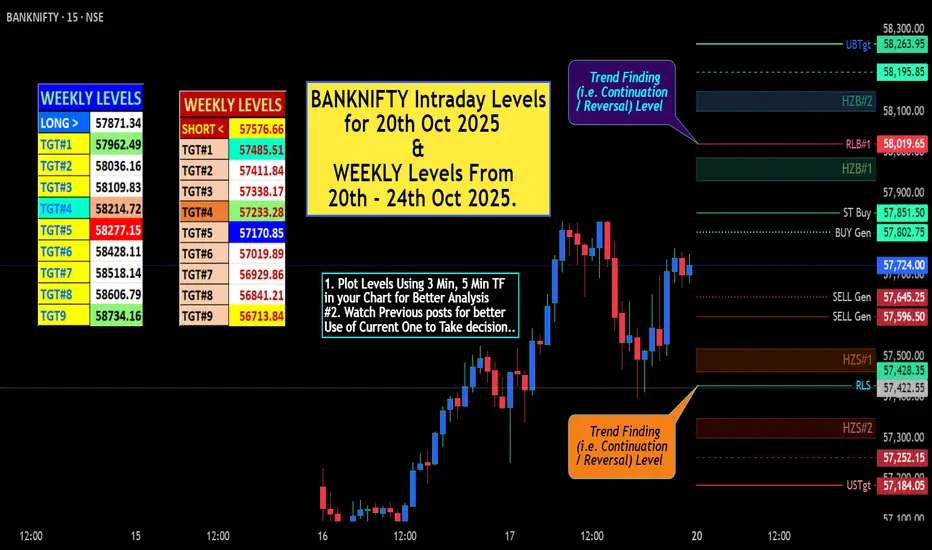
BANKNIFTY Intraday & Swing Levels for 20th Oct 2025🚀 "WEEKLY Levels" mentioned in BOX format.
🌡️Plot Levels Using 3 Min, 5 Min Time frame in your Chart for Better Analysis
L#1: If the candle crossed & stays above the “Buy Gen”, it is treated / considered as Bullish bias.
L#2: Possibility / Probability of REVERSAL near RLB#1 & UBTgt
L#3: If the candle stays above “Sell Gen” but below “Buy Gen”, it is treated / considered as Sidewise. Aggressive Traders can take Long position near “Sell Gen” either retesting or crossed from Below & vice-versa i.e. can take Short position near “Buy Gen” either retesting or crossed downward from Above.
L#4: If the candle crossed & stays below the “Sell Gen”, it is treated / considered a Bearish bias.
L#5: Possibility / Probability of REVERSAL near RLS#1 & USTgt
HZB (Buy side) & HZS (Sell side) => Hurdle Zone,
*** Specialty of “HZB#1, HZB#2 HZS#1 & HZS#2” is Sidewise (behaviour in Nature)
Rest Plotted and Mentioned on Chart
Color code Used:
Green =. Positive bias.
Red =. Negative bias.
RED in Between Green means Trend Finder / Momentum Change
/ CYCLE Change and Vice Versa.
Notice One thing: HOW LEVELS are Working.
Use any Momentum Indicator / Oscillator or as you "USED to" to Take entry.
⚠️ ⚠️ ⚠️ DISCLAIMER:
The information, views, and ideas shared here are purely for educational and informational purposes only. They are not intended as investment advice or a recommendation to buy, sell, or hold any financial instruments. I am not a SEBI-registered financial adviser.
Trading and investing in the stock market involves risk, and you should do your own research and analysis. You are solely responsible for any decisions made based on this research.
"As HARD EARNED MONEY IS YOUR's, So DECISION SHOULD HAVE TO BE YOUR's".
Do comment if Helpful .
In depth Analysis will be added later (If time Permits)

BTC Reign Pauses. Can ETH Lead the Charge Temporarily?A Tale of Two Titans: Divergence in the Making
Following the market-wide drop on October 10th, 2025, a significant divergence in character has emerged between the two crypto titans, Bitcoin and Ethereum. While Bitcoin's bullish structure appears compromised, Ethereum is exhibiting remarkable resilience, tenaciously holding key support and potentially setting the stage for a period of ETH-led market action.
This analysis explores the possibility of a temporary decoupling, where Ethereum takes the reins while Bitcoin enters a period of consolidation.
Bitcoin: Structure Compromised
From my perspective, the recent crash has severely compromised the prior bullish structure on Bitcoin's daily and weekly charts. The upward momentum has been invalidated, leaving BTC in a state of structural weakness. The most probable path forward for BTC appears to be a prolonged period of sideways consolidation, likely forming a complex flat correction. For now, the king seems to be resting in its coffin.
Ethereum: The Resilient Contender
In stark contrast, Ethereum’s chart tells a very different story. Here's why ETH is capturing our full attention:
Crucial Support Holds Firm: ETH is impressively defending the critical support zone around $3,756. Its refusal to follow BTC into a deeper decline is a powerful statement of relative strength.
Intact Market Structure: Unlike Bitcoin, Ethereum’s weekly and daily upward structures remain intact. The long-term bullish thesis is not yet broken (Weekly chart upward structures & Elliot are still holding targeting around 5900 USDT)
Emerging Elliott Wave Count: As illustrated on the daily chart, a weak but valid Elliott Wave count is taking shape. We appear to have completed a Wave (2) correction right at this key support. If this level holds, it paves the way for a powerful Wave (3) impulse to the upside.
Confluence of Bullish Divergences: Adding significant weight to this outlook are the strong bullish divergences flashing on both the Daily and 4-Hour charts. Around the $3,756 support, both the RSI and MACD are showing higher lows while price has tested lower lows — a textbook signal of waning bearish momentum and a potential reversal. Should this scenario materialize, we can expect a notable increase in weekly and monthly volatility as momentum shifts.
RSI divergence on 1D chart
MACD Divergence
OBV (4H chart) note that obv always making higher lows around the current support
BBWP contraction on 4H chart
The Big Question: A Changing of the Guard?
This brings us to a fascinating and potentially market-defining question: Can Ethereum lead the crypto market to new all-time highs while Bitcoin moves sideways?
We may be witnessing a temporary 'changing of the guard,' where ETH's fundamental strength and resilient technicals allow it to become the market's temporary primary driver. While Bitcoin's gravity is undeniable, the current situation suggests that Ethereum might be carving its own path.
The confirmation of this thesis rests on the $3,756 support. A sustained hold above this level could be the opening act for the next major bull run, led by an unexpected protagonist.
Share your thoughts in the comments

Bitcoin Bounces with RSI Divergence: Eyes on $108.5K BreakoutBitcoin has precisely touched our key support zone (POC + 0.786 Fib + 50 SMA + Horizontal Support Level) identified in the previous analysis. As of this update, the price has shown a strong rebound from that zone and is now attempting to break above $108K.
As the price touched our support area, we’re also observing bullish divergence forming on the RSI, further strengthening the case for a potential upward move.
If BTC successfully closes a strong weekly candle above $108,500, it will re-enter its previous range, opening the potential for a move toward the $112K–$118K region.
According to the latest liquidation heatmap data:
- Roughly $10.42 billion in short positions** could be liquidated if BTC rises by 10%.
- About $3.79 billion in long positions** could be liquidated if BTC falls by 10%.
Since markets typically move toward liquidity, this setup suggests a higher probability of upside continuation from the current level.

Grok Analysis of Gold/Silver Ratio - 4 month Price TargetsI asked Grok: Gold and silver 4 months price targets using Gold-silver ratio analysis of m2.
Grok: Gold Target $4,800 +13%
Grok: Silver Target: $70 +35%
Grok 4 month Summary
Thought for: 4m 33s
These targets align with a distribution of expert forecasts, which range from $4,000-5,500 for gold and $45-100 for silver in early 2026, but are specifically adjusted using the M2 and ratio framework. Risks include faster-than-expected M2 contraction (e.g., due to Fed policy) or geopolitical events accelerating precious metals demand. Not financial Advice

DXY: Sellers Take ControlHi traders and investors!
This analysis is based on the Initiative Analysis concept (IA).
The US Dollar Index (DXY) formed a sideways range on the daily timeframe at the end of June. The seller’s initiative is now active, with a target at 96.767.
Before that, there was a buyer initiative, and we can see that at the end of it, there was a manipulation around the 98.640 level.
A buyer attack occurred on high volume, but the sellers absorbed the buyer’s attack candle and pushed the price downward on October 15.
The price may return to retest either 98.65 - 98.35 area. However, the main movement on the Dollar Index remains downward.
Wishing you profitable trades!

EURUSD: Support & Resistance Analysis For Next Week 🇪🇺🇺🇸
Here is my latest structure analysis and important supports & resistances
for EURUSD for next week.
Consider these structures for pullback/breakout trading.
❤️Please, support my work with like, thank you!❤️
I am part of Trade Nation's Influencer program and receive a monthly fee for using their TradingView charts in my analysis.

GOLD (XAUUSD): Bullish Market Opening?!
We got a nice pullback on Gold on Friday
and the price nicely retraced to a key intraday support.
Analysing the market reaction to that, I spotted a cup & handle pattern
and a confirmed violation of its neckline.
With a high probability, the market will rise after the opening.
The price will reach at least 4272 intraday resistance.
❤️Please, support my work with like, thank you!❤️
I am part of Trade Nation's Influencer program and receive a monthly fee for using their TradingView charts in my analysis.

GBP/AUD SHORT FROM RESISTANCE
Hello, Friends!
It makes sense for us to go short on GBP/AUD right now from the resistance line above with the target of 2.044 because of the confluence of the two strong factors which are the general downtrend on the previous 1W candle and the overbought situation on the lower TF determined by it’s proximity to the upper BB band.
Disclosure: I am part of Trade Nation's Influencer program and receive a monthly fee for using their TradingView charts in my analysis.
✅LIKE AND COMMENT MY IDEAS✅

XAU USD - keeps on giving in 2025Hello, it's been a while.
I've been on working building my pile in XAG, XAU reserves.
Now i am back, Gold is still giving a phenomenal return on printing up and right (meaning growth).
I don't know where price structure will end, however it's a highly probable chance we will hit $4,000USD per oz, and continue to raise.
Daily chart image shows my thought pattern and an opportunity I am waiting for price to revert to.
I'm referring to the Daily price chart and key counts are in line with Wave counting and supply and demand curve trading levels based on fair value gap intervals of weekly trading sessions plotted to a daily chart at intervals of 60.
Current wave - 3 of 5 in the Elliott wave count.
Master Key for zones
Red = Three Month
Blue = Monthly
Purple = weekly
Pink = Consolidative box example (Daily)
Orange = Daily
Risk Warning
Trading leveraged products such as Forex, commodities and CFDs, carries with it a high level of risk and so may not be suitable for every investor. Prior to trading the foreign exchange, commodity or CFD market, consider your investment objectives, level of experience and risk appetite. You should never risk more than you can afford to lose. If you fail to understand or are uncertain of the risks involved, please seek independent advice and remember to conduct due diligence as criteria varies to suit the individual.
Below are some of the take aways from the video - please listen again incase any detail is missed.
Do you enjoy the setups?
Professional analyst with 8+ years experience in the capital markets
Focus on technical output not fundamentals
Focus on investing for long term positional moves
Provide updates where necessary - with new updated ideas tracking the progress.
If you like the idea, please leave a like or comment.
To all the followers, thank you for your continued support.
Thanks,
LVPA MMXXIV

GBPJPY | Anticipating Liquidity Sweep Into OB | 15-Min SMC Setup📊 Pair: GBPJPY
⏰ Timeframe: 15 Minutes
🧠 Bias: Bullish (anticipating reversal setup)
🔍 Market Context:
Currently, price is consolidating above a recent swing low , where resting liquidity is visible.
Below that low lies a bullish order block , which aligns with the discount area of the range.
💡 Trade Idea:
I’m expecting price to sweep the liquidity below the low , tap into the order block , and then show confirmation (BOS + bullish displacement) before entering a long position.
🎯 Plan Summary:
- Wait for liquidity grab ✅
- Tap into OB ✅
- Look for bullish confirmation ✅
- Target the next internal high for continuation
🧩 Concept Used:
Smart Money Concepts | Liquidity | Order Block | Market Structure Shift
⚠️ Disclaimer:
This is only my personal analysis shared for educational purposes — not financial advice.

GBPUSD W43 FRGNT Forecast -Q4 | W43 | Y25|📅 Q4 | W43 | Y25|
📊 GBPUSD W43 FRGNT Forecast
🔍 Analysis Approach:
I’m applying Smart Money Concepts, focusing on:
Identifying Points of Interest on the Higher Time Frames (HTFs) 🕰️
Using those POIs to define a clear trading range 📐
Refining those zones on Lower Time Frames (LTFs) 🔎
Waiting for a Break of Structure (BoS) for confirmation ✅
This method allows me to stay precise, disciplined, and aligned with the market narrative, rather than chasing price.
💡 My Motto:
"Capital management, discipline, and consistency in your trading edge."
A positive risk-to-reward ratio, paired with a high win rate, is the backbone of any solid trading plan 📈🔐
⚠️ Losses?
They’re part of the mathematical game of trading 🎲
They don’t define you — they’re necessary, they happen, and we move forward 📊➡️
🙏 I appreciate you taking the time to review my Daily Forecast.
Stay sharp, stay consistent, and protect your capital
— FRNGT 🚀
FX:GBPUSD

CSE All Share Price Index 📈 CSE All Share Price Index (ASPI) – Technical + Fundamental Outlook
🔹 Trend Overview
The index is moving inside a strong ascending channel.
Multiple successful retests of channel support show consistent buying interest.
As long as price stays inside the channel, the trend remains bullish.
🎯 Key Price Zones to Watch
Immediate Resistance: 22,800 – 23,000
→ Expect mild profit-taking here.
Breakout Zone: Above 23,000
→ If broken with volume, next targets could be 23,500 → 24,200.
Ideal Buy Zone (Pullback): Around 22,000
→ Mid-channel area — good for dip entries.
Trend Invalidation: Below 21,000
→ Only a break below this would signal real weakness.
📊 Market Behavior
Candles are getting stronger — buyers in control.
No major upper wicks — little selling pressure currently.
A short-term pullback is possible, but structure is still very healthy.
🧾 Fundamentals Support the Trend
Increasing foreign inflows.
Interest rates are stable to slightly easing — supports equities.
Corporate earnings for key sectors improving.
Currency risk (LKR) still something to monitor but currently manageable.
✅ Strategy Suggestions
Short-Term Traders: Take partial profit near 22,800-23,000 and reload on dips.
Medium-Term Investors: Hold as long as we stay above 21,000.
New Entries: Better to buy dips rather than chase highs.
🟢 Conclusion
“Still in a clean bullish structure. Every dip inside the channel is a buying opportunity — not a reversal signal.”

EURUSD W43 FRGNT Forecast -Q4 | W43 | Y25|📅 Q4 | W43 | Y25|
📊 EURUSD W43 FRGNT Forecast
🔍 Analysis Approach:
I’m applying Smart Money Concepts, focusing on:
Identifying Points of Interest on the Higher Time Frames (HTFs) 🕰️
Using those POIs to define a clear trading range 📐
Refining those zones on Lower Time Frames (LTFs) 🔎
Waiting for a Break of Structure (BoS) for confirmation ✅
This method allows me to stay precise, disciplined, and aligned with the market narrative, rather than chasing price.
💡 My Motto:
"Capital management, discipline, and consistency in your trading edge."
A positive risk-to-reward ratio, paired with a high win rate, is the backbone of any solid trading plan 📈🔐
⚠️ Losses?
They’re part of the mathematical game of trading 🎲
They don’t define you — they’re necessary, they happen, and we move forward 📊➡️
🙏 I appreciate you taking the time to review my Daily Forecast.
Stay sharp, stay consistent, and protect your capital
— FRNGT 🚀
OANDA:EURUSD
