AUD/CHF BEARISH BIAS RIGHT NOW| SHORT
Hello, Friends!
AUD/CHF is trending down which is clear from the red colour of the previous weekly candle. However, the price has locally surged into the overbought territory. Which can be told from its proximity to the BB upper band. Which presents a great trend following opportunity for a short trade from the resistance line above towards the demand level of 0.519.
Disclosure: I am part of Trade Nation's Influencer program and receive a monthly fee for using their TradingView charts in my analysis.
✅LIKE AND COMMENT MY IDEAS✅
Contains image

The Overnight Wealth MachineThe Overnight Wealth Machine: 32 Years of Proof That Trading Hours Don't Matter and Daytraders Fight for 2.4% of the Pie
Wall Street wants you to believe that successful investing requires constant monitoring of markets, lightning-fast execution, and sophisticated day trading strategies. The financial media perpetuates this myth with breathless coverage of every market gyration, celebrating the adrenaline rush of intraday trading. Yet buried in three decades of market data lies an uncomfortable truth that threatens the very foundation of active trading: virtually all of the stock market's returns occur overnight, when markets are closed and traders are powerless to act. This phenomenon, first documented by Cliff, Cooper, and Gulen (2008) and subsequently confirmed by Lou, Polk, and Skouras (2019), represents one of the most persistent anomalies in modern finance.
This empirical analysis of SPY returns from 1993 to 2025 reveals a phenomenon so stark it defies conventional wisdom. Over 8,256 trading days spanning more than three decades, overnight returns generated a cumulative gain of 1,105.62 percent while intraday returns contributed a measly 26.84 percent. These findings align with Kelly and Clark's (2011) observation that "returns during non-trading hours are systematically higher than returns during trading hours." To put this in perspective, if you had invested $10,000 in SPY at inception but only held positions overnight, selling at the open and buying back at the close each day, your investment would have grown to $120,562. The same amount invested only during regular trading hours would have limped to just $12,684.
The cumulative performance chart tells a story of two entirely different markets. The blue line representing overnight returns climbs steadily upward with remarkable consistency, particularly accelerating after 2008. The orange line showing intraday returns barely registers as more than a flat line when viewed on the same scale. The middle panel reveals the ever-widening gulf between these two return streams, while the bottom panel demonstrates that overnight returns have dominated in nearly every single year of the sample period. This is not a statistical anomaly or a quirk of measurement. This is the market's fundamental reality.
The mathematics of this phenomenon become even more compelling when examining risk-adjusted returns. Overnight trading generates a Sharpe ratio of 0.769, a respectable figure that would satisfy most portfolio managers. Intraday trading produces a Sharpe ratio of just 0.124, a number so low it barely justifies the risk taken. Professional traders obsessing over intraday price movements are essentially fighting over table scraps while the real feast happens after they have gone home.
The Sharpe ratio comparison visualizes this stark disparity in risk-adjusted performance. The overnight bar towers over its intraday counterpart, representing not just higher returns but superior returns per unit of risk taken. This finding demolishes the notion that higher returns must come with proportionally higher risk. In fact, the opposite is true: the period when most investors perceive the market as dormant and safe actually generates both the highest returns and the best risk-adjusted returns.
What makes this discovery particularly provocative is its implications for market structure and participant behavior. The overnight period is when retail investors cannot trade, when most market participants are excluded from direct participation. Yet this is precisely when the market generates nearly all its wealth. The pie chart breakdown drives this point home with brutal clarity.
This contribution analysis shows that overnight returns account for 97.6 percent of total market gains. The visual impact cannot be overstated: the overnight slice dominates the chart so completely that the intraday contribution appears as little more than a sliver. This is not how markets are supposed to work according to efficient market hypothesis. Information arrives throughout the trading day. Economic data releases, earnings announcements, and news events occur primarily during market hours. Yet price discovery, that supposedly sacred function of markets, appears to happen primarily when most participants cannot trade.
The distribution patterns of these returns reveal another layer of this phenomenon. Overnight returns cluster much more tightly around their positive mean, showing remarkable consistency. Intraday returns display wider dispersion and a distribution centered barely above zero. This suggests that whatever drives overnight returns operates with machine-like regularity, while intraday returns reflect the chaos and noise of active trading.
The distribution comparison reveals the statistical fingerprints of two distinct market regimes. The overnight distribution, shown in dark blue, exhibits positive skew with its mass concentrated in positive territory. The intraday distribution in coral spreads wider and flatter, centered near zero with extended tails in both directions. The box plots on the right confirm that overnight returns consistently deliver positive outcomes while intraday returns oscillate around breakeven. This is not the pattern of random walk. This is evidence of systematic forces at work.
Statistical testing confirms what the eye can see. The difference between overnight and intraday returns approaches statistical significance with a p-value of 0.054, just barely missing the conventional threshold. But focusing on statistical significance misses the point entirely. The economic significance is undeniable and overwhelming. An investor who understood this pattern and positioned accordingly would have captured returns that dwarf any conventional investment strategy.
The implications extend far beyond individual investment returns. This phenomenon suggests that much of what passes for investment skill is actually noise. Fund managers who boast about their security selection and market timing abilities are largely taking credit for a structural anomaly they neither understand nor control. Day traders who spend hours staring at screens, analyzing charts, and executing rapid-fire trades are engaged in an elaborate exercise in futility. They are trying to extract returns from the very period when the market provides almost none.
Several theories attempt to explain this overnight effect, though none fully capture its magnitude or persistence. Kelly and Clark (2011) propose that overnight risk premiums compensate investors for holding positions through periods when they cannot exit, when overnight news could trigger gaps at the open. Berkman et al. (2012) document that informed traders concentrate their activities during market hours, leaving overnight periods relatively free from information-based trading. Yet these theories fail to explain why such premiums would persist for decades in increasingly efficient markets with 24-hour news cycles and global trading.
Bogousslavsky (2021) suggests institutional rebalancing drives overnight returns, documenting that mutual funds and pension funds often execute trades at the close to match benchmark prices, potentially creating systematic pressure that resolves overnight. Hendershott et al. (2020) propose a model of limited attention where investors focus on trading hours, missing overnight opportunities. But these mechanisms alone cannot account for returns of this magnitude persisting across different market regimes, regulatory changes, and technological revolutions that have transformed market microstructure.
Perhaps the most intriguing explanation, explored by Qiao and Dam (2020), involves the psychology of market participants. During trading hours, investors react to news, chase momentum, panic over headlines, and generally engage in behaviors that create noise rather than signal. The overnight period strips away this behavioral chaos, leaving only the fundamental drift of equity prices upward. In essence, as Branch and Ma (2016) demonstrate, the market performs better when most participants cannot touch it.
This finding should fundamentally alter how investors approach markets. The optimal strategy is not to become a better day trader or to react more quickly to news. The optimal strategy is to do nothing during market hours, or more precisely, to position for the overnight drift and avoid the intraday noise. This runs counter to every instinct cultivated by financial media and trading platforms that profit from activity, not returns.
The persistence of this anomaly across three decades raises uncomfortable questions about market efficiency, echoing Grossman and Stiglitz's (1980) paradox of efficient markets. In theory, once such a pattern becomes known, it should be arbitraged away. As Lou et al. (2019) note, "the persistence of these return patterns presents a significant challenge to our understanding of market efficiency." Smart money should flow in to capture these overnight returns until the effect disappears. Yet here we stand in 2025 with the pattern as strong as ever, suggesting either that implementation frictions are substantial, as documented by Berkman et al. (2012), or that structural forces maintain this divide regardless of investor awareness.
For institutional investors, this phenomenon presents both opportunity and challenge. Capturing overnight returns requires holding inventory through the close, accepting gap risk, and potentially facing margin requirements. For retail investors, the implications are simpler but no less profound: the best time to be in the market is when the market is closed. Those who exit positions before the close to sleep better at night are literally selling their returns to someone else.
The data speaks with crystalline clarity. Across 8,256 trading days, through bull markets and bear markets, through crises and recoveries, one pattern dominates all others. The market's returns belong to those who hold positions overnight. Everything else is noise, distraction, and inefficiency. The financial industry has built an enormous edifice around the premise that active management and sophisticated trading strategies can generate superior returns. This analysis suggests that entire edifice rests on foundations of sand.
As we look forward, the question is not whether this pattern will persist but rather why it has not been arbitraged away already. The answer may lie in the structure of markets themselves, in the behavioral biases of participants, or in institutional constraints that prevent full exploitation. Whatever the cause, investors who understand this reality face a choice: continue participating in the charade of intraday trading or position themselves to capture the overnight drift that has generated nearly all of the market's returns for the past three decades.
The market has been telling us its secret all along. Returns do not come from brilliant stock picking or perfect timing. They do not come from following the news or reading the charts. They come from the quiet hours when markets are closed, when computers reconcile the day's orders, when the machinery of capitalism grinds forward without the interference of human emotion. The greatest edge in investing may simply be recognizing that the game is won not during market hours but in the spaces between them. The real question is not whether you can beat the market but whether you are willing to accept that the market beats itself every single day at 4:00 PM Eastern Time.
The research exists. The data is presented above. The academic literature is cited below. What remains is the critical question: will you act on it? This is where you separate yourself from the 99 percent of retail traders who continue to believe that day trading represents a viable path to wealth. They chase price movements during market hours, convinced that speed and activity equal profit. The evidence says otherwise. The evidence says they are fighting for scraps while the real returns accumulate silently overnight.
But do not take this analysis at face value simply because it appears compelling. That would be falling into the same trap that ensnares most market participants: accepting narratives without verification. Instead, conduct your own research. Download the data. Replicate the calculations. Examine the literature cited in the references section below. Test the hypothesis across different time periods, different markets, different asset classes. Challenge every assumption. Question every conclusion. Demand evidence at every step.
This is the discipline that separates systematic investors from gamblers. No evidence means no trade. No replication means no confidence. No understanding means no edge. The overnight effect has persisted for three decades precisely because most participants lack this discipline. They follow tips, chase trends, and trade based on conviction rather than evidence. The opportunity exists for those willing to do the work that others avoid.
References
Berkman, H., Koch, P. D., Tuttle, L., & Zhang, Y. J. (2012). Paying attention: Overnight returns and the hidden cost of buying at the open. Journal of Financial and Quantitative Analysis, 47(4), 715-741.
Bogousslavsky, V. (2021). The cross-section of intraday and overnight returns. Journal of Financial Economics, 141(1), 172-194.
Branch, B., & Ma, A. (2016). Overnight return, the invisible hand behind intraday returns? Journal of Applied Finance, 26(2), 90-100.
Cliff, M., Cooper, M. J., & Gulen, H. (2008). Return differences between trading and non-trading hours: Like night and day. Working Paper, University of Utah.
Grossman, S. J., & Stiglitz, J. E. (1980). On the impossibility of informationally efficient markets. American Economic Review, 70(3), 393-408.
Hendershott, T., Livdan, D., & Rösch, D. (2020). Asset price dynamics with limited attention. Review of Financial Studies, 33(4), 1433-1468.
Kelly, M. A., & Clark, S. P. (2011). Returns in trading versus non-trading hours: The difference is day and night. Journal of Asset Management, 12(2), 132-145.
Lou, D., Polk, C., & Skouras, S. (2019). A tug of war: Overnight versus intraday expected returns. Journal of Financial Economics, 134(1), 192-213.
Qiao, K., & Dam, L. (2020). The overnight return puzzle and the "T+1" trading rule in Chinese stock markets. Journal of Financial Markets, 50, 100534.
Data Sources
SPY (SPDR S&P 500 ETF Trust) historical price data: January 29, 1993 to November 15, 2025. Source: NYSE Arca via TradingView.
Methodology: Returns calculated as log returns for overnight (previous close to current open) and intraday (current open to current close) periods. Statistical significance tested using both independent and paired t-tests. Sharpe ratios calculated using annualized returns and volatility assuming 252 trading days per year.

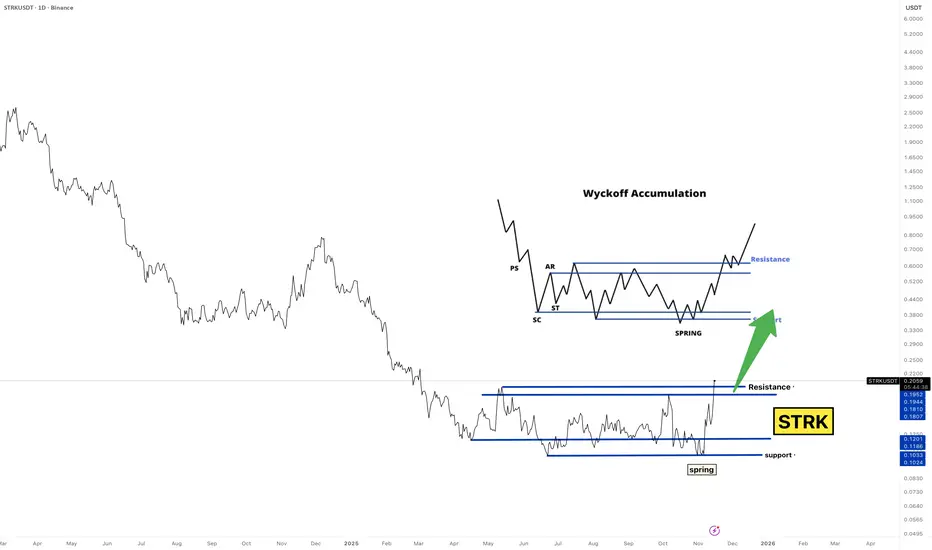
STRK Is Quietly Building a Monster Wyckoff Setup…TRK is doing EXACT Wyckoff… and nobody is paying attention.
This is the setup smart money dreams of:
Selling climax? ✔️
Secondary test? ✔️
Spring? ✔️
Back into range + breakout attempt? ✔️
This is textbook Wyckoff Accumulation — the kind you screenshot and show your kids in 10 years.
Most people won’t notice this pattern until it’s already +200% higher.
You’re seeing it early.
If Wyckoff plays out:
📌 0.22 → 0.45 → 0.70
That’s the roadmap.
Not financial advice — just reading the tape the way the composite operator intended.
Bookmark this. Save the chart.
Watch it unfold.
NASDAQ:STRK #Wyckoff #CryptoTrading #Accumulation #SpecVibe
Global Financial Market and Its Structure1. What Is the Global Financial Market?
A financial market is any platform—physical or digital—where buyers and sellers come together to trade financial instruments such as stocks, bonds, currencies, commodities, and derivatives. When these platforms operate across borders and connect economies worldwide, they form the global financial market.
This global market works on two core principles:
A. Free Flow of Capital
Money can move from one country to another seeking higher returns, lower risk, or better opportunities.
B. Integration of Economies
Events in one market can quickly impact others. For example, a rate hike by the US Federal Reserve affects currencies, stock markets, bond yields, and commodity prices around the world.
2. Why Does the Global Financial Market Exist?
The global market exists to serve four essential purposes:
1. Capital Allocation
Countries and companies need money to build infrastructure, expand business, and fund innovation. Investors need profitable places to put their money. The global market connects them.
2. Liquidity
It provides a place to buy and sell assets easily, ensuring that investors can enter or exit trades without major delays.
3. Risk Management
Through derivatives, hedging tools, and diversified global portfolios, investors can protect themselves from currency risk, interest rate risk, and geopolitical risk.
4. Price Discovery
It helps decide fair value of assets—such as currency rates, gold prices, or stock valuations—based on demand and supply.
3. Structure of the Global Financial Market
The global financial market can be divided into five major segments:
Capital Markets
Money Markets
Foreign Exchange (Forex) Markets
Commodity Markets
Derivatives Markets
Together, they form the complete structure.
A. Capital Markets (Stocks and Bonds)
Capital markets are where businesses and governments raise long-term funds. They are divided into:
1. Equity Markets (Stock Markets)
Companies issue shares to raise money. Investors buy these shares to earn returns through price appreciation and dividends.
Examples:
New York Stock Exchange (NYSE), NASDAQ, London Stock Exchange, Bombay Stock Exchange (BSE), National Stock Exchange (NSE).
Role in global finance:
Helps companies scale globally
Attracts foreign portfolio investors (FPI/FII)
Indicates economic health of a country
2. Debt Markets (Bond Markets)
Governments and corporations borrow money by issuing bonds. Investors earn interest in return.
Types of bonds:
Government bonds (US Treasuries, Indian G-Secs)
Corporate bonds
Municipal bonds
The bond market is actually bigger than the global equity market and heavily influences global interest rates and currency values.
B. Money Markets
Money markets deal with short-term borrowing and lending, typically less than one year. These markets support daily liquidity needs of financial institutions.
Instruments include:
Treasury bills
Commercial paper
Certificates of deposit
Interbank lending
Role:
Money markets ensure stability in the banking system. They act like the “blood circulation system” of global finance, maintaining smooth functioning of cash flows.
C. Foreign Exchange Market (Forex)
The forex market is the world’s largest financial market with over $7 trillion traded per day. It is a fully decentralized, 24-hour market connecting banks, institutions, governments, and traders.
Why Forex is Important:
Determines exchange rates
Supports global trade
Hedges currency risk
Enables cross-border investments
Currencies move due to:
Interest rate changes
Political events
Economic data (GDP, unemployment)
Speculation
Central bank interventions
Forex influences everything—from import/export prices to foreign travel, to inflation in a country.
D. Commodity Markets
Commodity markets allow trading of raw materials such as:
Energy: crude oil, natural gas
Metals: gold, silver, copper
Agriculture: wheat, coffee, sugar
These markets function in two formats:
1. Spot Markets
Immediate delivery of commodities.
2. Futures Markets
Contracts based on future delivery, widely used for hedging.
Commodity markets are heavily influenced by:
Geopolitics
Supply chain disruptions
OPEC policies
Weather conditions
Global demand cycles
Gold and oil are the two most influential commodities globally.
E. Derivatives Market
Derivatives are financial contracts whose value comes from underlying assets such as stocks, currencies, bonds, or commodities.
Common derivatives:
Futures
Options
Swaps
Forward contracts
Why derivatives matter:
Hedge risks (currency risk, interest rate risk)
Enable leverage
Increase liquidity
Allow complex trading strategies
Global derivative markets are massive, running into hundreds of trillions in notional value.
4. Key Participants in the Global Financial Market
The global market functions because of several major players:
1. Central Banks
Federal Reserve (USA), ECB, Bank of Japan, RBI etc.
They control interest rates, regulate liquidity, and manage currency stability.
2. Banks and Financial Institutions
Provide loans, trading services, market-making, and clearing operations.
3. Institutional Investors
Pension funds
Hedge funds
Mutual funds
Sovereign wealth funds
They move large volumes of capital globally.
4. Corporations
Raise funds, hedge forex exposures, and engage in cross-border trade.
5. Retail Traders/Investors
Participate in stocks, forex, crypto, and commodities.
6. Governments
Issue debt, regulate markets, and manage economic policies.
5. How Global Financial Markets Are Connected
An event in one part of the world can have global ripple effects.
Examples:
A US interest rate hike strengthens the dollar and weakens emerging market currencies.
Oil supply cuts by OPEC raise global inflation.
A banking crisis in Europe can shock global equity markets.
This interconnectedness increases efficiency but also increases vulnerabilities.
6. Technology and Global Markets
Technology has completely transformed global markets:
High-frequency trading
Algorithmic trading
Digital payment systems
Blockchain and cryptocurrencies
Online brokerage and investment apps
Today, markets operate round-the-clock, and information travels instantly.
7. Risks in the Global Financial Market
While global markets create opportunities, they also carry risks:
Liquidity risk
Interest rate risk
Currency volatility
Political instability
Systemic banking failures
Market bubbles and crashes
Proper regulation and risk management are essential to maintain stability.
Conclusion
The global financial market is a powerful and complex system that drives economic growth, trade, and investment across nations. It is structured into several interconnected segments—capital markets, money markets, forex markets, commodity markets, and derivatives markets. Each plays a unique role in ensuring smooth movement of money, efficient price discovery, risk management, and global economic coordination.
In an increasingly interconnected world, understanding the structure of global financial markets is essential for traders, investors, policymakers, and anyone seeking to make informed financial decisions.
$ASTER (8-HOUR): 2 FALLING WEDGES breakouts active nowSEED_WANDERIN_JIMZIP900:ASTER has been very strong relative to the crypto market as a whole — no aggressive sell-offs during the general bloodshed, just steady sideways trading through the mayhem.
That’s actually very BULLISH, as assets that outperform their sectors during panic sell-offs are usually the ones that outperform during relief rallies or trend reversals.
On the 8-hour chart, even more BULLISH news: the second FALLING WEDGE has just broken out (targeting $1.69), giving us two active BREAKOUTS — and that’s quite rare.
The 50 MA at $1.05 is turning bullish and has been acting as the key SUPPORT. Close candles below it, and my BULLISH thesis gets a proper re-evaluation.
There’s still too much immediate hard resistance overhead — I’ve talked about this zone multiple times, and nothing changes until #asterix flips $1.3 into SUPPORT.
VOLUMES remain weak, and both BREAKOUTS had low volume as well. Always a solid red flag as far as I’m concerned.
Keeping my SPOT bags intact. NEUTRAL/BULLISH outlook mid-term. No new positions, it's just sideways, but a bigger move is coming soon.
💙👽
#DEX on-chain numbers, and a LIQUIDATIONS heatmap: in the comments👇

RENDERCRYPTOCAP:RENDER is trading inside a descending channel pattern, giving plenty of room to DCA into the position. From the current price to the target, there is a potential 500 percent gain. The structure looks clean and the long term setup is strong.

LINKBIST:LINK is starting to compress inside the triangle as price gets squeezed between resistance and support. The price action shows clear tightening, which is a strong sign a breakout is coming. From current levels to the target, there is a potential 300 percent plus gain on the table.

$HBAR Bearish Pressure Tests Crucial Support – Dip or Bounce ?BINANCE:HBARUSDT CRYPTOCAP:HBAR Bearish Pressure Tests Crucial Support – Dip or Bounce Ahead?
HBAR's 1H chart screams bearish vibes 📉, down ~6% in 24h to ~0.155 USDT, hugging major support at 0.155.
It might hold for a quick bounce to 0.16-0.17 target if RSI stays oversold, but watch for deeper dip risk to 0.14 on break—no breakout above 0.18 resistance soon.
Tracking 50 EMA crossover & volume spikes.
Stay cautious! 🔴⚠️
#HBAR #CryptoTrends #AltcoinAnalysis

EURUSD My Opinion! BUY!
My dear followers,
I analysed this chart on EURUSD and concluded the following:
The market is trading on 1.1621 pivot level.
Bias - Bullish
Technical Indicators: Both Super Trend & Pivot HL indicate a highly probable Bullish continuation.
Target - 1.1642
Safe Stop Loss - 1.1608
About Used Indicators:
A super-trend indicator is plotted on either above or below the closing price to signal a buy or sell. The indicator changes color, based on whether or not you should be buying. If the super-trend indicator moves below the closing price, the indicator turns green, and it signals an entry point or points to buy.
Disclosure: I am part of Trade Nation's Influencer program and receive a monthly fee for using their TradingView charts in my analysis.
———————————
WISH YOU ALL LUCK

Bitcoin is almost at it's targetHi traders,
Last week Bitcoin went a little more up to the higher Daily FVG and rejected from there.
After that it dropped just as predicted in my previous outlook.
There were many good (compound) trades this week.
So now we could see a little more downside to the Weekly FVG (target) after the finish of the small correction into the bearish Daily FVG.
Let's see what the market does and react.
Trade idea: Wait for a correction up on a smaller timeframe and a change in orderflow to bearish to trade shorts.
This shared post is only my point of view on what could be the next move in this pair based on my technical analysis.
But I react and trade on what I see in the chart, not what I've predicted or expect.
Don't be emotional, just trade your plan!
Eduwave

Another drop for goldHi traders,
Last week gold went up again and after it reached the bearish Daily FVG, it dropped again.
I think (grey) wave X is now finished.
So next week we could see a small correction up and another downmove to finish the bigger correction down.
After that it could go up again.
Let's see what price does and react.
Trade idea: Wait for a small correction up on a lower timeframe and a change in orderflow to bearish to trade short term shorts.
This shared post is only my point of view on what could be the next move in this pair based on my technical analysis.
But I react and trade on what I see in the chart, not what I've predicted or expect.
Don't be emotional, just trade your plan!
Eduwave

SPX500USD could still go upHi traders,
Last week SPX500USD went up and down and on Friday evening it started an impulsive move up again.
The pattern could be an ending diagonal (wave 5) or an (orange) wave 4 Triangle (both exist of internal three waves).
So next week we could see more (corrective or impulsive) upside for this pair.
Let's see what the market does and react.
Trade idea: Wait for a small correction down on a lower timeframe. After a change in orderflow to bullish you could trade longs.
This shared post is only my point of view on what could be the next move in this pair based on my technical analysis.
But I react and trade on what I see in the chart, not what I've predicted or expect.
Don't be emotional, just trade your plan!
Eduwave

EU could continue upHi traders,
Last week EU went exactly as predicted in previous outlook. It slowly goes up again for (red) wave 5.
So next week we could see more upside for this pair.
Trade idea: Wait for a small correction down and look for a change in orderflow to bullish on a lower timeframe to trade longs.
This shared post is only my point of view on what could be the next move in this pair based on my technical analysis.
But I react and trade on what I see on the chart, not what I've predicted or expect.
Don't be emotional, just trade your plan!
Eduwave

TWTCRYPTOCAP:TWT is trading inside a descending channel pattern, showing steady compression. Once it breaks out, there is a potential 130 percent gain to be made from the current price. The setup looks clean and momentum is starting to build.

LINKBIST:LINK has come down to support and the price action is starting to compress inside the triangle. This is a strong setup and short term there is a potential 300 percent plus gain from the current price once the breakout triggers.

Buy the bottom of the PayPal uptrendNASDAQ:PYPL is known to be a high value stock with a depressing valuation.
Investors are under optimistic due to the struggling performance the past several years after a dizzying rally during the pandemic.
Recently the stock rallied on earnings due to a deal with Open-AI. Shares quickly gave the spike back and headed lower along with a broader tech pullback on AI bubble fears.
NASDAQ:PYPL has now undercut a long term upward trend line. Judging by the past few times this has happened, it could be a fantastic setup. It looks like the downtrend was broken in late 2024 when the price bottomed on an RSI divergence. The shares seem to be coiling up for a big move, and have been for almost a year now.

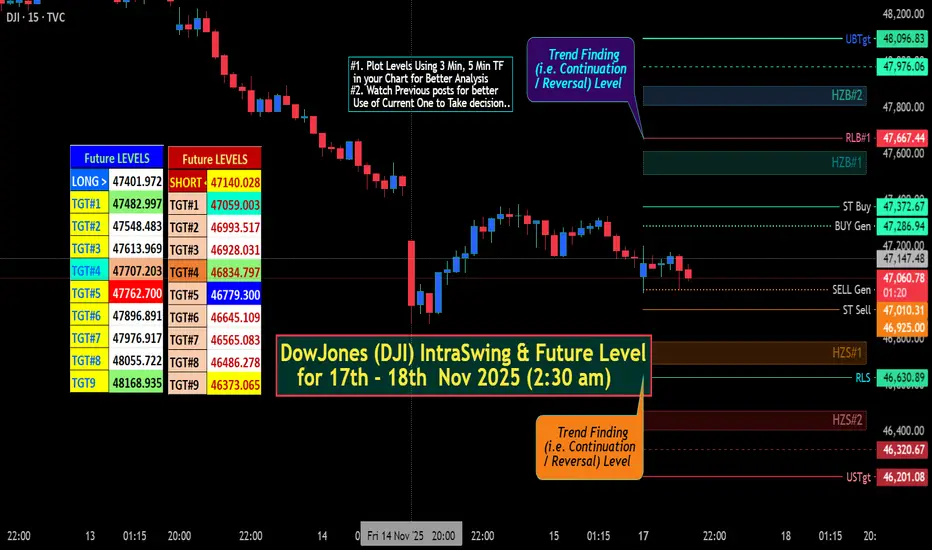
DowJones (DJI) IntraSwing & Future Level for 17th - 18th Nov 25✍🏼️ "Future IntraSwing Levels" mentioned in BOX format.
Useful to Tally / Recognize for Next day Trade Plan.
[ Level Interpretation / description:
L#1: If the candle crossed & stays above the “Buy Gen”, it is treated / considered as Bullish bias.
L#2: Possibility / Probability of REVERSAL near RLB#1 & UBTgt
L#3: If the candle stays above “Sell Gen” but below “Buy Gen”, it is treated / considered as Sidewise. Aggressive Traders can take Long position near “Sell Gen” either retesting or crossed from Below & vice-versa i.e. can take Short position near “Buy Gen” either retesting or crossed downward from Above.
L#4: If the candle crossed & stays below the “Sell Gen”, it is treated / considered a Bearish bias.
L#5: Possibility / Probability of REVERSAL near RLS#1 & USTgt
HZB (Buy side) & HZS (Sell side) => Hurdle Zone,
*** Specialty of “HZB#1, HZB#2 HZS#1 & HZS#2” is Sidewise (behaviour in Nature)
Rest Plotted and Mentioned on Chart
Color code Used:
Green =. Positive bias.
Red =. Negative bias.
RED in Between Green means Trend Finder / Momentum Change
/ CYCLE Change and Vice Versa.
Notice One thing: HOW LEVELS are Working.
Use any Momentum Indicator / Oscillator or as you "USED to" to Take entry.
⚠️ DISCLAIMER:
The information, views, and ideas shared here are purely for educational and informational purposes only. They are not intended as investment advice or a recommendation to buy, sell, or hold any financial instruments. I am not a SEBI-registered financial adviser.
Trading and investing in the stock market involves risk, and you should do your own research and analysis. You are solely responsible for any decisions made based on this research.
"As HARD EARNED MONEY IS YOUR's, So DECISION SHOULD HAVE TO BE YOUR's".
Do comment if Helpful .
In depth Analysis will be added later (If time Permits)
NEW BREAKOUT - USDJPYHello traders,
the USDJPY price has broken the resistance level (154.494 – 154.106).
This key zone has now turned into new support!
Based on this breakout, I expect a bullish continuation.
🎯 Target: 156.230

USD/JPY –Bullish Double-Bottom Targeting Major Weekly ResistanceThis USD/JPY weekly chart is showing a clean double-bottom reversal structure formed at a strong higher-timeframe support zone (≈138.00–140.00). The first rejection created Swing Low 1, and the second rejection created Swing Low 2, both tapping the same demand block — a classic sign that buyers are aggressively defending this level.
Price then pushed upward, breaking toward the neckline, confirming early bullish momentum. Volume Profile on the right shows a clear low-volume pocket above current price, meaning once price breaks through the neckline area, it can accelerate very quickly toward the next major liquidity pool.
The primary upside target is the weekly resistance zone around 160.00–163.00, where previous supply and liquidity reside. The dotted projection on the chart represents bullish continuation, showing buyers likely stepping in on minor pullbacks.
Overall, this chart is signaling a high-probability bullish continuation, as structure, support, and volume profile all align for upside movement.

DIGIBYTE - A REVERSE DIAMOND ALMOST FORMED!!!📣 Hello everyone!
DigiByte is a fast-growing open source blockchain created in late 2013 and released in early 2014. After 11 years of thoughtful development, DigiByte has become one of the safest, fastest, longest, and most decentralized UTXO blockchains in the world.
Starting to use DigiByte is even easier than sending an SMS. You can send and receive DigiBytes using devices that you already know and love. All you need to do is install a DigiByte-supported Wallet, then click scan, scan the QR code, and send DigiByte. As simple as 1..2..3.
DigiByte has never been funded through an ICO or through a significant number of pre-minted coins (0% remaining). The project does not have a CEO or a company controlling the DigiByte blockchain. Developers and the community are unpaid volunteers who eliminate the risk of bankruptcy.
DigiByte transactions are confirmed within about 15 seconds, which is 40 times faster than Bitcoin and 10 times faster than Litecoin. SegWit allows for up to 1,066 transactions per second within the network, and low fees make DigiByte an ideal currency for daily payments.
DigiByte was created based on the non-breakable Bitcoin blockchain technology and various advanced enhancements were implemented, such as DigiShield protection, MultiAlgo mining, and the Odocrypt algorithm. In addition, the Dandelion++ privacy protocol helps protect you by hiding your IP and physical location. To learn more.
Compared to 21 million Bitcoins, 21 billion DigiBytes (a ratio to BTC of 1,000 to 1) were designed to be ready for mass adoption. DigiByte block rewards decrease by 1% each month, instead of halving every 4 years. All 21 billion DigiBytes will be mined by 2035. After 2035, miners will rely only on commission fees.
DigiByte is not just a fast digital currency. It is an innovative blockchain that can be used for digital assets, smart contracts, decentralized applications, and secure authentication.
__________________________________________
Technical information:
1. I believe a 3-year-long Diamond reversal pattern is forming on the chart, and we will soon see confirmation or refutation of my hypothesis!
2. The long-term goal is to test the global trend resistance, which is about 40x of the current price!!!
_________________________________________
Total: You can try cautious long-term purchases in installments according to your RM, strengthen your position after the pattern is biased!
That's all for today, I wish you good luck in making independent trading decisions and profit. Please analyze the information you receive from me, always think only with your head!
Goodbye! ✊

USDCHF I Monthly CLS I Model 1 I Target 50% of the rangeHi friends, new range created. As always we are looking for the manipulation in to the key level around the range. Don't forget confirmation switch from manipulation phase to the distribution phase to make the setup valid. Stay patient and enter only after change in order flow. If price reaches 50% of the range take partial or full close.
🧩 Complete proces and Strategy explained 👇 Click Below
🎯 Why your market approach also should be mechanical ?
NO Fixed Mechanical Trading Logic - You are guessing random patterns
NO Defined trading plan - Every trade different logic
NO Same logic in each trade - Not possible to backtest
NO Backtests on at least 300 trades - Not knowing Statistics
➡️ No Statistics ➡️ No Edge ➡️ Mindset ProblemS
🧠 Core of mindset problems
If you don't know your statistics on large enough data sample. You don't know your probabilities of win rate once the losing streak happen and it happens to every strategy. You will start doubting, hesitating to take next trade because you don't know statistics of your losses. In the end you will be doubting strategy and then jump to different one. You will be in the endless loop for years, looking for new better strategy. 👊 Your ultimate goal as a trader is not to be a generalist who knows 10 000 patterns. But rather create one system with narrowed criteria of each element of the trade to remove subjective and emotional decisions as much as possible and stick to this system no matter what. Practice it 10 000 times become a MASTER.
✨ Trading Mastery is reflection of your life
Have a longterm plan, No Alcohol & Drugs, Ignore others, Focus on your journey , Backtest regularly, Review your weeks, Journal mistakes, Exercise, Sleep well, Read books, Walks in nature (no phone) , Meditate, Reduce social media time, Spend time with family, Live Life.
Trading is hard, but not impossible. I believe in you 💪
David Perk aka Dave Fx Hunter

THE SAME STRATEGY EVERY DAYDuring the year I simplified my strategy to avoid doubts at the time of my entry, however I still have doubts when it comes to exiting or staying in.

When Crypto Actually MovesCrypto trades around the clock, but the market doesn’t behave the same way at every hour. Volume, liquidity, and volatility cluster around predictable windows, and those windows shape how setups form and how price reacts. When you understand these shifts, you stop taking trades randomly and start aligning execution with the moments when the market truly moves.
Why Sessions Matter
Even though crypto never sleeps, human traders and institutional desks still operate in cycles. Liquidity providers adjust during business hours. Market makers re-balance at session opens. Macro news is released on a fixed schedule. These patterns create recurring volatility signatures.
Ignoring sessions means you treat every candle as equal. Understanding sessions means you add a layer of context that improves timing, risk control, and win rate.
Asia Session (00:00–06:00 UTC)
The Asia window tends to be slower and more range-bound.
Characteristics include:
– Moderate liquidity
– Clean consolidations
– Accumulation before Europe
– Fewer impulsive moves unless driven by news from Asia-Pacific regions
This period often sets the initial range of the day. Liquidity begins to cluster above highs and below lows, creating the conditions for later sweeps.
Europe Session (07:00–12:00 UTC)
Liquidity expands significantly as London opens. You often see the first engineered move of the day.
Key behaviors:
– Early sweeps of the Asia range
– Strong breakouts from overnight compression
– Directional push before New York volatility
This session frequently defines the directional bias into US hours. It’s a prime window for structured setups because market participation rises sharply.
US Session (13:00–20:00 UTC)
This is the most active window. The highest liquidity and most decisive moves occur here.
Typical features:
– Strong continuation or full reversal of the London move
– Reaction to economic news
– Trend acceleration during peak overlap hours
This is where major breakouts, deep liquidity hunts, and high-powered moves happen. If you trade momentum or breakout strategies, this session offers the cleanest conditions.
Weekend Behavior
Weekends operate on thin liquidity. Order books are lighter, market makers are less active, and volatility behaves differently.
Common outcomes:
– Sharp wicks that violate structure
– Sudden spikes without follow-through
– False breakouts with immediate reversals
Weekend moves often distort technicals. They can be useful for narrative-driven positions but carry higher risk for intraday traders.
How to Integrate Sessions Into Your Trading
Use sessions to filter when you participate and when you avoid noise.
Practical adjustments:
– Execute momentum setups during Europe or US hours.
– Treat Asia session as a range-building phase suitable for scouting zones.
– Avoid taking aggressive positions during weekend chop.
– Use session opens as key decision points for liquidity grabs.
When you layer session timing on top of structure, you refine entries and eliminate trades that lack the environment for follow-through.
The Strategic Advantage of Session Awareness
Session timing gives you clarity. You start anticipating where liquidity is likely to be engineered, where volume will enter, and when the market is likely to trend or stall.
This transforms your approach.
Instead of reacting to candles, you plan around expected volatility cycles.
Instead of forcing trades, you wait for session transitions that historically produce reliable movement.
