Inflation and Interest Rates: Global Market ImpactIntroduction
Inflation and interest rates are two of the most critical economic variables that influence global markets. Their dynamics shape investment decisions, currency valuations, corporate strategies, and overall economic stability. Understanding their interplay is essential not only for policymakers and investors but also for businesses and individuals navigating a highly interconnected global economy.
Inflation refers to the sustained rise in the general price level of goods and services in an economy over a period of time. Moderate inflation is considered healthy for economic growth, as it encourages consumption and investment. However, excessive inflation erodes purchasing power, creates uncertainty, and can destabilize economies. Conversely, deflation—a sustained decline in prices—can lead to reduced consumer spending and economic stagnation.
Interest rates, typically determined by central banks, are the cost of borrowing money. They are a primary tool used to control inflation and stimulate or restrain economic activity. Lower interest rates tend to encourage borrowing and spending, while higher rates can dampen demand but stabilize prices. The relationship between inflation and interest rates is cyclical: inflation often prompts higher interest rates, and interest rates, in turn, affect inflationary trends.
Inflation Dynamics in the Global Economy
Global inflation is influenced by a combination of domestic and international factors. Key drivers include:
Supply and Demand Imbalances: When demand outpaces supply, prices increase. Conversely, excess supply can lead to deflationary pressures. Global supply chain disruptions, such as those caused by the COVID-19 pandemic, have historically fueled inflation in multiple sectors simultaneously.
Commodity Prices: Oil, gas, metals, and agricultural commodities are highly sensitive to geopolitical tensions and global demand fluctuations. Rising commodity prices often translate into higher production costs, which are passed on to consumers, driving inflation worldwide.
Currency Fluctuations: A weaker domestic currency makes imports more expensive, contributing to imported inflation. For example, a depreciation of the US dollar against other major currencies can lead to higher prices of imported goods in the United States, affecting global trade patterns.
Fiscal and Monetary Policies: Expansionary fiscal policies, such as increased government spending and tax cuts, can boost demand and trigger inflation if not matched by supply-side measures. Similarly, central bank monetary policies, including quantitative easing, influence money supply and inflation expectations.
Global Economic Integration: International trade, foreign investment, and cross-border capital flows link economies. Inflation in one major economy, such as the US or the EU, can ripple through global markets, affecting emerging markets that rely heavily on imports or foreign capital.
Interest Rate Mechanisms and Their Global Influence
Interest rates serve as the central lever to manage inflation and maintain economic stability. Central banks adjust rates primarily through policy rates, including the federal funds rate in the United States, the repo rate in India, or the European Central Bank's main refinancing rate. The impact of interest rate changes on global markets can be profound:
Capital Flows and Exchange Rates: Higher interest rates attract foreign investment seeking higher returns, strengthening the domestic currency. Conversely, lower rates can trigger capital outflows and currency depreciation. For instance, rising US interest rates historically strengthen the dollar, creating pressure on emerging market currencies and affecting global trade balances.
Investment Decisions: Interest rates influence the cost of borrowing for businesses and consumers. High rates discourage corporate expansion and consumer credit, reducing aggregate demand and cooling inflation. Low rates encourage borrowing, stimulate spending, and can boost equity markets.
Stock and Bond Markets: Interest rate changes affect asset valuations. Bonds are particularly sensitive; higher rates decrease bond prices, while lower rates increase them. Equity markets may react to rate hikes negatively if borrowing costs rise and profit margins shrink. However, sectors like banking may benefit from higher rates due to increased lending spreads.
Debt Sustainability: Both public and private debt levels are sensitive to interest rate movements. High global interest rates can strain heavily indebted countries and corporations, especially in emerging markets, increasing the risk of defaults and financial instability.
Inflation Expectations: Central banks often adjust rates preemptively to manage inflation expectations. Market participants closely watch central bank signals, as anticipated rate hikes or cuts influence spending, investment, and speculative behavior across asset classes.
Interaction Between Inflation and Interest Rates
The relationship between inflation and interest rates is intertwined, forming a feedback loop:
High Inflation → Higher Interest Rates: When inflation rises, central banks often raise interest rates to curb spending and borrowing, stabilizing prices. This was evident in the early 1980s when the US Federal Reserve, under Paul Volcker, aggressively raised rates to combat runaway inflation.
Low Inflation → Lower Interest Rates: In periods of low inflation or deflation, central banks reduce interest rates to stimulate demand. Japan's prolonged low-interest environment is a prime example of using rates to counter deflationary pressures.
Global Spillover Effects: Rate changes in one major economy affect other countries due to global capital mobility. For instance, when the Federal Reserve hikes rates, capital often flows from emerging markets to the US, causing currency depreciation and inflationary pressures abroad.
Expectations and Market Psychology: Inflation expectations shape consumer and investor behavior. If markets anticipate higher inflation, bond yields may rise even before central banks act. This self-reinforcing loop can amplify global financial volatility.
Impact on Global Financial Markets
Inflation and interest rate dynamics have far-reaching implications for financial markets worldwide:
Equity Markets: Higher interest rates increase borrowing costs and reduce corporate profitability, often leading to equity market corrections. Growth stocks, reliant on future earnings, are particularly sensitive to rate hikes. Conversely, lower rates generally support equity valuations and risk-taking.
Fixed Income Markets: Bonds and debt instruments are inversely related to interest rates. Rising rates lead to declining bond prices and higher yields, affecting pension funds, insurance companies, and global investors heavily invested in fixed income.
Foreign Exchange Markets: Currency values fluctuate in response to rate differentials and inflation trends. Countries with stable inflation and attractive interest rates see capital inflows, strengthening their currencies, while those with high inflation or low rates experience depreciation.
Commodity Markets: Inflation often drives commodity prices higher, particularly in energy, metals, and food sectors. Conversely, rising interest rates can depress commodity demand, as borrowing costs increase and consumption slows.
Global Trade and Investment: High inflation and interest rates can make exports less competitive, affecting trade balances. Foreign investors may shift funds to economies with higher real returns, influencing capital availability and investment in emerging markets.
Emerging Market Vulnerabilities
Emerging markets are particularly sensitive to global inflation and interest rate shifts:
Debt Exposure: Many emerging economies rely on external borrowing in foreign currencies. Rising global rates increase debt servicing costs, risking fiscal instability.
Capital Outflows: Rate hikes in developed economies can trigger capital flight from emerging markets, weakening currencies and increasing inflation through imported goods.
Inflation Management Challenges: Emerging markets often face structural constraints—like supply chain inefficiencies—that make controlling inflation difficult, amplifying the impact of global rate changes.
Policy Implications
Policymakers face a delicate balancing act:
Monetary Policy Coordination: Central banks must balance domestic objectives with global realities. Sudden rate changes in major economies can destabilize smaller economies, prompting coordinated interventions.
Inflation Targeting: Many central banks adopt explicit inflation targets to anchor expectations. By clearly communicating policy intentions, they reduce uncertainty in global markets.
Fiscal Prudence: Governments must complement monetary policy with sustainable fiscal measures to avoid exacerbating inflation or creating excessive debt burdens.
Risk Management for Investors: Global investors monitor inflation and interest rate trends to adjust portfolios, hedge currency risks, and manage exposure to sensitive sectors like real estate, utilities, and commodities.
Recent Trends and Lessons
The past decade has illustrated the intertwined nature of inflation and interest rates:
Post-Pandemic Inflation Surge: COVID-19 disrupted global supply chains, leading to inflation spikes in commodities and consumer goods. Central banks responded with gradual interest rate hikes to stabilize economies.
Energy and Geopolitical Shocks: Conflicts, sanctions, and energy price volatility have heightened global inflation risks, prompting rapid monetary responses.
Global Monetary Divergence: Different economies adopt varied approaches—some raising rates aggressively, others keeping them low—creating complex capital flow patterns and currency fluctuations.
These experiences highlight the importance of anticipating inflationary trends and proactively managing interest rate policies in a globally integrated economy.
Conclusion
Inflation and interest rates are pivotal forces that shape global economic landscapes. Their influence extends across financial markets, currencies, trade, and investment flows, creating a complex web of interdependencies. Policymakers must navigate the delicate balance between stimulating growth and controlling inflation, while investors and businesses must adapt strategies to manage risk and seize opportunities.
In an increasingly interconnected world, no economy operates in isolation. Inflation in one region can ripple through global markets, prompting interest rate adjustments and influencing investment decisions worldwide. The synergy between inflation and interest rates underscores the importance of careful monitoring, timely intervention, and strategic foresight in maintaining financial stability and fostering sustainable growth.
Understanding these dynamics equips market participants to anticipate shifts, mitigate risks, and capitalize on opportunities, emphasizing the central role of inflation and interest rates in shaping the global economic narrative.
Contains image
Introduction and Types of Financial MarketsIntroduction to Financial Markets
Financial markets form the backbone of any modern economy, serving as a bridge between investors seeking returns and borrowers in need of capital. Essentially, a financial market is a marketplace where buyers and sellers trade financial instruments such as stocks, bonds, currencies, and derivatives. These markets facilitate the allocation of resources efficiently, ensuring that funds flow from those who have surplus capital to those who can utilize it productively.
Financial markets are integral to economic growth. They not only provide a mechanism for raising capital but also aid in price discovery, risk management, liquidity creation, and wealth management. By providing transparency and efficiency, financial markets reduce the cost of capital for firms and promote economic stability.
Key Functions of Financial Markets
Capital Formation: Financial markets enable firms and governments to raise funds by issuing securities, which can then be used for expansion, infrastructure, or social development.
Price Discovery: They provide a platform where the prices of financial assets are determined through supply-demand interactions.
Liquidity: Investors can quickly convert their securities into cash, enhancing market confidence.
Risk Management: Derivative markets allow participants to hedge against risks like fluctuations in interest rates, commodity prices, and currencies.
Efficient Resource Allocation: By channeling funds from savers to productive investments, financial markets ensure that capital is allocated to sectors promising the highest returns.
Classification of Financial Markets
Financial markets can be classified in multiple ways depending on the instruments traded, the maturity of instruments, and the nature of participants. Broadly, they are categorized into money markets, capital markets, derivative markets, foreign exchange markets, and commodity markets.
1. Money Market
The money market deals with short-term debt instruments with maturities of one year or less. It is crucial for maintaining liquidity in the financial system. The primary participants in the money market are commercial banks, central banks, corporations, and government entities.
Key Features:
Short-term instruments (up to 1 year)
High liquidity
Low risk compared to long-term securities
Primarily used for managing working capital
Instruments in the Money Market:
Treasury Bills (T-Bills): Government-issued securities with maturities ranging from a few days to one year. They are low-risk instruments used for short-term financing.
Commercial Papers (CPs): Unsecured promissory notes issued by corporations to meet short-term funding needs.
Certificates of Deposit (CDs): Bank-issued instruments for fixed deposits with short maturities, offering liquidity and moderate returns.
Repurchase Agreements (Repos): Short-term borrowing agreements for selling and repurchasing government securities.
The money market ensures stability by providing a channel for short-term funds and helps in implementing monetary policy by regulating liquidity.
2. Capital Market
The capital market focuses on long-term financial instruments with maturities exceeding one year. It is vital for raising long-term funds for business expansion, infrastructure development, and national projects. The capital market is divided into primary markets and secondary markets.
a) Primary Market (New Issue Market):
This is where new securities are issued directly to investors. Companies raise funds by issuing equity (shares) or debt (bonds). The process of issuing new securities is commonly known as an Initial Public Offering (IPO) for equity.
b) Secondary Market (Stock Exchanges):
Here, previously issued securities are bought and sold among investors. Stock exchanges like the New York Stock Exchange (NYSE) or National Stock Exchange (NSE) in India provide a platform for liquidity, price discovery, and risk-sharing.
Instruments in the Capital Market:
Equities (Shares): Represent ownership in a company, entitling shareholders to profits in the form of dividends.
Bonds/Debentures: Long-term debt instruments issued by corporations or governments to raise capital.
Mutual Funds: Pooled investment vehicles that invest in stocks, bonds, or other securities, offering diversification to small investors.
Significance of Capital Markets:
Mobilize savings for productive use
Facilitate wealth creation for investors
Support economic growth through capital formation
3. Derivative Market
Derivatives are financial contracts whose value derives from underlying assets like stocks, bonds, currencies, or commodities. The derivative market allows participants to hedge against risks or speculate for potential gains.
Key Types of Derivatives:
Futures Contracts: Agreements to buy or sell an asset at a predetermined price on a future date.
Options Contracts: Contracts that give the buyer the right (but not obligation) to buy or sell an asset at a specified price within a certain period.
Swaps: Agreements to exchange cash flows or other financial instruments between parties, commonly used for interest rate or currency risk management.
Functions of Derivative Markets:
Hedging against price or interest rate fluctuations
Enhancing market liquidity
Enabling price discovery for underlying assets
While derivatives can be used to manage risk, excessive speculation in this market may introduce volatility.
4. Foreign Exchange (Forex) Market
The foreign exchange market is a global decentralized market for trading currencies. It determines the relative value of one currency against another and supports international trade and investment.
Key Features:
Operates 24/7 across different time zones
Facilitates currency conversion for trade and investment
Influences inflation, interest rates, and trade balances
Major Participants:
Commercial banks
Central banks
Multinational corporations
Hedge funds and retail investors
Functions:
Provides exchange rate mechanism
Manages currency risk through hedging instruments like forwards and options
Supports global liquidity and capital flows
5. Commodity Market
The commodity market deals with trading physical goods such as metals, energy products, agricultural produce, and more. Commodity markets are split into spot markets (immediate delivery) and futures markets (contracts for future delivery).
Major Commodities Traded:
Agricultural Products: Wheat, corn, coffee, sugar
Energy Commodities: Crude oil, natural gas, coal
Metals: Gold, silver, copper
Significance:
Provides a hedging mechanism for producers and consumers
Helps in price discovery and risk management
Promotes efficient allocation of resources in the economy
6. Over-the-Counter (OTC) Market
In addition to organized exchanges, many financial instruments are traded directly between parties in OTC markets. This includes derivatives, currencies, and bonds. OTC markets are less regulated than exchanges but provide flexibility in contract terms and counterparty customization.
Emerging Trends in Financial Markets
Financial markets are evolving rapidly due to technology, globalization, and regulatory reforms. Some notable trends include:
Digital Trading Platforms: Online stock brokers and mobile apps have made investing accessible to retail investors worldwide.
Algorithmic and High-Frequency Trading: Automated systems now execute trades at millisecond speeds, enhancing market efficiency.
Cryptocurrency and Blockchain: Digital currencies like Bitcoin and Ethereum are creating decentralized markets independent of traditional financial systems.
Sustainable Finance: ESG (Environmental, Social, and Governance) investing is growing, promoting socially responsible investment practices.
Global Integration: Capital flows across borders are increasing, creating interconnected markets that respond rapidly to international economic events.
Conclusion
Financial markets are the lifeblood of any economy, serving as a conduit for savings, investment, and capital formation. By facilitating efficient resource allocation, providing liquidity, enabling risk management, and supporting economic growth, these markets create opportunities for individuals, corporations, and governments alike.
From the short-term money market to the long-term capital market, from derivatives and forex trading to commodity markets, each segment serves a unique function, contributing to the stability and growth of the financial ecosystem. With technological advancements and globalization, financial markets continue to evolve, providing innovative tools and opportunities for investors while shaping the future of economic development.
Understanding the structure and function of these markets is crucial for policymakers, investors, and businesses, as it enables informed decisions, better risk management, and strategic planning in a dynamic global economy.
The Expanding Horizon of Global InvestingUnderstanding Global Investing
Global investing involves allocating capital across international markets, industries, and financial instruments. Unlike domestic investing, which confines opportunities to a single country, global investing allows investors to access equities, bonds, commodities, real estate, and other assets across borders. The rationale is straightforward: diversification reduces risk while enhancing the potential for returns. By investing globally, investors are less exposed to the economic, political, or regulatory volatility of a single nation.
Global investing takes various forms. Some investors focus on developed markets such as the United States, Europe, or Japan, attracted by stability, transparency, and established financial infrastructure. Others target emerging and frontier markets, including countries in Asia, Africa, and Latin America, drawn by high growth potential and demographic advantages. A balanced global portfolio often combines both approaches, capturing the security of developed markets while capitalizing on the growth prospects of emerging economies.
Drivers of the Global Investing Trend
Several factors have fueled the rise of global investing. These drivers encompass economic, technological, and regulatory dimensions.
Economic Globalization: The integration of global markets has expanded opportunities for investors. Companies operate internationally, supply chains span continents, and trade volumes have skyrocketed. As a result, local market performance is increasingly influenced by global economic trends. Investors who remain domestically confined may miss the growth occurring elsewhere, making global investing essential for capitalizing on worldwide opportunities.
Technological Advancements: Technology has democratized access to international markets. Digital trading platforms, online brokerage services, and real-time market data allow individual investors to participate in foreign exchanges with unprecedented ease. Additionally, financial technology innovations such as robo-advisors, algorithmic trading, and blockchain-based investment platforms have made global investing more efficient, cost-effective, and transparent.
Regulatory Harmonization: Over the past few decades, many countries have adopted policies encouraging foreign investment. Liberalization of capital accounts, improved investor protection laws, and the standardization of financial reporting have reduced barriers to entry. This regulatory support has made cross-border investing safer and more appealing, especially for institutional investors managing large portfolios.
Demographic Shifts and Wealth Accumulation: Growing middle-class populations in emerging economies and increased wealth in developed nations have created a surge in global investment capital. Investors are actively seeking diversified opportunities to preserve and grow wealth, often looking beyond their home countries for higher returns.
Benefits of Global Investing
The advantages of investing globally are multifaceted and extend beyond the traditional goal of financial returns.
Diversification: The core principle driving global investing is diversification. Different countries and regions often experience varying economic cycles. While one market may suffer a downturn, another may thrive. Global exposure reduces the impact of localized economic shocks, political instability, or currency fluctuations on an investor’s portfolio.
Access to High-Growth Markets: Emerging markets, in particular, offer compelling growth opportunities. Nations experiencing rapid industrialization, urbanization, and technological adoption often witness significant equity market expansion. Investors who strategically allocate capital to these regions can benefit from high potential returns that may not be available domestically.
Currency Diversification: Global investing introduces exposure to multiple currencies. While currency risk exists, this diversification can also be advantageous. Appreciation in foreign currencies relative to the investor’s home currency can enhance returns. Moreover, spreading investments across multiple currencies can reduce the overall volatility of a portfolio.
Broader Investment Opportunities: International markets provide access to unique sectors and companies not available domestically. For instance, investors in the United States may gain exposure to Asia’s booming technology sector, Africa’s natural resources, or Europe’s green energy initiatives. This access enables more comprehensive portfolio construction.
Inflation Hedge: Certain international assets can act as a hedge against domestic inflation. For example, investing in countries with lower inflation rates or in hard assets such as commodities can protect purchasing power when domestic inflation erodes the value of investments.
Challenges and Risks
While global investing presents substantial opportunities, it is not without challenges. Investors must navigate a complex landscape that involves various risks.
Currency Risk: Fluctuations in exchange rates can affect returns. An appreciating home currency may reduce the value of foreign investments, while a depreciating home currency can amplify gains or losses.
Political and Regulatory Risk: Political instability, changes in government policies, and regulatory uncertainties can significantly impact foreign investments. For instance, sudden restrictions on foreign capital flows or expropriation of assets can lead to losses.
Market and Economic Risk: Economic downturns, financial crises, and market volatility in a foreign country can adversely affect investments. Emerging markets, in particular, are prone to higher volatility due to less mature financial systems.
Information and Transparency Challenges: Investors may face difficulties in accessing reliable information about foreign markets. Differences in accounting standards, corporate governance practices, and financial reporting can pose challenges in evaluating investment opportunities.
Transaction Costs: Investing internationally can involve higher costs, including brokerage fees, taxes, and currency conversion charges. Although technology has reduced some of these barriers, they remain an important consideration in portfolio construction.
Instruments and Strategies for Global Investing
Global investing encompasses a variety of instruments and strategies tailored to different investor profiles.
Equities: Investing in foreign stocks allows participation in the growth of international companies. Investors can purchase individual stocks listed on foreign exchanges or invest in Exchange-Traded Funds (ETFs) that track international indices.
Bonds: Sovereign and corporate bonds issued by foreign governments and companies provide income and diversification. Investors may choose bonds from developed markets for stability or emerging markets for higher yields.
Mutual Funds and ETFs: International mutual funds and ETFs pool capital to invest in global assets. They provide diversification, professional management, and easy access to foreign markets, especially for individual investors.
Alternative Investments: Real estate, commodities, private equity, and hedge funds offer additional avenues for global exposure. These alternatives can enhance returns and provide hedges against inflation and market volatility.
Currency Hedging Strategies: To mitigate currency risk, investors may employ hedging techniques such as forward contracts, options, and currency ETFs. Hedging allows investors to stabilize returns without sacrificing exposure to foreign markets.
The Role of Institutional Investors
Institutional investors such as pension funds, insurance companies, and sovereign wealth funds play a pivotal role in global investing. These entities manage large pools of capital and often have the resources and expertise to navigate complex international markets. Their participation has increased market liquidity, enhanced price discovery, and contributed to the development of global financial markets. Institutional strategies often include a mix of equities, fixed income, and alternative investments, carefully calibrated to achieve long-term growth while managing risk.
Technology and Global Investing
Technological innovation continues to reshape global investing. Digital platforms enable seamless access to international markets, while advanced analytics, artificial intelligence, and big data allow investors to make informed decisions. Moreover, blockchain and decentralized finance (DeFi) are creating new opportunities for cross-border investments, potentially reducing reliance on traditional intermediaries and increasing transparency. Technology also facilitates global portfolio monitoring, performance tracking, and risk management, making international investing more accessible to retail investors.
Future Outlook
The horizon of global investing is expanding faster than ever. Several trends are likely to shape its future:
Sustainable and ESG Investing: Environmental, social, and governance (ESG) criteria are increasingly influencing investment decisions globally. Investors are looking for companies and countries that prioritize sustainability, ethical governance, and social responsibility. This trend is driving capital toward green technologies, renewable energy, and socially responsible enterprises worldwide.
Emerging Market Growth: Emerging markets are expected to continue driving global economic growth. Rising incomes, urbanization, and technological adoption will create new opportunities for investors seeking long-term returns.
Integration of Advanced Technologies: Artificial intelligence, machine learning, and blockchain will enhance global investing strategies, improve risk management, and provide innovative solutions for portfolio optimization.
Geopolitical Dynamics: Geopolitical shifts, trade agreements, and international policy decisions will influence global investment flows. Investors will need to adapt strategies to navigate complex global interactions while balancing risk and reward.
Conclusion
The expanding horizon of global investing represents a paradigm shift in the financial world. It is a reflection of economic globalization, technological innovation, and evolving investor preferences. While opportunities abound, global investing requires careful consideration of risks, diversification strategies, and market dynamics. Investors who embrace a global perspective are better positioned to achieve long-term growth, mitigate risk, and participate in the wealth creation unfolding across the world.
Global investing is not just a strategy—it is a mindset that recognizes the interconnectedness of economies, the power of diversification, and the limitless potential of worldwide markets. As barriers continue to diminish and opportunities proliferate, the horizon for investors is broader, more dynamic, and richer than ever before.
How Global Trade Balances Shape Exchange RatesIntroduction
In the intricate world of international finance, exchange rates act as the pulse of global trade and economic stability. They influence everything from a nation’s export competitiveness to the purchasing power of consumers and the flow of international investments. While many factors affect currency values—such as interest rates, inflation, and government policies—global trade balances remain one of the most powerful and enduring determinants of exchange rate movements. The balance between a country’s exports and imports, known as the current account balance, directly reflects the demand and supply for its currency in the global marketplace.
Understanding how trade balances shape exchange rates requires examining the interconnected mechanisms of trade flows, currency demand, investor sentiment, and macroeconomic fundamentals. This discussion will explore these dynamics in depth, analyzing the theoretical foundations, real-world examples, and long-term implications for nations and markets.
The Concept of Global Trade Balances
A trade balance represents the difference between a country’s exports and imports of goods and services over a specific period.
Trade surplus occurs when a country exports more than it imports, indicating that foreign buyers are purchasing more domestic goods and services, thus creating a net inflow of foreign currency.
Trade deficit occurs when imports exceed exports, leading to an outflow of domestic currency to pay for foreign goods and services.
This balance is a key component of the current account, which also includes net income from abroad and unilateral transfers (like remittances or foreign aid). Persistent surpluses or deficits signal structural economic patterns that can significantly influence a nation’s currency value.
The Link Between Trade Balances and Exchange Rates
The relationship between trade balances and exchange rates is primarily governed by the demand and supply for currencies.
When a country exports goods, foreign buyers must pay in the exporter’s currency. For example, when U.S. companies sell products abroad, international buyers must acquire U.S. dollars, increasing demand for the dollar.
Conversely, when a country imports goods, it must sell its own currency to buy foreign currency, increasing supply and potentially weakening its exchange rate.
Thus, a trade surplus typically strengthens a nation’s currency, while a trade deficit tends to weaken it. However, this relationship is influenced by numerous short-term and long-term factors, including monetary policy, capital flows, and investor confidence.
Theoretical Foundations
1. The Balance of Payments Model
This model integrates trade balances within the broader context of international financial transactions. The balance of payments (BoP) consists of two major accounts:
Current account: Tracks trade in goods and services, income, and transfers.
Capital and financial account: Records investment flows, such as foreign direct investment (FDI) and portfolio investments.
When a country runs a current account deficit, it must finance it through capital inflows—borrowing from abroad or attracting foreign investments. To do so, it must make its assets attractive, often by offering higher interest rates or a weaker currency. Conversely, a current account surplus allows a nation to invest abroad, strengthening its currency.
2. Purchasing Power Parity (PPP)
The PPP theory states that in the long run, exchange rates should adjust so that identical goods cost the same across countries. If one country has persistent trade surpluses, its currency may appreciate until its goods become more expensive, reducing export competitiveness and restoring equilibrium. Similarly, a deficit nation’s currency may depreciate, making its exports cheaper and correcting the imbalance.
3. Elasticities Approach and the J-Curve Effect
The elasticities approach explains that the effect of a currency depreciation on the trade balance depends on the price elasticity of exports and imports. Initially, a depreciation may worsen the trade balance—known as the J-Curve effect—because import prices rise faster than export volumes adjust. Over time, as exports become more competitive and import demand falls, the trade balance improves, strengthening the currency.
How Trade Surpluses Influence Exchange Rates
A trade surplus reflects a situation where a country exports more than it imports. This surplus leads to an inflow of foreign currency, which increases demand for the domestic currency in foreign exchange markets.
Key Effects:
Currency Appreciation: Foreign buyers purchase domestic currency to pay for exports, pushing up its value.
Stronger Economic Position: A trade surplus often reflects industrial competitiveness, high productivity, and robust demand for domestic goods.
Capital Outflows: Surplus nations often invest abroad to balance their BoP, which can stabilize appreciation pressures.
Example:
China and Germany are classic examples of surplus economies. China’s sustained trade surpluses over the past two decades supported steady demand for the yuan. However, to avoid excessive appreciation that could hurt exports, the Chinese central bank has often intervened to stabilize the currency. Similarly, Germany’s strong export-driven economy supports a robust euro, even amid economic divergence within the Eurozone.
How Trade Deficits Influence Exchange Rates
A trade deficit indicates that a country imports more than it exports, creating downward pressure on its currency.
Key Effects:
Currency Depreciation: The country sells more of its currency to purchase foreign goods, increasing supply in global markets and lowering its value.
Rising External Debt: Persistent deficits may force countries to borrow from abroad or attract foreign capital to finance their imbalance.
Vulnerability to Investor Sentiment: A large deficit can trigger fears about sustainability, leading to currency depreciation or capital flight.
Example:
The United States provides an interesting case. Despite chronic trade deficits, the U.S. dollar remains strong because of its global reserve currency status and deep financial markets. This anomaly shows that while trade balances are a major driver, other structural factors can offset the expected impact on exchange rates. In contrast, countries like Turkey or Argentina, which run high deficits without strong investor confidence, often experience rapid currency depreciation.
Capital Flows and the Balancing Mechanism
In the modern globalized economy, capital flows play an increasingly critical role in balancing trade imbalances.
A deficit nation can offset its trade imbalance through foreign investment inflows, such as FDI or portfolio investments. These inflows create demand for the local currency, temporarily supporting its value. Similarly, a surplus country may see capital outflows as it invests abroad, preventing excessive appreciation.
For instance:
The United States runs large current account deficits but attracts massive capital inflows from foreign investors who buy U.S. Treasury bonds, equities, and real estate.
Japan, with consistent trade surpluses, invests heavily in foreign assets, which partially offsets upward pressure on the yen.
Thus, the relationship between trade balances and exchange rates must always be analyzed alongside capital and financial account movements.
The Role of Central Banks and Government Policies
Governments and central banks frequently intervene to manage exchange rates, particularly when trade imbalances threaten economic stability.
Foreign Exchange Intervention:
Central banks may buy or sell their own currency in foreign exchange markets to influence its value. For example, the People’s Bank of China has often intervened to prevent excessive yuan appreciation to protect export competitiveness.
Monetary Policy Adjustments:
Changes in interest rates can attract or repel foreign capital, indirectly affecting exchange rates. A country facing a large trade deficit might raise interest rates to support its currency or encourage investment inflows.
Fiscal and Trade Policies:
Governments can also address trade imbalances through tariffs, subsidies, or import restrictions, which alter demand for foreign and domestic goods and indirectly impact currency demand.
Case Studies
1. The U.S. Dollar and the Twin Deficits
The United States has historically run both fiscal deficits (budget shortfalls) and trade deficits, known collectively as the “twin deficits.” Conventional theory suggests this should weaken the dollar, yet global demand for dollar-denominated assets keeps it strong. The dollar’s role as the world’s reserve currency and the depth of U.S. capital markets allow it to defy typical trade-driven depreciation pressures.
2. Japan’s Yen and Export Strength
Japan’s economy relies heavily on exports, creating consistent trade surpluses. As a result, the yen often appreciates in times of global uncertainty, as investors view it as a safe-haven currency backed by strong fundamentals and external surpluses.
3. Emerging Markets and Deficit Pressures
Countries like India, Brazil, and Turkey often face currency depreciation during periods of high trade deficits and rising oil import bills. When deficits widen, investor confidence can weaken, leading to capital outflows and downward pressure on their currencies.
The Global Perspective: Interconnected Currencies
In a highly interconnected world, one nation’s trade balance affects others. For example, if the U.S. dollar strengthens, emerging market currencies often weaken, making their exports more competitive but raising the cost of dollar-denominated debt. Similarly, the euro-dollar or yuan-dollar dynamics influence global trade flows, commodity prices, and financial stability.
Moreover, global supply chains blur traditional trade balance calculations. Many countries import raw materials, assemble goods, and re-export them, making it harder to measure true trade imbalances. This complexity requires policymakers to consider value-added trade measures rather than gross exports and imports.
Long-Term Implications
In the long run, persistent trade imbalances can have structural impacts:
Currency Realignment: Over time, exchange rates tend to adjust toward equilibrium levels that correct persistent imbalances.
Competitiveness Shifts: Currency appreciation can erode export competitiveness, while depreciation can stimulate domestic industries.
Global Economic Rebalancing: Trade imbalances contribute to global financial cycles—surplus nations accumulate reserves, while deficit nations accumulate debt, leading to periodic adjustments through market corrections or policy interventions.
Conclusion
The intricate relationship between global trade balances and exchange rates lies at the heart of international economics. Trade surpluses and deficits shape currency demand, influence investor flows, and determine the relative strength of national economies. While the fundamental rule holds that trade surpluses strengthen currencies and deficits weaken them, the modern world introduces layers of complexity—ranging from capital flows and central bank policies to geopolitical factors and global supply chains.
Ultimately, exchange rates serve as a reflection of a country’s overall economic health, competitiveness, and integration with the world economy. Understanding how trade balances shape currency movements not only helps policymakers design sound economic strategies but also allows investors and traders to navigate the global financial landscape with greater insight and precision.

Historical Background of Competitive DevaluationIntroduction
Competitive devaluation refers to a deliberate downward adjustment in the value of a nation’s currency, aimed at gaining a trade advantage over other countries. By making exports cheaper and imports more expensive, a country can boost domestic production and employment. However, when several nations engage in such policies simultaneously, it often leads to a “currency war,” where no country gains significantly, and global trade stability is threatened.
The phenomenon of competitive devaluation has deep historical roots, closely tied to changes in the global monetary system, major economic crises, and evolving international trade relations. Understanding its historical background provides insight into the motives behind currency manipulation and its far-reaching economic consequences.
1. Early Origins of Currency Devaluation
1.1 The Pre–Gold Standard Era
Before the establishment of formal monetary systems, many countries operated on bimetallic standards using gold and silver. Devaluation during this period often took the form of reducing the metal content in coins, known as debasement. Monarchs and governments used this strategy to finance wars or debts without raising taxes.
For example, during the 16th and 17th centuries, European powers like Spain and France frequently debased their coinage, resulting in inflation and loss of public trust in money. While these early instances were not “competitive” in the modern sense, they set a precedent for government intervention in currency values to achieve economic or fiscal goals.
1.2 The Classical Gold Standard (1870–1914)
Under the Classical Gold Standard, major economies fixed their currencies to a specific quantity of gold. This system promoted exchange rate stability and facilitated international trade.
However, maintaining a fixed gold parity required discipline: countries with trade deficits had to tighten monetary policy, while those with surpluses expanded theirs. As a result, devaluation was rare and often viewed as a sign of economic weakness.
Nevertheless, towards the end of this era, some countries began manipulating their gold parity to improve trade balances, foreshadowing the competitive devaluations that would emerge in the 20th century.
2. Competitive Devaluation During the Interwar Period (1919–1939)
2.1 The Collapse of the Gold Standard After World War I
World War I disrupted the international gold standard. Countries abandoned gold convertibility to finance military expenditures, leading to inflation and fiscal imbalances.
After the war, many nations attempted to restore the gold standard, but exchange rates were misaligned, and economies were struggling with debt and unemployment. The United Kingdom, for instance, returned to the gold standard in 1925 at its pre-war parity, overvaluing the pound and causing deflationary pressure.
The rigid adherence to gold parity prevented countries from adjusting to post-war economic realities, setting the stage for competitive devaluation during the 1930s.
2.2 The Great Depression and the Currency Wars of the 1930s
The Great Depression (1929–1939) marked the most intense period of competitive devaluation in modern history. When the U.S. stock market crashed in 1929, global trade contracted sharply. In response, countries sought to protect their economies by devaluing their currencies to make exports cheaper and stimulate growth.
The United Kingdom led the way by abandoning the gold standard in 1931, allowing the pound to depreciate by around 30%. This improved Britain’s export competitiveness but harmed trading partners still tied to gold.
Following Britain, Japan, the Scandinavian countries, and many members of the British Commonwealth also left gold and devalued their currencies. The United States followed suit in 1933, when President Franklin D. Roosevelt devalued the dollar by raising the gold price from $20.67 to $35 per ounce, effectively reducing the dollar’s value by 40%.
The countries that remained on gold, such as France and Switzerland, faced worsening trade deficits and economic stagnation. By 1936, even France was forced to devalue, effectively ending the interwar gold standard.
2.3 Consequences of 1930s Competitive Devaluation
The wave of devaluations in the 1930s led to a “beggar-thy-neighbor” spiral. Each country sought to gain at others’ expense, but the net effect was destructive.
Instead of reviving global demand, competitive devaluation disrupted trade and led to retaliation through tariffs and import quotas — notably the U.S. Smoot-Hawley Tariff Act of 1930, which worsened the depression.
The interwar experience demonstrated that uncoordinated exchange rate policies could deepen global economic instability. This lesson would strongly influence post–World War II monetary arrangements.
3. Post–World War II and the Bretton Woods Era (1944–1971)
3.1 Establishment of the Bretton Woods System
In 1944, as World War II drew to a close, representatives from 44 Allied nations met in Bretton Woods, New Hampshire, to design a new international monetary order. The resulting Bretton Woods System established the U.S. dollar as the anchor currency, convertible to gold at $35 per ounce, while other currencies were pegged to the dollar within a narrow band of ±1%.
The aim was to ensure exchange rate stability while allowing limited flexibility to adjust parities in case of “fundamental disequilibrium.” To oversee the system, the International Monetary Fund (IMF) was created to provide financial assistance and policy coordination.
3.2 Early Devaluations and Adjustments (1949–1967)
Although Bretton Woods reduced currency volatility, some countries still resorted to devaluation.
In 1949, the United Kingdom devalued the pound from $4.03 to $2.80 due to persistent trade deficits. Over 20 other countries followed with similar moves, marking one of the first coordinated postwar devaluation waves.
Throughout the 1950s and 1960s, European and Asian economies gradually recovered, and competitive pressures eased. However, France (1958) and the U.K. (1967) again devalued when their external positions deteriorated.
The United States, on the other hand, began facing balance-of-payments deficits as it financed global military commitments and foreign aid. This trend eventually eroded confidence in the dollar’s gold convertibility.
3.3 The Collapse of Bretton Woods and the Return of Floating Rates
By the late 1960s, growing U.S. inflation and foreign dollar holdings made the gold peg unsustainable. In 1971, President Richard Nixon suspended dollar convertibility into gold — the famous “Nixon Shock” — effectively ending Bretton Woods.
Following this, most major currencies adopted floating exchange rates by 1973. Under the new regime, devaluations occurred through market forces rather than government decree, but the temptation for competitive depreciation persisted, especially during recessions and oil crises.
4. Competitive Devaluation in the Late 20th Century
4.1 The 1980s: Dollar Appreciation and the Plaza Accord
During the early 1980s, U.S. monetary tightening to combat inflation caused the dollar to appreciate sharply. The strong dollar hurt American exports and led to growing trade deficits, particularly with Japan and West Germany.
In 1985, the Plaza Accord was signed by the G5 nations (U.S., Japan, West Germany, France, and the U.K.) to coordinate a controlled depreciation of the U.S. dollar. The agreement marked a rare instance of multilateral cooperation to prevent a potential currency war.
The Plaza Accord succeeded in lowering the dollar’s value but led to side effects, including asset bubbles in Japan, which eventually contributed to its 1990s stagnation.
4.2 The 1990s: Emerging Market Crises
The 1990s witnessed several exchange rate crises in emerging economies, often triggered by speculative attacks and unsustainable pegs.
Notable examples include:
The Mexican Peso Crisis (1994)
The Asian Financial Crisis (1997)
The Russian Ruble Crisis (1998)
In these cases, countries were forced to devalue their currencies sharply to restore competitiveness and stabilize capital flows. While these were not deliberate “competitive” devaluations, they nonetheless affected global trade dynamics and influenced neighboring economies’ exchange rate policies.
5. Competitive Devaluation in the 21st Century
5.1 The 2008 Global Financial Crisis and “Currency Wars”
The 2008 financial crisis reignited fears of competitive devaluation. As growth slowed, central banks in advanced economies adopted ultra-loose monetary policies, including near-zero interest rates and quantitative easing (QE).
These measures weakened their currencies, prompting accusations of “currency manipulation.”
In 2010, Brazil’s finance minister Guido Mantega famously warned of an ongoing “currency war”, as capital inflows and volatile exchange rates disrupted emerging markets. Countries like Japan and China were accused of maintaining artificially weak currencies to support exports.
The U.S. Federal Reserve’s QE programs indirectly pushed the dollar lower, while the European Central Bank (ECB) and Bank of Japan (BOJ) followed similar strategies to stimulate their economies, fueling global tensions.
5.2 China’s Role and the Modern Era of Currency Competition
China’s exchange rate policies have been central to modern competitive devaluation debates. Since the early 2000s, China has managed its yuan (renminbi) within a controlled band, often accused of keeping it undervalued to boost exports.
While China allowed gradual appreciation after 2005, it intervened again during global slowdowns, particularly in 2015–2016, when it unexpectedly devalued the yuan to support growth amid slowing demand.
These moves sparked volatility in global markets and renewed concerns about competitive currency adjustments among major trading nations.
5.3 The COVID-19 Pandemic and Global Monetary Expansion
The COVID-19 pandemic (2020–2022) led to unprecedented monetary stimulus. Central banks worldwide cut interest rates and expanded liquidity to stabilize economies. This large-scale monetary expansion weakened many currencies simultaneously.
However, since the crisis was global, no single country gained a competitive edge. Instead, the era underscored how interconnected monetary policies had become — where actions in one major economy (like the U.S.) could ripple across the world’s financial system almost instantly.
6. Lessons from History
6.1 Coordination vs. Competition
History demonstrates that coordinated monetary action, as in the Plaza Accord, can mitigate harmful effects of currency volatility, whereas unilateral devaluations, as seen in the 1930s, often worsen global instability.
6.2 Short-Term Gains, Long-Term Costs
While devaluation can temporarily improve trade balances, its effects fade as inflation rises and trading partners retaliate. Sustainable competitiveness depends on productivity and innovation, not exchange rate manipulation.
6.3 Role of International Institutions
The IMF, World Bank, and World Trade Organization (WTO) continue to monitor and discourage currency manipulation. However, enforcement remains challenging, especially with the rise of flexible exchange rates and complex capital flows.
Conclusion
The history of competitive devaluation reflects the tension between national self-interest and global economic cooperation. From the 1930s currency wars to modern-day monetary easing, the temptation to use exchange rates as a policy tool has persisted.
However, historical experience consistently reveals that competitive devaluation rarely produces lasting prosperity. Instead, it undermines confidence, destabilizes trade, and erodes the foundations of international monetary cooperation.
In the modern era, as economies become more interconnected, the path to sustainable growth lies not in depreciating currencies but in fostering innovation, improving productivity, and strengthening multilateral coordination. The lessons of the past remain clear: in a globalized economy, currency competition benefits no one — cooperation benefits all.
Understanding the Dynamics of Commodity Prices1. What Are Commodities and Why Do Their Prices Matter?
Commodities are basic raw materials or primary agricultural products that can be bought and sold, often standardized and interchangeable within the same grade. They are broadly classified into two types:
Hard Commodities – Natural resources that are mined or extracted, such as oil, gold, copper, and natural gas.
Soft Commodities – Agricultural products or livestock, such as coffee, wheat, sugar, and cotton.
Commodity prices play a pivotal role in determining the cost of goods and services. For instance, a surge in oil prices can increase transportation and manufacturing costs, leading to overall inflation. Similarly, falling food prices can influence rural incomes and consumption patterns in agricultural economies like India or Brazil. Hence, understanding commodity price dynamics is essential for policymakers, investors, and businesses alike.
2. The Law of Supply and Demand
The most fundamental principle driving commodity prices is supply and demand. When demand exceeds supply, prices rise; when supply surpasses demand, prices fall. However, in commodity markets, these shifts are rarely immediate or smooth because both supply and demand are influenced by a variety of short-term and long-term factors.
Demand Factors:
Economic Growth: Industrial expansion boosts demand for energy, metals, and agricultural commodities. For example, China’s rapid industrialization in the 2000s fueled massive demand for iron ore and copper.
Population Growth and Urbanization: As populations grow and cities expand, consumption of food, energy, and construction materials increases.
Technological Development: New technologies, such as electric vehicles, can alter demand patterns — increasing demand for lithium, nickel, and cobalt while reducing oil dependence.
Consumer Preferences: Dietary shifts (e.g., toward meat consumption) can raise demand for animal feed grains like corn and soybeans.
Supply Factors:
Production Capacity: Limited resources, mining capacity, or arable land can constrain supply.
Weather and Climate: Droughts, floods, or hurricanes can drastically affect agricultural output.
Geopolitical Stability: Wars, sanctions, and political unrest can disrupt supply chains — as seen in the Russia-Ukraine conflict’s impact on wheat and oil markets.
Technological Advancements: Improved extraction and farming techniques can enhance supply efficiency.
In the short term, commodity prices are often volatile due to mismatches between supply and demand, but over the long term, they tend to align with production costs and global consumption trends.
3. The Role of Speculation and Financialization
Commodity prices are not only determined by physical supply and demand but also by financial market participants. The rise of futures markets has enabled traders, investors, and producers to hedge risks or speculate on future price movements.
Hedgers (like farmers or oil producers) use commodity futures to lock in prices and protect against unfavorable price changes.
Speculators (like hedge funds and traders) aim to profit from price fluctuations without owning the physical commodity.
The increasing financialization of commodity markets — especially after the 2000s — has made prices more sensitive to investor sentiment, macroeconomic news, and monetary policies. When investors view commodities as a hedge against inflation or currency depreciation, inflows into commodity futures can drive prices higher, even if fundamentals remain unchanged.
For instance, during the 2008 financial crisis and the subsequent quantitative easing (QE) era, commodity prices surged due to massive liquidity inflows and the perception that commodities would protect against fiat currency debasement.
4. The Influence of Global Macroeconomic Factors
a. Inflation and Monetary Policy
Commodity prices and inflation are closely intertwined. Rising commodity prices can contribute to inflation, while inflationary environments often drive up commodity demand as investors seek real assets. Central banks’ interest rate policies also impact prices — lower interest rates tend to weaken currencies and boost commodity demand, as commodities are typically priced in U.S. dollars.
b. Exchange Rates
The U.S. dollar has a significant inverse relationship with commodity prices. A weaker dollar makes commodities cheaper for holders of other currencies, thereby increasing global demand. Conversely, a strong dollar tends to suppress commodity prices. This dynamic explains why global commodity cycles often coincide with U.S. dollar trends.
c. Economic Growth Cycles
During periods of global expansion, industries consume more energy, metals, and raw materials, leading to rising prices. Conversely, recessions dampen demand and push prices downward. For instance, the 2020 COVID-19 lockdowns led to a historic collapse in oil prices due to unprecedented demand destruction.
5. Geopolitical and Policy Influences
Geopolitics plays a critical role in shaping commodity markets. Conflicts, trade sanctions, and government interventions can create sudden disruptions in supply chains.
Oil and Energy: The Middle East remains a geopolitical hotspot. OPEC decisions, U.S. shale production policies, and conflicts in oil-producing regions significantly impact global oil prices.
Agriculture: Export restrictions, such as India’s bans on wheat or rice exports, can tighten global supplies and push prices up.
Metals and Minerals: Resource nationalism — when governments impose stricter control or taxes on mining — can influence global availability and pricing.
Government subsidies, import tariffs, and sustainability policies also play major roles. For instance, climate policies promoting renewable energy increase demand for rare earth metals used in batteries and turbines.
6. Technological and Structural Shifts
Technological evolution has always reshaped commodity markets. From mechanized agriculture to fracking and renewable energy, innovations alter both supply and demand patterns.
a. Energy Transition
The global shift toward clean energy has created new demand centers for lithium, cobalt, and nickel while threatening the long-term dominance of oil and coal. As renewable energy storage technologies mature, price dynamics will increasingly hinge on battery metals and hydrogen.
b. Agricultural Technology
Precision farming, genetically modified crops, and irrigation technologies improve crop yields and reduce volatility caused by weather. However, climate change continues to pose challenges, potentially offsetting technological gains.
c. Automation and AI in Mining
Modern mining operations use AI and automation to improve efficiency, lower costs, and predict supply bottlenecks, influencing commodity production levels and price stability.
7. Cyclical Nature of Commodity Prices
Commodity prices often move in cycles driven by investment patterns, production responses, and economic demand. These are typically referred to as commodity supercycles — extended periods of high or low prices lasting several years or decades.
During boom phases, high prices encourage producers to expand capacity. However, this expansion eventually leads to oversupply, causing prices to fall and triggering a bust. The mining and oil industries are especially prone to such cycles because of their long investment timelines and capital intensity.
Historically, commodity supercycles have coincided with major industrialization phases:
Early 1900s: U.S. and European industrial expansion.
1970s: Oil shocks and rapid inflation.
2000–2010s: Chinese industrial boom.
Currently, the world may be entering a green transition supercycle, driven by demand for renewable energy materials.
8. The Impact of Climate Change and Sustainability
Climate change has become a defining factor in commodity markets. Extreme weather events — droughts, floods, hurricanes — directly disrupt agricultural and energy production. Additionally, global efforts to reduce carbon emissions are reshaping investment flows and consumption patterns.
a. Carbon Pricing and Regulations
Carbon taxes and emission caps influence fossil fuel demand and promote renewable energy investments, altering long-term price structures.
b. ESG Investing
Environmental, Social, and Governance (ESG) considerations are pushing investors to favor sustainable commodities, leading to increased capital flow into green metals and ethically sourced materials.
c. Agricultural Vulnerability
Global warming threatens crop yields and water availability, making food prices more volatile and raising concerns about food security.
9. Role of Emerging Markets
Emerging markets play a dual role as both producers and consumers in global commodity markets. Nations like Brazil, Russia, India, China, and South Africa (BRICS) collectively dominate global production of energy and raw materials while driving consumption through industrialization and population growth.
For example:
China is the world’s largest consumer of metals.
India is one of the biggest importers of oil and gold.
Brazil and Russia are major exporters of agricultural and energy commodities.
Economic growth in these countries exerts a significant influence on global commodity demand and prices.
10. Understanding Price Volatility
Commodity prices are notoriously volatile because they are sensitive to short-term disruptions. Factors such as weather anomalies, policy announcements, or currency fluctuations can cause sharp price swings. Volatility is further amplified by speculative trading, algorithmic strategies, and investor sentiment.
To manage volatility, producers and consumers rely on hedging instruments — futures, options, and swaps — while policymakers use strategic reserves to stabilize domestic markets. Despite these tools, unforeseen events like the COVID-19 pandemic or Russia-Ukraine conflict demonstrate that commodity markets remain inherently unpredictable.
11. Future Outlook: The Evolving Commodity Landscape
The future of commodity pricing is being shaped by three powerful trends:
Energy Transition: The global shift toward clean and renewable energy will redefine demand for fossil fuels and boost prices for critical minerals.
Digitalization: Blockchain and data analytics are improving transparency, traceability, and efficiency in commodity trading.
Geopolitical Realignments: Emerging economic blocs and supply chain diversification are reshaping trade patterns, potentially reducing global dependency on a few key producers.
In the coming decade, commodity markets will likely see more structural shifts than cyclical ones, driven by sustainability imperatives and technological innovation.
Conclusion
Understanding the dynamics of commodity prices requires a holistic view that integrates economics, geopolitics, technology, and psychology. Commodity markets are not just about physical goods — they are a reflection of global growth, investor sentiment, and policy directions.
From oil shocks to green energy booms, the forces shaping commodity prices evolve continuously. As the world transitions to a more sustainable and digitally interconnected economy, commodities will remain both a foundation of global trade and a mirror of broader economic transformation.
In essence, mastering the dynamics of commodity prices means understanding the pulse of the world economy itself.
How to Stop Overcomplicating It ? Become Master of One KickHey whats up traders. Trading is not easy, but today I want to show you how it can be easier. First we need to ask questions. What is the goal of the trader ?
You probably answered - to make money. Yes I get it.
But money is the result of something which is much more important - Discipline , Following the system, Trading plan, Your routines , Risk management etc..
📌 I would lay it down this way:
The goal of the trader is to create a system with narrowed criteria for the each element of the trade and following it no matter what. Then money comes and trading is easier.
📌 Trading System
When you approach you chart differently every time, then you cant have consistent system but just overfitting what you see on chart to the patterns, that just fits in to it right now - Butterfly, Head&Shoulders, Crab, Triangle, Wedge, Channel, Cup&Handle.
Im not saying you cant make profits by trading these pattens. But how can traders who are has different pattern on each chart have consistent results and be consistently improving over time ?
Im also not saying that one of mentioned patterns is bad. None of the strategy is superior to other. Who makes it powerful is trader himself by mastering it.
📌 I would refer to the master Bruce Lee - 1 Kick - 10 000 times.
Whatever is your trading pattern stick to the one and become master. Know it upside down in every market conditions and learn market context and key levels. Know its weakness and when it is powerful. 👊One Kick 10 000 times will help you will make you confident master/b] 👇
- No more subjective decisions
- Not pattern guessing and fitting to price action
- Not overthinking - Still doing same setup, you ,know it works
- Fixed SL and TP, RR - No guesswork
- Can be practiced - Backtested
- Become Confident - Knowing your Win rate
- Eliminate - Fear, Greed, Over Trading
- Repetitiveness builds - Confidence and Clarity
- Confidence and Clarity leads to Improvements
- Improvements leads to the Mastery
🧠 I came to trading for the money. But it gave me presence, spirituality, discipline, resilience and peace in the chaos. Everything changed for me when I stopped looking for better strategy, but started to focus on my self and my daily routines and process to make everything more mechanical. And mainly journaled and described every process step by step. Strategy is 20% of success 80% is your mind.
🧪If you don't have you strategy or want inspiration here I described my mechanical Trading approach. 🔗 Click the picture below to learn more. 👇https://www.tradingview.com/chart/BTCUSDT.P/PkQJvVm4-Complete-system-for-Day-Swing-Traders/ Adapt what you find useful and reject useless what works for me is might not for you.
‼️ Pattern is trade setup. Not a strategy. You need to define the following.
- Market context - When and Where your pattern occurs
- Key Level - On what key levels you will be trying your pattern
- Trade Setup - Thats your pattern - H&S, Pinbar, Range, Butterfly ...
- Trade Plan - Describe the process, when and how
- Daily Routine - Describe how you will work day by day
- Risk Management Rules - What is your targets, Max loss
- Trading Journal - What data sets you will be collecting about trades
🧩 Market Context
you pattern can occur in a different market phases but only some will be profitable, you need to filter out the low probability conditions. So Im never looking for the setup if there is no pullback at least 50% from high of the swing. Because this can happen hence trade setup entry must always occur from a key level after the 50% pullback. How to do it I describde in the post previous trying view post. 🔗 Click the picture below to learn more. 👇 🧩 Key Level
as I described it higher , if not trading reversal. Im never buying without a 50% pullback hence Im looking for my key levels placed after a 50% pullbacksIm never buying in the premium prices. Always want a pullback to the discount. For me works best Order block. In other words SD zone. Strong areas of the institutional activity that created imbalances. Here are the key points for high probability order block key level as you see on the picture above order block must occur in the liquidity zone. I have described it in the this post. 🔗 Click the picture below to learn more. 👇https://www.tradingview.com/chart/GBPUSD/FyBT0H1q-Liquidity-in-Trading-The-Basics-
🧩Trade Setup
now this is the pattern. Whatever is your pattern it can be consistency working only if you have defined Market context and Key Levels. There you want have your pattern to occur, for me its range manipulation and then Im following these two entry methods.
📌 Bullish continuation setups
Model 1 - Entry after manipulation - 50% target
Model 2 - Entry on pullback on level between 61.8 - 80% pullback 📌 Bearish Continuation setups
Model 1 - Entry after manipulation - 50% target
Model 2 - Entry on pullback on level between 61.8 - 80% pullback 🧩 Trade Plan
in a trade plan you should describe your process how you gonna do step by step approach of the market context , key level trade setup and how you make it all working. Also knowing when not to trade is might most important. And column for your recent mistakes is vital, because by reminding your mistakes every day is a first step to eliminate them next time.
Im reading it every time before going to trade and constantly improve it.
🧩 Daily Routine
as a trader you want to trade systematically and you want to eliminate all possible distraction that comes from the online world and mainly you want to specify your times when you gonna trade and when you close charts and go back to the live. This is important otherwise trading obsession and sitting by charts 12 hours a day will destroy not only your account, but also your live. Here is my simple list:
- Don't open any social media, and turn off all notifications that could distract your focus,
- Check economic calendar for high-impact news
- Update charts, Levels, Ranges and market context as a first thing on Tradingview
- Go thru your pairs, identify HTF order flow and Liquidity and ranges
- Mark out valid higher time frame Order blocks
- Mark out valid ranges , Setup alarms
- Wait for the range manipulation and execute
- If Price action is not clear don't force a trade, skipping a trading session without hesitation is a level of maturity
As a day trader you should focus only to one trading session. London or New York. Here I described how to approach London session Click the picture below to learn more. 👇https://www.tradingview.com/chart/BTCUSDT.P/XxzXz7Ll-High-probability-strategies-for-the-London-Session/ 🧩 Risk Management Rules
now Im not talking about a risk per trade, but knowing your targets. And not having that you must reach them every month. But having them as your stop and prevention from overtrading. There is nothing more frustrating than having a great week and destroy all work at Friday. Hence:
- Daily Target - 3R - 0.5% risk = 1% // 1% = 2%
- Weekly Target - 6R - 0.5% risk = 2% // 1% = 4%
- Monthly Target - 20R - 0.5% risk = 8% // 1% = 16%
- Stop trading for the day when >3R is locked,
Stop trading for the week when >6R is locked don't stop analyzing, but take only A+ setup, backtest, and journal... 6R is amazing profit in a week you dont need more, if you not making the living with 6R weekly gain, you need more capital - use prop firms.
🧩 Journal is key to the consistent grown as a trader
decide what data sets about your strategy you will be collecting in order to improve it.
Always do screenshot when entering and add all information it will also keep you from overtrading and clicking to often. Make sure you have in your journal formula to measure your average win rate, profitability for days of the week. Also monitor your emotions and try to describe them so you know where you are whats need to be eliminated.
So to summarize trading is not easy and if thumbnail with easy way to trade catches your attention I hope you are not disappointed, because it's not about a strategy but about you. How organized and prepared you are then you can be disciplined and successful.
Hope you get some inspiration - Adapt useful , Reject useless, become master of 1 kick.
David Perk aka Dave Fx Hunter
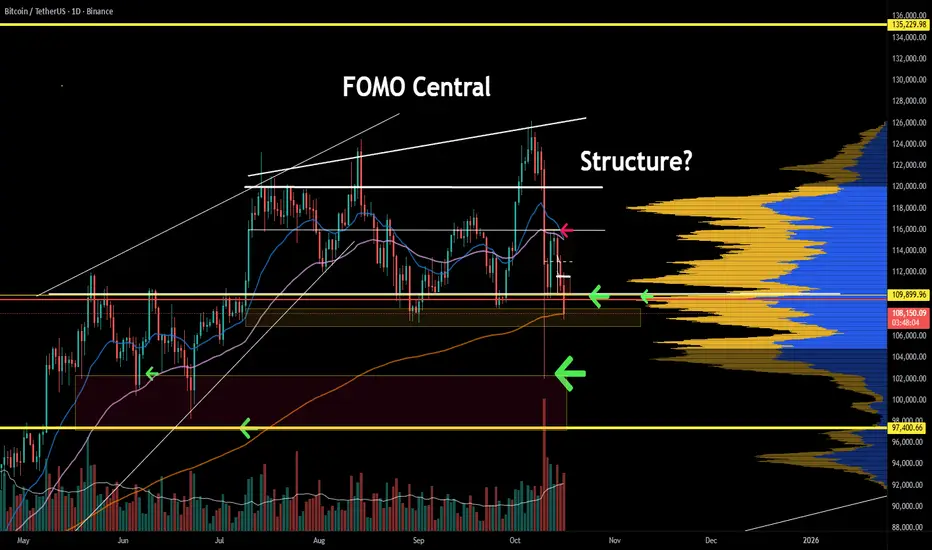
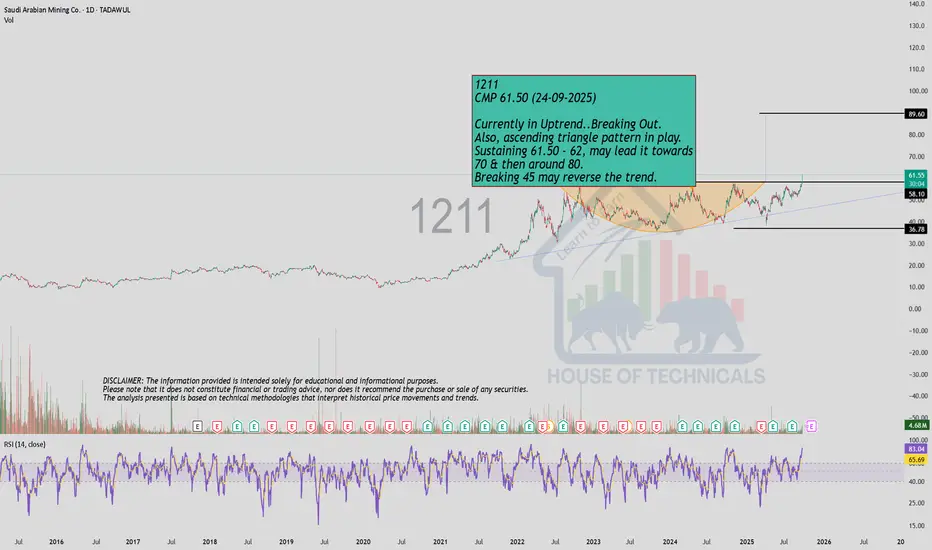
Currently in Uptrend..Breaking Out.1211
CMP 61.50 (24-09-2025)
Currently in Uptrend..Breaking Out.
Also, ascending triangle pattern in play.
Sustaining 61.50 - 62, may lead it towards
70 & then around 80.
Breaking 45 may reverse the trend.
Double Bottom with Strong Bullish Divergence.2270
CMP 269 (24-09-2025)
Double Bottom with Strong Bullish Divergence.
It has the potential to move upside towards 275 then 280
at least.
Once 289 is Crossed & Sustained, we may witness a Trend Reversal.
However, it should not break 253 now.

9 Reasons to Gradually Return to BondsAfter several years marked by the dominance of equity markets and interest rate volatility, 2026 could turn out to be more favorable for bonds. Without expecting a spectacular reversal, several economic and structural factors suggest that a relative catch-up of the bond market cannot be ruled out.
First, the high valuation of U.S. equities calls for caution. Indices such as the S&P 500 are at historically stretched technical levels after a long period of growth supported by liquidity and corporate earnings. In this context, a consolidation or profit-taking phase is not unlikely, and such an environment often leads investors to rebalance their exposure toward less risky assets, including bonds.
The U.S. presidential cycle could also play a role. 2026 is the second year of the presidential cycle, which historically tends to be the weakest for the S&P 500, possibly triggering a partial rotation of capital toward bonds, perceived as more stable.
On the macroeconomic front, the prospect of lower interest rates by central banks is another factor to watch. Given high debt levels and a potential weakening of the labor market, the Federal Reserve and the European Central Bank could adopt a looser monetary policy. A decline in rates would mechanically support the value of already issued bonds.
At the same time, the gradual normalization of inflation favors a more predictable environment for bond investors. In the coming months, the impact of tariffs will fade, and more moderate inflation would stabilize real yields and strengthen the appeal of fixed income.
Relative bond yields have also become competitive again compared to equities, as the S&P 500 earnings yield now stands below the 10-year U.S. Treasury yield. For institutional investors, especially pension funds and insurance companies, these levels offer an opportunity for prudent diversification—particularly if equity markets stabilize or correct.
Added to this are fiscal constraints in several developed economies, which could limit stimulus policies and encourage greater market prudence.
In short, without predicting a bond market rally, several factors—relative valuations, monetary policy, inflation, and the economic cycle—suggest that 2026 could mark a period of stronger relative performance for bonds.
Chart showing the monthly candlesticks of the 20-year U.S. bond contract:
DISCLAIMER:
This content is intended for individuals who are familiar with financial markets and instruments and is for information purposes only. The presented idea (including market commentary, market data and observations) is not a work product of any research department of Swissquote or its affiliates. This material is intended to highlight market action and does not constitute investment, legal or tax advice. If you are a retail investor or lack experience in trading complex financial products, it is advisable to seek professional advice from licensed advisor before making any financial decisions.
This content is not intended to manipulate the market or encourage any specific financial behavior.
Swissquote makes no representation or warranty as to the quality, completeness, accuracy, comprehensiveness or non-infringement of such content. The views expressed are those of the consultant and are provided for educational purposes only. Any information provided relating to a product or market should not be construed as recommending an investment strategy or transaction. Past performance is not a guarantee of future results.
Swissquote and its employees and representatives shall in no event be held liable for any damages or losses arising directly or indirectly from decisions made on the basis of this content.
The use of any third-party brands or trademarks is for information only and does not imply endorsement by Swissquote, or that the trademark owner has authorised Swissquote to promote its products or services.
Swissquote is the marketing brand for the activities of Swissquote Bank Ltd (Switzerland) regulated by FINMA, Swissquote Capital Markets Limited regulated by CySEC (Cyprus), Swissquote Bank Europe SA (Luxembourg) regulated by the CSSF, Swissquote Ltd (UK) regulated by the FCA, Swissquote Financial Services (Malta) Ltd regulated by the Malta Financial Services Authority, Swissquote MEA Ltd. (UAE) regulated by the Dubai Financial Services Authority, Swissquote Pte Ltd (Singapore) regulated by the Monetary Authority of Singapore, Swissquote Asia Limited (Hong Kong) licensed by the Hong Kong Securities and Futures Commission (SFC) and Swissquote South Africa (Pty) Ltd supervised by the FSCA.
Products and services of Swissquote are only intended for those permitted to receive them under local law.
All investments carry a degree of risk. The risk of loss in trading or holding financial instruments can be substantial. The value of financial instruments, including but not limited to stocks, bonds, cryptocurrencies, and other assets, can fluctuate both upwards and downwards. There is a significant risk of financial loss when buying, selling, holding, staking, or investing in these instruments. SQBE makes no recommendations regarding any specific investment, transaction, or the use of any particular investment strategy.
CFDs are complex instruments and come with a high risk of losing money rapidly due to leverage. The vast majority of retail client accounts suffer capital losses when trading in CFDs. You should consider whether you understand how CFDs work and whether you can afford to take the high risk of losing your money.
Digital Assets are unregulated in most countries and consumer protection rules may not apply. As highly volatile speculative investments, Digital Assets are not suitable for investors without a high-risk tolerance. Make sure you understand each Digital Asset before you trade.
Cryptocurrencies are not considered legal tender in some jurisdictions and are subject to regulatory uncertainties.
The use of Internet-based systems can involve high risks, including, but not limited to, fraud, cyber-attacks, network and communication failures, as well as identity theft and phishing attacks related to crypto-assets.
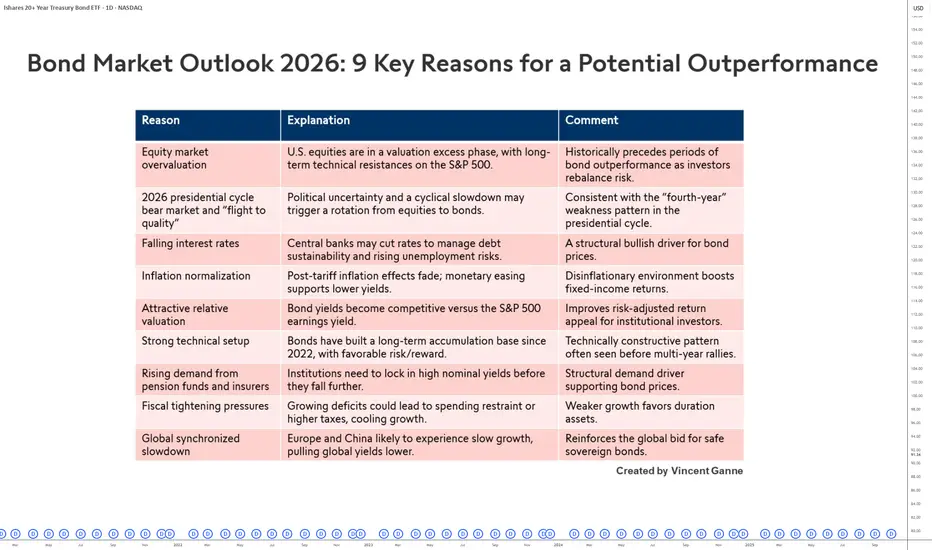
Gold market correctional moveGold market rallies to 4404, extending its bullish momentum since the recent correctional mitigation at 4277. The daily candle formation continues to reflect strong buyer sentiment, reinforcing the bullish structure. follow for more insights , comment and boost idea

CRYPTO MARKET STATUS — THE SOLDIERS ARE TIRED, THE PEAK IS NEAR⚠️ CRYPTO MARKET STATUS — THE SOLDIERS ARE TIRED, THE PEAK IS NEAR
📈 Macro | 🧭 Cycle | 💰 Money Flow | 🔍 Market Structure
🧠 Overview
Think of the crypto market as a giant company with hundreds of “employees” — each token doing its job in a different department (Daily, Weekly, Monthly).
Some are still performing, some are peaking, and a few are already on their way out.
Let’s audit the whole army.
📊 1. Peak & Bottom Data
Dataset: 401 tokens from the most liquid centralized exchange.
Daily (D1)
99.2% (≈365 tokens) are forming bottoms — D1 still completing its downward leg.
→ The daily correction is still in progress.
Weekly (W)
45.9% (146 tokens) forming bottoms
35.1% (126 tokens) confirmed peaks
9.2% (65 tokens) forming peaks
→ Roughly 191 tokens still maintain Weekly uptrend momentum.
Monthly (M)
14% (81 tokens) probing for tops
51 tokens confirmed peaks
→ About 132 tokens still have upward Monthly momentum.
💧 2. Money Flow Insight
Weekly: 191 tokens still carry inflow — current drop = a correction phase letting D1/H4 finish their bottoms.
Monthly: 136 tokens still hold positive flow.
Together:
Most tokens are topping out, not collapsing. The short-term drops are mechanical — a system correction before W & M align into full distribution.
🧭 3. Market Position
W & M: Still sitting near ATH zones.
D1: Rotating in small cycles — up and down — within the plateau.
Translation: we are walking the ridge, not climbing anymore.
When W & M confirm synchronized peaks, expect a macro descent lasting months and cutting deep.
🧩 4. Strategy Notes
Identify the wave bases of W and M — know where each trend started.
Manage exposure: partial cashout during D1 rallies.
Watch for W/M peak confirmations — that’s the real warning light.
🧘 Summary
The army is still strong, but the mountain is steep.
Daily waves dance to keep Weekly and Monthly peaks alive — but the cycle is aging.
Expect 1–2 months more of high-altitude trading, then a gradual downhill march.
Stay disciplined. No one lives at the top of the mountain.
💬 Like this analysis? Follow for macro-cycle breakdowns and real-time money-flow readings across TOTAL, BTC, and alt structures.

ANSM – BUY TRADE | 3H | 17 OCT 2025 | TCA
ANSM – TECH BUY CALL | 3H | 17 OCT 2025 | By The Chart Alchemist
After a sharp upturn, ANSM pulled back but appears to have found support at a strong bullish IFDZ. Signs of upper reversal are evident, suggesting renewed momentum for the next upward leg.
📢 Technical Analysis by Mushtaque Muhammad (The Chart Alchemist).

XAUUSD: Detecting the Rising Wedge PatternOANDA:XAUUSD has experienced a significant rise recently, but we are currently seeing the formation of a Rising Wedge pattern, which often signals buyer exhaustion and a potential reversal toward a bearish trend. As the structure tightens near the top, the upward momentum starts to weaken, indicating that the buying pressure is fading.
A strong breakout below the trendline would confirm selling pressure and could signal a move toward the 4,130 level. However, until that happens, patience is key. It’s important to wait for a clear breakout with high volume to avoid false signals.
In summary, don’t rush into the market too early. Caution and waiting for a clear signal are essential to maximize your chances of success. Best of luck and happy trading!

XAUUSD - Surging Hour by Hour👋Hello everyone, great to see you again in today’s OANDA:XAUUSD session.
As forecast, XAUUSD has continued its strong uptrend, hitting the 4,100 target and then 4,200 USD. The quick move through these two psychological levels in a short time underscores the bulls’ strong momentum.
Ongoing economic risk concerns—from a prolonged U.S. government shutdown, renewed U.S.–China trade tensions, and rising geopolitical stress—continue to fuel demand for gold as a safe-haven asset.
From an analytical standpoint, the path of least resistance remains to the upside, with no immediate signs that this trend is being challenged. At the time of writing, price is trading around 4,230 USD, up more than 250 pips since the session began. Bullish structures and orderly pullbacks keep repeating; as long as the marked supports on the chart hold, I believe the next move still offers solid opportunities for buyers.
What about you—how do you see XAUUSD? 💬Share your thoughts in the comments.
Good luck!

BTCUSDT - Testing Support for a Potential Rebound👋Hello everyone, do you think BINANCE:BTCUSDT will go up or down in price?
Bitcoin is currently trading at a crucial support zone around the 109,000 - 110,000 level. This has been a strong price area, where we have seen several price rebounds in the past. If Bitcoin can maintain this support, the next target could be the 124,500 level, a significant resistance that was previously reached in the past few weeks.
Moreover, the potential for the U.S. Federal Reserve to lower interest rates is making assets like Bitcoin more attractive. With low interest rates and a weakening USD, many investors are turning to Bitcoin as a reliable alternative asset.
From my perspective, I remain optimistic about BTCUSDT. 💬What about you? Feel free to share your thoughts in the comments!
Good luck!

$BNB (daily): WAVE 5 done, WAVE A nearly in? GOLDEN POCKET next?You know something is wrong with the alleged altseason when its top large cap performer, CRYPTOCAP:BNB (which more than doubled in price since late JUNE) has been doing a text-book WAVE A corrective move to the downside.
15% down from the ATH ($1375), and it even nearly perfectly touched the projected WAVE A (fib 0.5) target of $1118 on THURSDAY.
Another potential target, a level lower, would be the GOLDEN POCKET ($1058 - $1041). Losing this mid $1000s support zone will be completely bearish, but I will try and utilize a potential WAVE B bounce quite possibly.
So, the GOLDEN POCKET limit orders placed, this could be a wick. Lots of sellers around these days and lots of panic across markets. A recent BULL OBV divergence proves to me, that this asset should still outperform others.
WAVE B could easily be the play I'm looking for amidst the chaos. It could even be inderway right now after bouncing off the fib 0.5, but it costs me nothing to keep the buy limits (spot only) a little lower between 0.618 and 0.65 fibs for a much more secure entry.
STOP LOSS: daily close below the GOLDEN POCKET.
👽💙

$ASTER wait for 4H close above and Diddy will hang out with CZSEED_WANDERIN_JIMZIP900:ASTER wait for 4H close above and Diddy will hang out with CZ #four4444 #ASTER #EpsteinFiles #diddyparty #DEX
GBPUSD: Drifting Lower! Sells Are Valid!Welcome back to the Weekly Forex Forecast for the week of Oct. 13 - 17th.
The GBPUSD drifted lower last week, and formed a potential bearish market structure shift.
Not the strongest MSS ever, but it is valid. The indication is another bearish week ahead, potentially.
Enjoy!
May profits be upon you.
Leave any questions or comments in the comment section.
I appreciate any feedback from my viewers!
Like and/or subscribe if you want more accurate analysis.
Thank you so much!
Disclaimer:
I do not provide personal investment advice and I am not a qualified licensed investment advisor.
All information found here, including any ideas, opinions, views, predictions, forecasts, commentaries, suggestions, expressed or implied herein, are for informational, entertainment or educational purposes only and should not be construed as personal investment advice. While the information provided is believed to be accurate, it may include errors or inaccuracies.
I will not and cannot be held liable for any actions you take as a result of anything you read here.
Conduct your own due diligence, or consult a licensed financial advisor or broker before making any and all investment decisions. Any investments, trades, speculations, or decisions made on the basis of any information found on this channel, expressed or implied herein, are committed at your own risk, financial or otherwise.

Gold market maintains its bullish trajectoryGold market maintains its bullish trajectory as a new hedge forms, targeting mitigation around the 4270 zone. An imbalance sweep is anticipated near 4225, signaling potential liquidity grabs before further continuation.


Bitcoin at critical levels !!!!BTC needs to show some strength here, as if it breaks down below the horizontal support defined by the current lows, a LL will be printed. A LL will confirm bearish intent, particularly if it is backed by volume. The trend oscillator, although lagging, remains bearish, and Momentum oscillators are indicating potential volatility to the upside as the bulls attempt to respond.