popcat longavg entry .26, trying one more time. looks promising
it will pop hard target 1.2, moonbad $4
Contains IO script

What I'm currently watching... XRPWhat I'm currently watching... XRP
I'm in at $2,40
Out at $2.4828
The WizardOfRealms13

SOLUSDT (4H Chart) Technical AnalysisSOLUSDT (4H Chart) Technical Analysis
1. Market Trend & Structure
The overall trend is bearish, as price remains below EMA 50, 100, and 200.
A descending channel pattern is forming, with lower highs and lower lows.
The red cloud zone represents strong selling pressure.
Price has tested a key support zone (~175-183 USDT) and is showing signs of a potential reversal.
2. Key Support & Resistance Levels
Support Zones:
183.44 - 192.62 USDT (potential demand zone).
175.08 USDT (entry zone for long positions).
Resistance Zones:
218.48 USDT (short-term resistance, supply zone).
221.20 USDT (Fib 38.2% retracement).
235.45 USDT (Fib 50%, mid-term resistance).
243.77 USDT (major resistance, supply zone).
269.98 - 295.82 USDT (long-term upside targets if a bullish breakout occurs).
3. Indicators & Market Sentiment
✅ Stochastic RSI: Oversold, indicating a possible bounce.
✅ MACD Histogram: Negative but reducing, suggesting weakening bearish momentum.
✅ EMA Structure: EMA 50 acting as resistance; a break above it could lead to further upside.
4. Trading Plan
Bullish Scenario (Long Position Plan)
✅ Entry: 183 - 192 USDT (demand zone).
✅ Targets:
218.48 USDT (first TP).
221.20 - 235.45 USDT (key levels).
243.77 USDT (supply zone).
✅ Stop Loss: Below 175 USDT (to avoid further downside risk).
Bearish Scenario (Short Position Plan)
✅ Entry: If price reaches 218 - 221 USDT and gets rejected.
✅ Targets: 200 - 192 USDT (support zone).
✅ Stop Loss: Above 225 USDT to prevent getting stopped by a breakout.
5. Risk Management & Considerations
Win rate: 73%, with a WL ratio of 2.72, indicating good trade probability.
If price fails to hold 183 USDT, further downside to 175 USDT is likely.
A break above 221 USDT could indicate trend reversal toward bullish.
Conclusion
SOLUSDT is testing a key support zone (183-192 USDT), with a possible reversal setup.
If price breaks above 218-221 USDT, a bullish rally to 243-269 USDT is possible.
If rejected at resistance, another drop to 183-175 USDT could occur.
📌 Trading Tip: Wait for confirmation signals before entering trades and use strict stop-loss strategies. 🚀

SOL 4 hr breakout coming 2 Patterns ConvergeLook at my busy chart, been keeping it all for the run...
But SOL on 4hr is ready to breakout. may be a retest to 198.5 but both a falling wedge pattern with the red arrow and the measured move from the W pattern both break north somewhat like the Lark lines in yellow, to 216 not much in the way to 230, may snap north
Stop loss below the base of the W
Download the chart if you want and look at the greater trend lines on the 3-5 day time frames

NEW WEEK NEW TRADES! MY NEXT PLAYS📊 Today's Lesson: Bitcoin Top-Down Analysis 🔍
In today's session, we’ll analyze Bitcoin from a top-down perspective and assess the data to identify potential trade opportunities. 📉📈
📌 Key Approach:
Until Bitcoin breaks out of its current range, we will:
✅ Focus on long trades from discounted (lower) prices.
✅ Look for short trades from premium (higher) prices.
✅ Monitor internal structure for trade confirmations.
🔄 Trade Confirmations:
🔹 Bullish Setup: We want to see a shift from lower highs and lower lows to higher highs and higher lows before entering a long position.
🔹 Bearish Setup: We look for the opposite— a transition from higher highs and higher lows to lower highs and lower lows before shorting.
🛑 Beginner Tip: If you're new to trading, wait for a clear 10-minute or higher structure shift before considering a trade. This helps reduce false signals and improves entry accuracy. ⏳✅

BTC/USD M15 CHARTBTC/USD M15 CHART
Why i will take a trade:
OTE - Optimal Trade Entry Zone
FVG - Fair Value GAP
OB - Order Block
Demand Zone
ChoCH - Change of Character

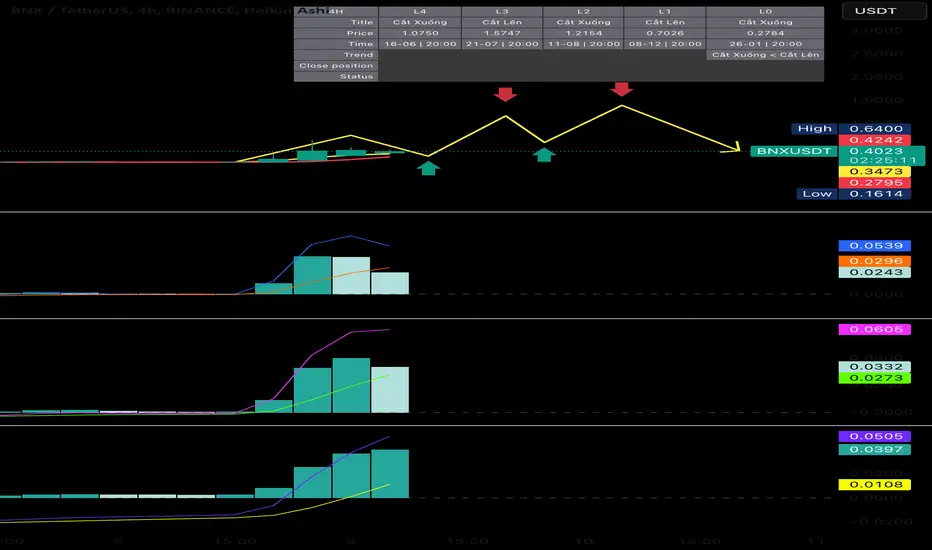
BUY SPOT BNXUSDT (H4-D1 Trade Setup)🚀 BUY SPOT BNXUSDT (H4-D1 Trade Setup)
📢 BNXUSDT surged 190% last night – Now setting up for another opportunity!
📌 Market Outlook & Trade Plan
✔ Yesterday, BNX was called in the group after M15 & H1 corrections, leading to a massive 190% overnight surge.
✔ Now, with the D1 and H4 structure aligned, BNX is expected to correct on H4 before continuing its upward momentum.
✔ This is an entry opportunity for those who missed yesterday’s breakout.
📌 Trade Setup:
Entry Point: Wait for H4 correction and use indicators for confirmation, or buy between $0.29 - $0.35.
Target: 50-80% upside from the correction low (or based on the attached chart).
Hold Time: Short-term trade, following H4 & D1 cycles.
💡 Key Considerations:
✔ Monitor H4 correction levels for the best entry.
✔ Set up indicator alerts to confirm buy signals.
✔ Manage risk & take profit accordingly based on the upcoming waves.
🔥 BNXUSDT is setting up for another strong move – Stay sharp for the next opportunity! 🚀
BTC - The DreamBINANCE:BTCUSDH2025
We are holding strong at these levels.
It's ok to dream, dream big.
We came through some rough years, so no giving up now!
Let see these continuous bullish measured moves.
Break above 110k and hold steady from there.
Trade smart, trade safe...
HODL ON!

MAJOR SWING LIKE PLAYS!In today's session, we’ll analyze Bitcoin from a top-down perspective and assess the data to identify potential trade opportunities. 📉📈
📌 Key Approach:
Until Bitcoin breaks out of its current range, we will:
✅ Focus on long trades from discounted (lower) prices.
✅ Look for short trades from premium (higher) prices.
✅ Monitor internal structure for trade confirmations.
🔄 Trade Confirmations:
🔹 Bullish Setup: We want to see a shift from lower highs and lower lows to higher highs and higher lows before entering a long position.
🔹 Bearish Setup: We look for the opposite— a transition from higher highs and higher lows to lower highs and lower lows before shorting.
🛑 Beginner Tip: If you're new to trading, wait for a clear 10-minute or higher structure shift before considering a trade. This helps reduce false signals and improves entry accuracy. ⏳✅

TESLA STOCK FEBTesla should have a floor between 350 and 330, to rise and sell between the targets of 450 and 540 to resolve the gamma exposure that was opened in December and January.

Redistribution Phase DXYFollowing what I believe is going to be the Great Melt Up/Inflation during the Presidency of Trump, The value of the DXY and the 10 year yield will come down while assets, inflation, commodities, metals will rise. Good luck to y'all traders. Everyone seems to be running from bonds too. All in due time. DXY has one more pump inside it, which in correlation should dump BTC to the 89-91k during it's Reaccumulating Phase

CHF/JPY - Bullish Reversal SetupCHF/JPY - Bullish Reversal Setup 📈
1D Chart | Smart Money Concept (SMC) | Supply & Demand Strategy
📊 Market Analysis:
Change of Character (CHoCH): A structural shift indicates a potential reversal from bearish to bullish.
Order Block (OB) & Demand Zone: Price has tapped into a strong demand zone, suggesting institutional buying.
Sell-Side Liquidity (SSL) Taken: Liquidity below previous lows has been grabbed, clearing stop-loss orders and fueling a bullish move.
Buy-Side Liquidity (BSL) & Equal Highs (EQH) Target: Price is expected to push up towards the buy-side liquidity resting at equal highs.
📌 Trade Plan:
✅ Entry: After liquidity sweep at SSL & OB reaction
🎯 Target: BSL at 175.826 (Equal Highs)
📉 Invalidation: Below demand zone if structure shifts bearish
📢 Conclusion:
This setup follows the Smart Money Concept (SMC) with a focus on liquidity grabs and supply & demand dynamics. If the demand zone holds, we expect a bullish move towards liquidity at the highs.
📍 What do you think about this setup? Let me know in the comments! 🚀

ETHUSDT (4H Chart) Technical AnalysisETHUSDT (4H Chart) Technical Analysis
1. Market Trend & Structure
Bearish trend: ETHUSDT is trading below EMA 50, EMA 100, and EMA 200, confirming a downtrend.
Resistance at 2,847 USDT: Price has rejected from this level multiple times.
Support at 2,657 USDT: Currently testing a key support zone with potential for a bounce.
2. Key Support & Resistance Levels
Support Zones:
2,657 - 2,636 USDT (Potential demand zone).
2,559 - 2,394 USDT (Major support if breakdown occurs).
Resistance Zones:
2,735 USDT (minor resistance).
2,847 USDT (EMA 50 resistance, key breakout level).
3,057 - 3,097 USDT (Mid-term resistance).
3,222 - 3,372 USDT (Strong supply zone).
3. Indicators & Market Sentiment
✅ Stochastic RSI: Near oversold, indicating possible bullish momentum.
✅ EMA 50 Resistance: Price is struggling to break above, confirming bearish control.
✅ Volume: Moderate, indicating a potential consolidation phase before a breakout.
4. Trading Plan
Bullish Scenario (Long Position Plan)
✅ Entry: 2,636 - 2,657 USDT (support zone).
✅ Targets:
2,735 USDT (short-term resistance).
2,847 USDT (major breakout level).
3,057 - 3,097 USDT (mid-term resistance).
✅ Stop Loss: Below 2,559 USDT to manage downside risk.
Bearish Scenario (Short Position Plan)
✅ Entry: If price fails to break 2,847 USDT.
✅ Targets:
2,657 USDT (support zone).
2,559 - 2,394 USDT (next support level).
✅ Stop Loss: Above 2,900 USDT to avoid fakeouts.
5. Risk Management & Considerations
Win rate: 80%, with a 4.0 WL ratio, indicating high accuracy trades.
If ETH loses the 2,657 USDT support, further downside to 2,559 - 2,394 USDT is likely.
A break above 2,847 USDT would indicate bullish momentum toward 3,057 USDT+.
Conclusion
ETH is at a critical support zone (2,657 USDT), with potential for reversal.
A break above 2,847 USDT confirms bullish continuation, targeting 3,057 - 3,372 USDT.
If support fails, ETH could dip toward 2,559 - 2,394 USDT.
📌 Trading Tip: Wait for confirmation before entering trades & use tight stop-loss strategies. 🚀

Analysis of MYRO/USDT (4H Chart)Professional Analysis of MYRO/USDT (4H Chart)
1. Trend Analysis
The chart indicates a strong downtrend, with price consistently making lower lows and lower highs.
EMA 50, 100, and 200 are aligned in a bearish formation (EMA 50 < EMA 100 < EMA 200), confirming the downtrend.
The red cloud zone suggests strong selling pressure, pushing prices lower.
Recently, price is consolidating near a demand zone, potentially signaling a temporary reversal or relief rally.
2. Key Support and Resistance Levels
Key Support (Demand Zone): 0.01619 USDT, where price is currently testing and could bounce.
Key Resistance Levels:
0.02052 USDT (Immediate resistance)
0.02968 - 0.03364 USDT (Major supply zone)
0.03924 USDT (Fib 38.2%)
0.04636 USDT (Fib 50%, a key resistance if price recovers)
3. Trading Plan
For Long Positions (Buying for a Rebound)
✅ Entry: Look for confirmations at 0.01619 USDT (demand zone).
✅ Target:
0.02052 USDT (first resistance)
0.02968 - 0.03364 USDT (supply zone)
0.03924 USDT (Fib 38.2%)
✅ Stop Loss: Below 0.01550 USDT (to minimize downside risk).
For Short Positions (Selling Continuation)
✅ Entry: If price bounces towards 0.02968 - 0.03364 USDT, look for rejection signs to enter short.
✅ Target: 0.01619 USDT (current demand zone).
✅ Stop Loss: Above 0.03500 USDT (to avoid getting stopped out by fake breakouts).
4. Risk Management & Considerations
Win rate is 76%, which is high, but Risk-to-Reward Ratio (3.27) must be maintained for better trade efficiency.
If price fails to hold the 0.01619 USDT demand zone, further downside is possible.
If volume increases near demand, a short-term rebound may occur.
Conclusion
The overall trend remains bearish, but a short-term bounce is possible from the 0.01619 USDT demand zone.
A breakout above 0.02052 USDT could indicate the start of a stronger recovery.
A rejection near 0.02968 - 0.03364 USDT would be a good opportunity for shorting.
📌 Note: Always use proper risk management and wait for price action confirmation before entering a trade.

$SOL back to $79 to $111If you look at the chart, you can see that every time we've touched the blue trend line, price has bounced off of it and gone higher.
If price bounces here and forms a lower low, then I think the setup is there to finally break the trend line to the downside and head lower.
If price breaks below that trend line , then I think the structure of the chart turns bearish and that price falls into the box on the chart between $79-111.
Let's see how it plays out over the coming weeks.

Google trading planHi traders what is your opinion on Google?as you can see it creates bearish flag for the second time the first one fails,are you expecting the second one to fails too or breakdown or continuation of the trend,this is very tricky ok, but simple to follow,weekly candlestick close lower as you can see let's findout whats next,I won't mind talking some buys from this trendline support followed by tight stop looses,yes it can breakdown and that will give alot of people's chances to take a long buy,however it's not going to easy one,as we have to make tough decisions from the current zones meaning it can bounce bek from current price or fall,that will be more than 10% if it continues to fall soo you can also expect some pull back after this drop for earning report,soo its up to you this is my trading plan.

Play on the Brain, Inverted ai16z, now ElizaOSHere is a play on the brain, the ai16z chart, now ElizaOS operating system, claiming to be able to grow to 100 Bil M/Cap
now this chart is almost a textbook rising wedge that is bearish, it usually breaks down earlier, but retraces to the base of the wedge. Then the Fib retraces to the previous spike high before the base measuring point, usually between the .618 and the .786... I will credit Sheldon the Sniper for that simple but powerful tool. Check your own charts for the retracements to that previous high, falling between the .618 & the .786 and most of th etime it will eventually retrace to that mark, even some of these most recent drops fell to that level in ,any tokens and just now turning around.
so, if ai16z ElizaOS does follow the text books or algorithmic bot traders, it should at least fall to the yellow dashed line at 1.80, at least the .618 or then a bounce, then fall to the bottom of the wedge.
Now save the chart and go to settings and INVERT SCALE and see how this is actually bullish
IF, ONLY IF, IT CAN BREAK OUT PAST THE OTHER FIBS BUT SHOULD HAPPEN IF ELIZAOS DELIVERS
IF is the biggest little wEnglish Dictionary.
Just wanted to show a different perspective on an inverted chart

SuperBowl Sunday Viper Weekly BreakdownSunday's we give a wide market breakdown of what we are looking at as possible outcomes for the upcoming week.
We cover DXY, US30, Forex, Gold, Oil and Crypto
Big CPI news week ahead that can really give these markets some volatility.

PEPE/USD Bullish Breakout: Demand Zone Holds, Reversal in Sight?PEPE/USD has been gaining attention as it trades near a critical juncture. With the daily demand zone holding strong and signs of a downside channel reversal, the pair could be on the brink of a bullish breakout. In this analysis, we’ll break down the technical indicators and patterns that suggest PEPE/USD might be ready to reverse its downtrend.
Daily Demand Zone Holding Firm
One of the most significant factors supporting a potential bullish move is the respected daily demand zone. This area has provided strong support, acting as a floor for buyers to step in. A failure to break below this zone increases the probability of an upward momentum shift.
Key Support Levels: Highlight exact price levels in the demand zone.
Volume Analysis: Look for increased buying volume around these levels, which could signal accumulation by bullish traders.
What to Watch For Before Confirmation
While the technical signs are promising, traders should remain cautious. Key events to watch include:
Breakout Above Resistance: Identify the breakout level for confirmation
Retest of the Channel Top: Look for a retest and bounce as confirmation of strength.
Market Sentiment and Volume: Monitor trading volume and broader market sentiment.
Conclusion: A Bullish Opportunity?
The combination of a respected daily demand zone and a downside channel reversal pattern makes PEPE/USD a pair to watch. A confirmed breakout could set the stage for a bullish run, providing traders with an exciting opportunity. As always, use risk management and stay updated with the latest price action.

BTCAll you need to know about next #BTC huge moves.
We can see the next BULLRUN dates. The highest points of BITCOIN in this market 2024/2026 and 2028th years

Analysis of BIGTIME/USDT (4H Chart)Professional Analysis of BIGTIME/USDT (4H Chart)
1. Trend Analysis
The chart shows a strong downtrend, with multiple supply zones acting as resistance.
EMA 50, 100, and 200 are aligned in a bearish formation (EMA 50 < EMA 100 < EMA 200), confirming the downward trend.
Continuous selling pressure has led to the formation of lower lows.
Recently, there has been a slight recovery, but price is still facing resistance from EMAs and supply zones.
2. Key Support and Resistance Levels
Key Support: 0.04854 USDT, a potential reversal or accumulation zone (POI).
Key Resistance Levels:
0.06537 USDT (EMA 50)
0.08452 - 0.09205 USDT (Supply Zone)
0.10197 USDT (Fib 50% from the last drop)
0.11458 USDT (Fib 61.8%, a crucial reversal point)
3. Trading Plan
For Short Positions (Selling)
✅ Entry: Consider shorting when price hits a supply zone or EMA 50/100.
✅ Target: 0.04854 USDT (Key support level).
✅ Stop Loss: Above 0.07038 - 0.07308 USDT.
For Long Positions (Buying for Rebound)
✅ Entry: Wait for confirmation near 0.04854 USDT before entering long.
✅ Target: 0.06537 - 0.07038 USDT (EMA 50 and first resistance level).
✅ Stop Loss: Below 0.04750 USDT.
4. Risk Management & Considerations
Win rate of 67% is decent, but Risk-to-Reward Ratio (2.12) must be maintained.
If price fails to hold above EMA 50, further downside is likely.
If volume is insufficient, any rebound could be short-lived before further decline.
Conclusion
The overall trend remains bearish. Long positions should be considered only if price holds above EMA 50.
0.04854 USDT is a strong support zone for potential buying opportunities.
Shorting near supply zones remains a viable strategy.
📌 Note: Always implement proper risk management and confirm price action signals before making a trade.

Analysis of ARUSDT (4H Chart)Professional Analysis of ARUSDT (4H Chart)
1. Trend Analysis
The overall trend is bearish, with price consistently making lower highs and lower lows.
The EMA 50, 100, and 200 are positioned in a bearish alignment, reinforcing downside pressure.
The red cloud zone indicates strong selling momentum.
Price has reached a demand zone around 8.567 - 8.649 USDT, which could act as a short-term support.
2. Key Support and Resistance Levels
Support (Demand Zone): 8.567 - 8.649 USDT (potential rebound area).
Resistance Levels:
10.207 USDT (first resistance).
11.694 USDT (Fib 38.2%, key level for reversal confirmation).
12.150 USDT (Fib 50%, a significant resistance).
13.587 - 13.813 USDT (Fib 61.8%, strong supply zone).
15.000 - 15.819 USDT (major resistance and possible long-term target).
3. Trading Plan
For Long Positions (Buying for a Rebound)
✅ Entry: Around 8.567 - 8.649 USDT (demand zone).
✅ Targets:
10.207 USDT (short-term resistance).
11.694 - 12.150 USDT (Fib 38.2%-50%).
13.587 - 13.813 USDT (Fib 61.8%).
✅ Stop Loss: Below 8.300 USDT to limit downside risk.
For Short Positions (Trend Continuation)
✅ Entry: If price bounces to 11.694 - 12.150 USDT, look for rejection signals.
✅ Targets: 9.500 - 8.567 USDT (support zones).
✅ Stop Loss: Above 12.500 USDT to avoid fake breakouts.
4. Risk Management & Considerations
Win rate is 75%, with a WL ratio of 3.0, indicating good probability for profitable trades.
If price fails to hold 8.567 USDT, further downside could be expected.
A breakout above 12.150 USDT could shift the trend from bearish to bullish.
Conclusion
Bearish trend continues, but price is testing a strong demand zone near 8.567 USDT.
A rebound is possible, targeting 10.207 - 12.150 USDT.
If price gets rejected near resistance, shorting opportunities will emerge.
📌 Trading Tip: Always wait for confirmation before entering trades and follow risk management strategies. 🚀

Understanding Fibonacci In TradingUnlock the secrets of Fibonacci and its powerful applications in trading. Learn how to use Fibonacci tools to identify optimal entry and exit points, manage risk, and refine your trading strategies. While many traders are familiar with basic Fibonacci retracements, this guide will also explore advanced techniques and lesser-known concepts.
📚 The Foundation of Market Geometry
🔢 What is Fibonacci?
The Fibonacci sequence is a series where each number is the sum of the two preceding ones:
0, 1, 1, 2, 3, 5, 8, 13, 21, 34...
This mathematical principle, introduced by Leonardo Fibonacci in Liber Abaci (1202), is foundational to nature, architecture, and financial markets. The key ratio derived from this sequence is 1.618, known as the Golden Ratio.
✨ The Golden Ratio and Market Significance
The Golden Ratio (1.618) and its inverse (0.618) appear frequently in natural patterns and price movements. In trading, these ratios help determine potential support and resistance levels.
Other critical Fibonacci-derived levels include:
0.236 (23.6%)
0.382 (38.2%)
0.5 (50%) (not strictly Fibonacci but widely used)
0.618 (61.8%)
0.786 (78.6%)
📊 How Fibonacci Became a Trading Tool
Traders noticed that price movements often respect Fibonacci levels, leading to the creation of Fibonacci-based tools:
📉 Fibonacci Retracement: Identifies potential reversal zones during pullbacks.
📈 Fibonacci Extension: Forecasts potential profit-taking levels.
📐 Fibonacci Arcs, Fans, and Time Zones: Advanced tools for multidimensional analysis.
Circles
Fans
🛠 Applying Fibonacci in Trading
📍 Step 1: Identifying Swing Highs and Swing Lows
Choose a clear trend and mark:
Swing High (peak before price declines)
Swing Low (trough before price rises)
📏 Step 2: Using Fibonacci Retracement Levels
On platforms like TradingView, apply the Fibonacci tool:
Uptrend: Draw from Swing Low to Swing High.
Downtrend: Draw from Swing High to Swing Low.
Key retracement levels act as support or resistance zones.
🚀 Advanced Fibonacci Concepts
🎯 ICT Optimal Trade Entry (OTE) Zone
A modern adaptation of Fibonacci, OTE focuses on the 0.618 - 0.786 retracement zone.
📊 Bullish Setup: In an uptrend, the price pulling back into the OTE zone signals a high-probability long entry.
📉 Bearish Setup: In a downtrend, price retracing into the OTE zone suggests a shorting opportunity.
💎 The Golden Pocket
The zone between 0.618 - 0.650 is known as the "Golden Pocket." This is a prime area where the price often finds strong support or resistance before continuing its trend.
⏳ Fibonacci Time Zones
While most traders focus on price-based Fibonacci levels, Fibonacci Time Zones can predict when significant price movements may occur. These vertical lines are placed at Fibonacci intervals (1, 2, 3, 5, 8...) from a significant market event.
🔄 Fibonacci Confluence
When multiple Fibonacci levels align with other indicators (trendlines, moving averages, pivot points), it creates a Fibonacci Confluence Zone, strengthening the probability of a reversal or continuation.
📊 Fibonacci Clusters
Traders can plot multiple Fibonacci retracements/extensions on different timeframes. Overlapping levels suggest a high probability reaction zone.
📌 Combining Fibonacci with Other Tools
Fibonacci analysis is most effective when combined with:
📉 Candlestick Patterns: Confirmation for reversals or continuations.
📏 Trendlines & Moving Averages: Validate Fibonacci levels.
📊 Volume Analysis: Gauge strength of reactions at Fibonacci levels.
🧠 ICT Strategies: Incorporate Fair Value Gaps, Inversion Fair Value Gaps, Breaker Blocks, and Order Blocks for precision entries.
📍 Practical Applications of Fibonacci
⚡ Scalping: Use Fibonacci on lower timeframes (1m, 5m) to identify intraday opportunities.
📈 Swing Trading: Combine Fibonacci retracements with trend analysis for multi-day trades.
💰 Long-Term Investing: Apply Fibonacci tools on weekly/monthly charts to pinpoint major turning points in the market cycle.
🏆 Key Takeaways
Mastering Fibonacci enhances your ability to:
Identify optimal entry and exit points.
Manage risks with precision.
Gain deeper insights into price movements.
By integrating Fibonacci with other trading strategies, you can refine your approach and improve decision-making. Start experimenting with Fibonacci tools today on TradingView and elevate your trading strategy!
