99% of Traders FAIL Because of THIS... Don't Be the Monkey! Today, we’re talking about why most beginners fail—and it’s not because they don’t have the “right” strategy. It’s because they trade like a monkey, not a tortoise! 🐢
Most people jump from one strategy to another, chasing the latest hype, overcomplicating everything, and never sticking to a solid plan. That’s like being a hyperactive monkey swinging from tree to tree 🍌—or worse, a cat that randomly pounces on anything that moves! 🐈
The key? Slow down, stay consistent, and trust the process.
❌ DO NOT:
🚫 Change strategies every time you have a red day
🚫 Overload your charts with 500 indicators 🤯
🚫 Trade based on emotions instead of a structured plan
🚫 Think there’s a “holy grail” strategy that wins 100% of the time
🚫 Over-leverage and blow your account because you "felt good" about a trade
✅ DO THIS INSTEAD:
✔️ Pick a proven strategy and stick with it long enough to see real results
✔️ Focus on risk management—capital preservation is king! 👑
✔️ Keep your emotions in check and trade with a plan, not impulse
✔️ Think like a tortoise 🐢—slow, steady, and consistent wins the game
✔️ Track your trades, review them, and actually learn from your mistakes
Most people never make it in trading because they get distracted, impatient, and emotional. But if you trade like the tortoise—focused, disciplined, and consistent—you’ll outlast the monkeys, cats, and every other wild trader out there! 🏆
Let me know in the comments—are you trading like a monkey, a cat, or a tortoise? 👇
Contains IO script

EURUSD: TP1 Hit +30 Pips (AccuTrade System)The case well explains how to combine Technical Analysis and Fundamental Analysis, not only to avoid potential false signals but also to enter trades more confidently.

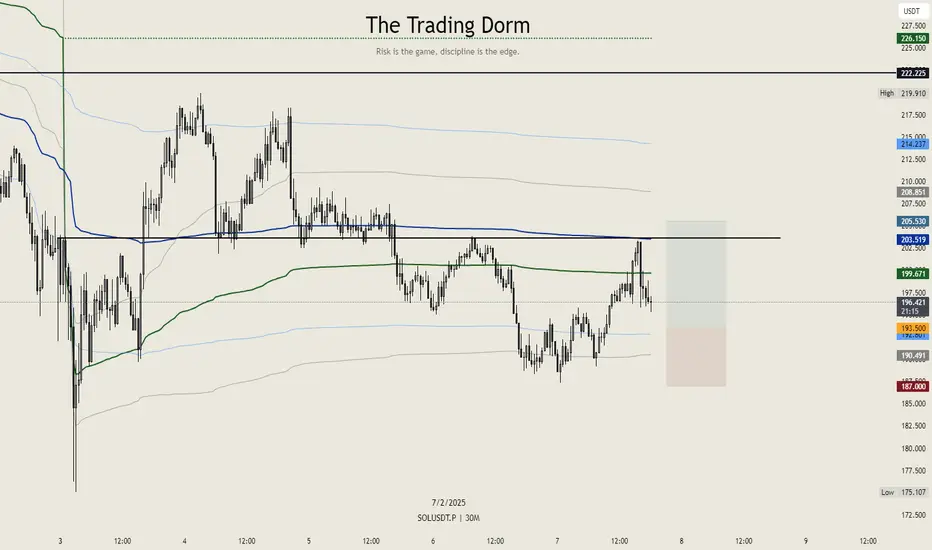
Solana $SOL Setup – Keeping it CleanSolana looks strong, so it’s time for a trade. The entry is placed at $193.50, with a stop-loss at $187 to keep risk in check. The target is set at $205.53, aligning perfectly with the monthly and weekly VWAP VALs.
This setup offers a 1:1.85 risk-to-reward ratio—nothing crazy, just a clean, structured trade. No moonboy fantasy for now, just following the price action and executing accordingly.
FTT ANALYSIS📊 #FTT Analysis
✅There is a formation of Falling Wedge Pattern on daily chart with a breakout and currently trading around its major support area🧐
Pattern signals potential bullish movement incoming after a successful retest
👀Current Price: $1.946
🚀 Target Price: $3.050
⚡️What to do ?
👀Keep an eye on #FTT price action and volume. We can trade according to the chart and make some profits⚡️⚡️
#FTT #Cryptocurrency #TechnicalAnalysis #DYOR

Starting a Bitcoin Analysis Series – February EditionI’m kicking off a Bitcoin analysis series for February , where I’ll be sharing quick and to-the-point updates on the Bitcoin chart throughout the month. Alongside that, I’ll also post my trade ideas as they develop. The goal is to stay on top of the price action and navigate the market with clear, structured setups.
I might not be able to catch every single move, but I’ll do my best to cover the most relevant ones. Hopefully, this will lead to some solid trades and strong results. At the end of the day, it’s not that complicated—you just have to trade what you see .
Looking forward to an exciting month in the crypto market!

Btc backtest insane1800 trades 77% net profit
Same algo as previous posts
only change made was algo sensitivity

NATGATE - 11 RECORD SESSION LOWS ?NATGATE - CURRENT PRICE : RM1.79
On 02 August 2024, the stock made a FALLING WINDOW . The selling pressure continues until price starts to stabilize and create a double bottom support level near RM1.65 - 1.68.
On 29 October 2024, the share price closes above the top of FALLING WINDOW resistance level indicates strong bullish momentum. At the same time, the share price also successfully closed above ICHIMOKU CLOUD (after trading below KUMO almost 3 months). This two scenario gives strong bullish outlook for NATGATE. From here, the stock continue moving upside until RM3.03 (ALL TIME HIGH) - upside movement of 40% from the breakout point on 29 OCTOBER 2024.
After reach ALL TIME HIGH, the stock made an EVENING STAR pattern. From there, the stock starts declining and makes 11 RECORD SESSION LOWS.
Here is the important points to have a look. We can expect a rebound from current price as there are some hints given by chart :
1) 11 RECORD SESSION LOWS creates an OVERSOLD situation (The record session topic is discussed by STEVE NISON in his book - BEYOND CANDLESTICK , PAGE 121 - 127)
2) The last two session was bullish HAMMER - the long lower shadows give hint that potential bottom had reached and the bears are getting tired.
3) Price bounce from the previous DOUBLE BOTTOM support level area near RM1.65 - RM1.68 indicates that the BULLS are aggresively buying the shares near the support level.
In conclusion, as a aggresive trader, this is an oppurtunity for me to buy the stock at price RM1.79 - RM1.81. If as expected the share price starts rebound higher, i would take my profit at RM1.95 (+8%) and RM2.05 (+14%). My support level will be RM1.68 (the low of bullish hammer). My time frame for trading this stock is only one month.
ENTRY PRICE : RM1.79 - RM1.81
TARGET PRICE : RM1.95 , RM2.05
STOP LOSS : RM1.68
TIME FRAME - Not more than ONE MONTH
TAYOR !


TSLA in Free Fall: How Low Will It Go ?Tesla is in free fall – and so far, there’s no sign of a turnaround. The 38.2% retracement zone has been hit, but let’s be honest: there’s no real bounce yet. Here’s why I expect the stock to drop further towards $360 – and how I’m positioning my entries.
Since mid-December, NASDAQ:TSLA has been in a clear downtrend on lower time frames, with no serious buying momentum yet. My first entry is already set as a limit order just below current support. If sellers keep the pressure on, a second entry below the untouched VWAP could make sense – with a tight stop in case TSLA takes another dive.
I’m staying on top of this and ready to adjust, but one thing’s for sure: The moment TSLA shows it’s done bleeding, it's going to send higher!

reversal by CASH Market openWe will reverse by 91,530 S5 or 87,668. Probably the4 first one, and within 7 hours... Based on Elliot Wave Theory and the daily Pivot Point range.
I listened to the folks in the Cryptocurrency room and heard things like, "we will never reverse" all doom and gloom, it makes me feel like I have wasted a. lot of time trying to teach Traders about how the markets work, going from S5 to R5, back to S5, back to R5. Sometimes R6 and S6.


QQQ / NDX / SPY /SPX showing some exhaustionLooking at prior charts for QQQ/NDX and SPY/SPX, it appears some similar technical coincidences have developed again.
Using QQQ as my example, I'm of the opinion an overnight down-trend will begin after-hours on /NQ and /ES futures, thus resulting in an initial price retest to roughly $511 for QQQ.
I'm posting this as of Thursday afternoon, February 6, 2025, EST

Short before final long We're seeing liquidity below and above. MM will want both. My guess is we go down once more before final leg up. Lets see.

PYPL : Another Dive or Finally Time to Buy?PayPal (PYPL) has been getting slapped around like a rookie in a heavyweight fight. The stock is now chilling above a thick support zone—right above the 50% and 61.8% Fibonacci retracement levels. Sounds like fancy chart talk, but all it really means is: This could be where the pain finally stops.
There's also an unfilled gap across multiple timeframes, and gaps like these tend to get filled at some point. If NASDAQ:PYPL keeps sliding, it might take out the previous quarterly low. Why does that matter? Because these lows act like a magnet, dragging price down just enough to shake out weak hands before launching higher. That’s when the selling pressure finally dies down. And the RSI? Almost in the basement—last time we saw this (November 2023), PYPL ripped higher shortly after.
My plan? Set alerts, watch closely, and pounce when the signs point to a reversal. I’m not about to catch a falling knife, but if this thing turns around, I sure as hell don’t want to be left behind.

Buy signal for NVOGood earnings aside, we got a buy signal on the weekly chart so we are looking the first target being the weekly 21ema, which is currently sitting at around $100

This is a Wyckoff VSA Test in a Rising Market NasdaqThis short video shows a classic Wyckoff Volume Spread Analysis set up, a Test in a Rising Market.

TOSHI/USD Bearish Phase is Over! Is a Bullish Breakout Coming?After a prolonged bearish correction, TOSHI/USD is flashing signals of a potential breakout. If you're still stuck in a bearish mindset, you might be missing the next big move!
🔥 Key Bullish Signals:
✅ Higher Lows Forming – Buyers stepping in at stronger levels.
✅ Volume Surge
💡 Trading Idea:
🎯 Long Entry: Look for confirmation above with strong volume.
📢 Final Takeaway: If TOSHI/USD holds key support and breaks resistance, we could see a strong rally. Stay alert and trade smart!
💬 What’s your outlook on TOSHI? Drop your thoughts below! 👇
#TOSHIUSD #CryptoTrading #BullishBreakout #TradingIdeas #TrendReversal #Altcoins #CryptoMarket

Inverted head and shoulder for btcThings looking up for btc. The winter pump is coming. Let's see if support holds.

NFP Incoming - Will SPX Smash 6100?NFP Incoming – Will SPX Smash 6100? | SPX Market Analysis 7 Feb 2025
The bulls keep charging as SPX edges closer to 6100. But with the NFP report dropping pre-market, things could get lively.
Will we blast through resistance or bounce back down? Expect some whipsaw chaos before the market settles – but with a bullish trend already in play, we should at least get one more push toward target exits before the dust settles.
---
SPX Deeper Dive Analysis:
📈 Bullish Move On Track
SPX has ridden the momentum train all the way from the range lows to the range highs. Now, we’re staring at 6100, the key level where decisions will be made.
🚀 NFP Report – A Market Mover
Today’s Non-Farm Payroll (NFP) data drops just before the opening bell. This is one of the bigger monthly catalysts, meaning we could see:
A breakout past 6100 if the market likes the numbers.
A sharp rejection back into the range if traders get spooked.
A whipsaw shakeout, with wild swings before settling.
🔄 Short-Term Expectation? A Push Higher
Even if volatility kicks in, the existing bullish momentum should at least give us a final nudge up toward target exits. Whether we smash through 6100 or stall out, we’re in prime position to lock in profits.
⏳ The Good Kind of Waiting
Once again, we’re in a holding pattern, waiting for the market to tip its hand. But this is strategic patience – the kind where we’ve done the hard work and now simply let the market do its thing. The setups are in place – now, we sit back and watch the magic unfold.
---
Fun Fact:
📢 Did you know? In 2010, a trader accidentally caused a $1 trillion stock market crash in just 36 minutes – all because of a fat-finger trade.
💡 The Lesson? One typo, one misclick, or one overleveraged position can cause chaos. Always double-check your trades, because even the pros have hit the wrong button before.

IWM weekly analysisThe price couldn't close above the previous ATH and only swept it.
It made a market structure change on the weekly TF and retraced back to the weekly BKR
and weekly bearish FVG.

Bought 1.4 SOLUSD at 195.006 FEB 2025
Bought 1.4 SOLUSD at 195.00
We are near -2.5 Standard Deviation Range.
The chances of it staying here are slim.
Also paired with the liquidation heat maps.
Seems like an easy gain.

SOLUSD BUY6 FEB 2025
Bought 1.4 SOLUSD at 195.00
We are near -2.5 Standard Deviation Range.
The chances of it staying here are slim.
Also paired with the liquidation heat maps.
Seems like an easy gain.

The Moment We've Been Waiting Prime Opportunity on $TOSHIUSDA golden long opportunity has emerged as COINBASE:TOSHIUSD taps into a fresh daily demand zone, aligning perfectly with an M15 demand zone. This setup signals a high-probability bullish move from a key liquidity area.
🔥 Key Levels to Watch:
✅ M15 Demand Zone – Fresh liquidity, strong potential for an impulsive move.
✅ Daily Demand Zone – Higher time frame confluence for added confidence.
✅ H1 Demand Zone – For those who prefer extra confirmation, waiting for the H1 zone may provide additional confluence for a safer entry.
With market momentum shifting, this could be the perfect time to enter a long position on $TOSHIUSD! 📈 Keep an eye on price action and manage your risk accordingly.
#TOSHUSD #CryptoTrading #Forex #SupplyAndDemand #LongOpportunity #TechnicalAnalysis
