Potential trade setup on GBPUSDWe are looking at a short trade on GBPUSD based on the stretch strategy. There is trend,stretch and direction alignment with this trade on both 1h and Daily TF. Late entry was taken on price breakout after retracement. There is a high probability for range,previous daily high and range to be formed to the downside. We will exit the trade once range has been achieved.
Trader Order Details:
GBPUSD(Short)
E - 1.2407
SL - 1.2428
T - 1.2387
We will be tracking this move and updating the post as we go along on the charts and on video. Keep a look out for it traders.
Contains IO script

NVDA "NVIDIA" Remains Bearish! Monthly Volume is low, MACD Momentum is falling as price continues to drop...

Prepare to BUY Spot SKLUSDT (M & 3M Cycle Combination)🚀 Prepare to BUY Spot SKLUSDT (M & 3M Cycle Combination)
🌟 SKLUSDT has been in accumulation since 2022 – Now is the time for a breakout! 🌟
🌍 Market Overview:
After a prolonged accumulation phase from 2022, SKLUSDT is now showing signs of preparing for a strong move in the M & 3M cycles. This marks a strategic entry point for long-term investors looking to capitalize on the next expansion phase.
📊 Trade Plan:
📌 Entry Point:
$0.057 or lower – An optimal accumulation range for maximizing returns.
🎯 Target:
x5 - x8 potential growth as the cycle plays out.
⏳ Hold Time:
Throughout 2025, aligning with the anticipated long-term uptrend.
💡 Note:
Accumulate progressively within the suggested price zone for the best positioning.
Keep an eye on market confirmations and breakout signals.
Patience and strategic holding will be key to maximizing profits.
🔥 SKLUSDT is on the verge of a massive breakout – Don't miss this golden opportunity! 🔥

Kupno KrótkoterminoweAll Information provided on screen shot.
I remind you that this is just an idea and my individual analysis.

Looking For More Upside In GLDI have talked about gold before in some articles I wrote both on my website and on TV. It was a great entry for a long term move based on seasonality, macro and technical setup. I have since been able to move my risk to profitable. Now, gold has pulled back from the top of keltner channel offering a nice swing opportunity.

Rip or Dip? SPX at a Crossroads!📈 Rip or Dip? SPX at a Crossroads! 🚀🔻| SPX Market Analysis 29 Jan 2025
SPX is at an inflection point. Will it rip higher or take a dive? We’ve just rolled into the notorious Feb/Mar correction season, and I can’t help but notice a Bollinger Band W-Bottom potentially setting up on the daily chart.
We saw something eerily similar on the 30-min chart back around the 12th of Jan, which played out beautifully. Could we see a repeat – but on a larger scale? Let’s break it down.
SPX Deeper Dive Analysis:
📊 The SPX Setup: What’s Next?
🔹 Correction Season – Historically, Feb/Mar tends to see some turbulence, making this a crucial time to assess the market’s next big move. What is the next seasonal correction window? Sep/Oct – but let’s deal with one at a time!
🔹 Bollinger Band W-Bottom – A potential W-bottom is forming, which, if it is confirmed, could see price hug the upper Bollinger band in a rip ‘n ride scenario.
🔹 Tag ‘n Turn Says Bullish! – The SPX Income System has done its job. We’ve profited off Monday’s gap down and bear swing, but now the setup suggests a possible bull swing unfolding.
🔹 What About 30-Min Charts? – If you check the 12th Jan move, we saw a similar Bollinger Band structure play out on the smaller time frame, leading to a solid push higher. Déjà vu on the daily charts?
🎯 The Plan Moving Forward
☑ Monitor bullish follow-through – If SPX holds momentum, we could see a breakout and run higher.
☑ Watch for confirmation – A failed breakout or exhaustion candle could hint at a February dip instead of a rip.
☑ Trade the setups, not the emotions – Following the Tag ‘n Turn system keeps us on the right side of the market, bull or bear.
Fun Fact:
📉 Did you know the 1987 stock market crash happened on a Monday? Dubbed Black Monday, the Dow dropped 22.6% in a single day, making it the worst one-day percentage decline in history. The cause? A mix of programmatic trading, high valuations, and market panic.
🔎 The eerie part? The market recovered all losses within two years, proving once again that panic selling rarely pays off!

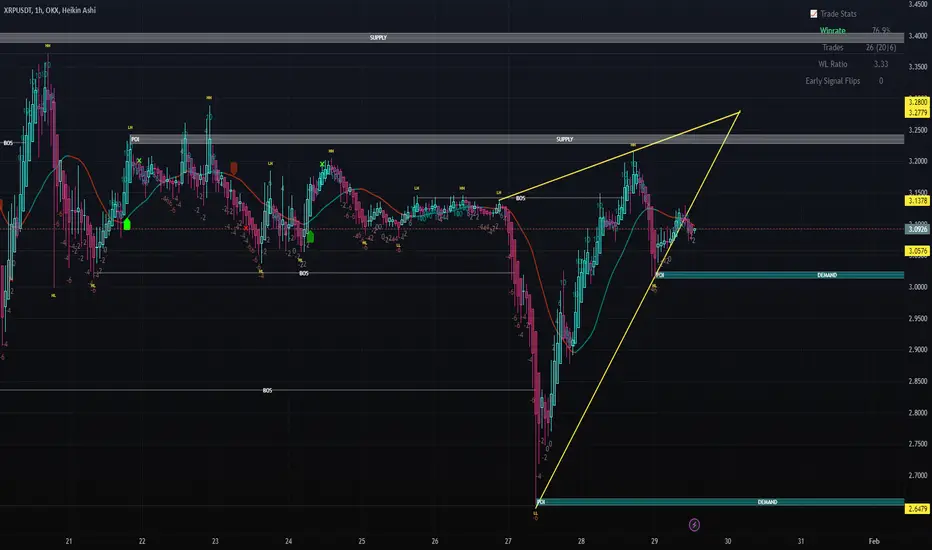
Updated XRP/USDT 1H Chart Analysis – Next 24 Hours OutlookKey Observations:
Rising Wedge Breakdown Risk (Bearish Bias)
XRP is still within a rising wedge, a bearish pattern that often leads to a breakdown.
Price is testing the lower trendline, indicating a crucial decision point.
Supply & Demand Zones:
Supply Zone (Resistance): 3.28 - 3.13 (Price struggled to break above)
Demand Zone (Support): 3.03 - 2.88 (Price approaching this area)
Lower Demand: 2.65, a strong historical level.
Support & Resistance Levels:
Immediate Resistance: 3.09 - 3.13
Immediate Support: 3.03 - 3.05
Next Major Support: 2.88, aligning with demand.
Break of Structure (BOS) & Price Action:
There is a break of structure (BOS) to the downside, indicating potential trend reversal.
If the wedge breaks down, XRP may move lower.
Potential Next Move (24H Forecast)
Bearish Scenario (Higher Probability, ~70%)
A break below 3.03 could send XRP to 2.88
If bearish momentum continues, 2.65 (lower demand zone) becomes a possible target.
Bullish Scenario (Lower Probability, ~30%)
If XRP holds 3.03, a bounce back to 3.09 - 3.13 is possible.
A break above 3.13 could push toward the 3.28 supply zone.
Final Conclusion:
Bearish Bias – XRP is more likely to break down and test 2.88 soon. If buyers don’t step in, 2.65 is the next key level.
TAO ANALYSIS📊 #TAO Analysis
✅There is a formation of Falling Wedge Pattern on daily chart with a breakout and currently trading around its major resistance area🧐
Pattern signals potential bullish movement incoming after a breakout of major resistance zone
👀Current Price: $479
🚀 Target Price: $659
⚡️What to do ?
👀Keep an eye on #TAO price action and volume. We can trade according to the chart and make some profits⚡️⚡️
#TAO #Cryptocurrency #TechnicalAnalysis #DYOR

VINE HOURLY TIMEFRAME ANALYSISVINE HOURLY TIMEFRAME UPDATE (ON DEMAND)
Elon Musk says he is "looking into" bringing back Vine, and rus, CEO of Vine, just launched a meme coin. Vine was a once-popular short video sharing platform that allowed users to shoot and upload videos up to 6 seconds long
ANY THOUGHTS ON AMEX:VINE ?

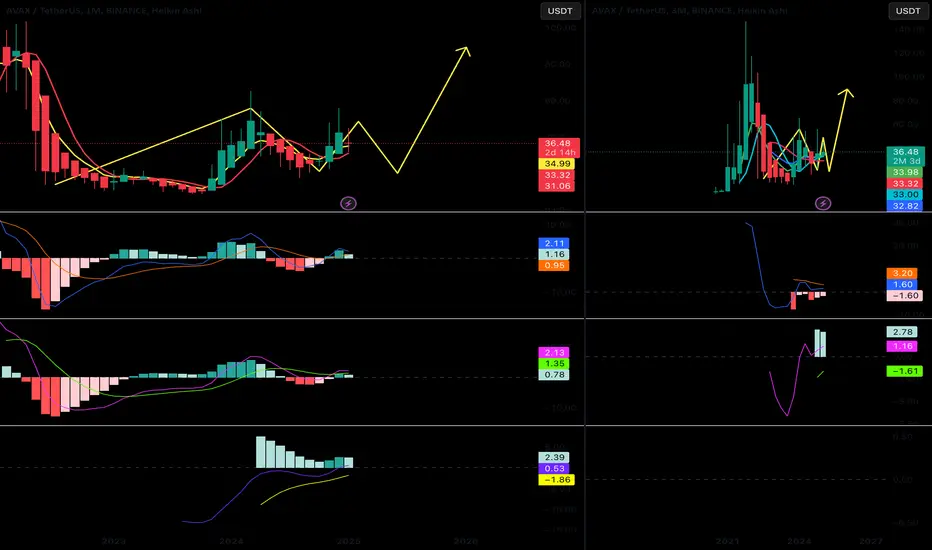
Prepare to BUY Spot AVAXUSDT (3M Cycle)🚀 Prepare to BUY Spot AVAXUSDT (3M Cycle)
🌟 AVAXUSDT is gearing up for a powerful 3M cycle breakout – A golden opportunity for accumulation! 🌟
🌍 Market Overview:
AVAX, one of the top 200 cryptocurrencies, has been in an extended accumulation phase. The upcoming 2-3 month correction is expected to provide the perfect buying window before a major uptrend unfolds in 2025.
📊 Trade Plan:
📌 Entry Point:
$20 - $30 – Optimal accumulation zone for positioning ahead of the breakout.
🎯 Target:
$80 - $100 – Aiming for a strong rally as the 3M cycle develops.
⏳ Hold Time:
Throughout 2025, aligning with the expected cycle expansion.
💡 Note:
Accumulate strategically within the recommended price range.
Watch for confirmation of bullish momentum as the next uptrend begins.
Patience will be key to capturing the full potential of this cycle.
🔥 AVAXUSDT is preparing for a massive move – Secure your position now! 🔥
Prepare to BUY Spot LPTUSDT (M & 3M Cycle Combination)🚀 Prepare to BUY Spot LPTUSDT (M & 3M Cycle Combination)
🌟 LPTUSDT is forming a strong bottom structure – A prime setup for a major breakout in 2025! 🌟
🌍 Market Overview:
LPTUSDT is currently bottoming out on the W and D1 timeframes, setting the stage for a new M cycle uptrend in 2025. This presents a strategic opportunity for accumulation before the next significant move.
📊 Trade Plan:
📌 Entry Point:
$8 - $10, or as low as possible for optimal positioning.
🎯 Target:
$33 - $40 – Aiming for high returns as the M & 3M cycles progress.
⏳ Hold Time:
Throughout 2025, allowing the full potential of the cycle to unfold.
💡 Note:
Focus on accumulating within the suggested price range.
Monitor key confirmations for breakout momentum.
Patience and disciplined execution will be essential for maximizing gains.
🔥 LPTUSDT is on the verge of a major cycle move – Don't miss this golden accumulation phase! 🔥

OG HOURLY TIMEFRAME ANALYSISOG HOURLY TIMEFRAME UPDATE (ON DEMAND)
Socios is an app for football fans, where users acquire voting rights to influence the clubs they support by acquiring club- Fan tokens
ANY THOUGHTS ON OG ?

BLOK HOURLY TIMEFRAME ANALYSISBLOK HOURLY TIMEFRAME UPDATE (ON DEMAND)
Bloktopia is a decentralized metaverse backed by and built on Polygon
ANY THOUGHTS ON BLOK ?

The FOMO is exhausting - SHORT planHi Traders,
I think the FOMO has already exhausted, I drawn my imagination.
Be careful!
Listen to the BTC, if very bullish, than can change my plan!
Good luck!

AENT Boom or Bust Play!Alliance Entertainment (AENT) is showing strong bullish momentum, with a gap forming around the $4.50 level. A breakout above the $8.60 daily resistance would confirm further upside, positioning the stock to target the $12.23 resistance. This trade setup offers an excellent risk-to-reward ratio, with a stop-loss set at $3.49 to manage downside risk.
As a key distributor of entertainment media, AENT is positioned to benefit from increasing demand for physical and digital content. With strong retail partnerships, a diversified product portfolio, and an expanding market presence, the company has the potential for significant long-term growth.
This combination of technical momentum and solid fundamentals supports a bullish push toward $12.23, making AENT a compelling opportunity for traders and investors alike.
NASDAQ:AENT

Brazilian Bull Run!XP Inc. (XP) is showing strong bullish momentum, with a gap forming around the $11.18 level. A breakout above the $15.25 weekly resistance would confirm further strength, positioning the stock to target the $20.39 resistance. This trade setup offers an excellent risk-to-reward ratio, with a stop-loss set at $11.18 to manage downside risk.
As a leading investment platform in Brazil, XP is uniquely positioned to capitalize on the country's growing demand for digital financial services and investment solutions. With a robust client acquisition strategy and a diverse range of financial products, XP continues to expand its market share in brokerage, asset management, and banking services.
Additionally, as Brazil’s financial markets mature and more retail investors enter the space, XP stands to benefit from long-term secular trends in wealth management and fintech adoption. Strong earnings growth, consistent innovation, and macroeconomic tailwinds further reinforce XP’s upside potential.
This combination of technical momentum, increasing market penetration, and strong sector fundamentals supports a bullish push toward $20.39, making XP an attractive opportunity for traders and long-term investors alike.
NASDAQ:XP

Customer Service Meets Market SurgeFive9 (FIVN) is showing strong bullish momentum, with a gap forming around the $38.00 level. A breakout above the $47.13 daily resistance would confirm further upside, positioning the stock to target the $92.36 resistance. This trade setup offers an excellent risk-to-reward ratio, with a stop-loss set at $35.70 to manage downside risk.
As a leader in cloud-based contact center solutions, Five9 is well-positioned to benefit from increasing demand for AI-powered customer service automation and digital transformation initiatives. With strong enterprise adoption, continuous innovation, and an expanding market presence, FIVN has the potential for significant long-term growth.
With its combination of technical momentum and strong industry tailwinds, FIVN presents an attractive opportunity for traders and investors aiming for $92.36.
NASDAQ:FIVN

ORDIUSDT Perpetual Swap Contract chart TF 4hBased on the ORDIUSDT Perpetual Swap Contract chart, here's my analysis:
1. Current Market Status:
- Price around 18.271 (-1.04%)
- Winrate: 68.9%
- WL Ratio: 2.19
- Volume showing significant activity
- 67 trades recorded
2. Technical Analysis:
- Strong downtrend in effect
- Price trading below all major EMAs
- Red cloud formation indicating bearish pressure
- Multiple lower highs and lower lows forming
- Entry point marked at 17.024
3. Key Price Targets:
- TP1: 22.133
- TP2: 22.711
- TP3: 25.389
- TP4: 28.873
- TP5: 30.398
- Support level (SL): 13.868
4. Trading Considerations:
- Clear bearish trend with strong momentum
- Price action showing consistent downward pressure
- Multiple resistance levels overhead
- EMAs acting as dynamic resistance
- Low timeframe showing potential bottoming attempt
5. Risk Management:
- Clear stop loss below 13.868
- Strong resistance zones need to be monitored
- Multiple overhead supply zones
- Consider scaling into positions
- Use tight stops due to current volatility
Overall market sentiment remains bearish. While there might be short-term bounce opportunities, the dominant trend is down. Traders should exercise caution and maintain strict risk management practices given the strong bearish momentum.

Unlock the Magic of SPELL: A Strategic Buy Trade Idea Description:**
Discover the potential of **SPELL**, the native token of the **Abracadabra.Money** ecosystem, with this strategic buy trade idea. **SPELL** powers a decentralized finance (DeFi) platform that enables users to mint interest-bearing tokens (ibTKNs) using collateralized assets. This innovative approach to lending and borrowing has positioned **SPELL** as a key player in the DeFi space.
The **fundamentals** behind **SPELL** are compelling. The platform leverages the growing demand for yield-generating assets and decentralized financial services. With the increasing adoption of DeFi and the integration of **SPELL** across multiple blockchain networks, the token is well-positioned for long-term growth. Additionally, the team’s commitment to expanding utility and partnerships adds further credibility to the project.
However, **crypto trading** comes with inherent risks. The volatile nature of the market means prices can fluctuate dramatically in short periods. Always conduct your own research and consider your risk tolerance before entering any trade. This idea is for informational purposes only and should not be considered financial advice.
**Disclaimer:** Trading cryptocurrencies involves significant risk, including the potential loss of capital. Past performance is not indicative of future results. Ensure you understand the risks and consult a financial advisor if needed. This trade idea is not a recommendation to buy, sell, or hold any asset.
Unlock the magic of **SPELL** and explore the opportunities in the DeFi space with confidence and caution.

GALAUSDT and ADAUSDT on the 30-minute (M30) timeframeBased on the provided chart analysis of GALAUSDT and ADAUSDT on the 30-minute (M30) timeframe, here are the key insights:
1. Trend Direction
GALAUSDT (Left Chart):
The chart clearly shows a downtrend, with strong selling pressure before a rebound from the Demand Zone.
The EMA 200, EMA 100, and EMA 50 are still pointing downward, indicating that the recovery is facing resistance.
If the price breaks above the key resistance level at 0.02862 - 0.02910, it may continue toward the 0.5 or 0.618 Fibonacci retracement levels.
ADAUSDT (Right Chart):
The primary trend is also bearish, with the price making new lows before rebounding.
There is a key resistance zone at 0.9280 - 0.9358, where selling pressure might return.
If the price can hold above this zone, it may move towards the next resistance at 0.9453 - 0.9510.
2. Trading Approach
GALAUSDT:
Entry (Long): 0.02703 (Demand Zone)
Take Profit (TP) Levels: 0.02862 / 0.02910 / 0.02959 / 0.03029 / 0.03071
Stop Loss (SL): 0.02605
If the price breaks below 0.02703, further downside risk could push it towards 0.026.
ADAUSDT:
Entry (Long): 0.9030 (Demand Zone)
Take Profit (TP) Levels: 0.9280 / 0.9358 / 0.9435 / 0.9510 / 0.9685
Stop Loss (SL): 0.8875
If the price drops below 0.9030, it may test the 0.89 - 0.88 support levels.
3. Risk Considerations
The market is still in an overall downtrend, making long positions riskier unless a clear trend reversal occurs.
Watch for price action at resistance levels—if reversal signals appear, it may be better to reduce risk or exit early.
Stop Loss (SL) and Risk Management are crucial to prevent excessive losses.
Conclusion
Both assets are rebounding from key support zones, but resistance levels could halt the recovery.
Trading strategies should focus on low-risk entry points, such as waiting for confirmation from candlestick patterns or indicators.
If resistance levels hold, prices may reverse downward to retest support zones.
Recommendation:
Use Stop Loss and proper risk management since the overall trend remains bearish.

VINEUSDT and HBARUSDT Perpetual Swap Contracts TF 30mBased on the charts showing VINEUSDT and HBARUSDT Perpetual Swap Contracts, here's my analysis:
VINEUSDT:
1. Current Status:
- Price around 0.26561
- Trading in a consolidation pattern
- Entry point at 0.22162
- Key resistance at 0.27417 (SL level)
2. Technical Indicators:
- Showing signs of bullish momentum
- Price above major EMAs
- Clear buy signal marked on the chart
- Trading volume appears moderate
HBARUSDT:
1. Current Status:
- Price: ~0.3056 (-0.69%)
- Winrate: 71%
- 60 trades executed
- WL Ratio: 2.58
- 8 Early Signal Flips
2. Price Targets:
- TP1: 0.30582
- TP2: 0.30912
- TP3: 0.31242
- TP4: 0.31713
- TP5: 0.31993
- Entry level: 0.29212
3. Technical Analysis:
- Strong downtrend recently
- Currently showing potential reversal signs
- Trading below EMA 100 and 200
- Red cloud formation indicating bearish pressure
- Supply zone visible around 0.32000
Overall Market Strategy:
- Both pairs showing potential reversal setups
- VINE appears more bullish with clearer buy signals
- HBar requires more confirmation of trend reversal
- Recommend careful position sizing and strict stop losses
- Consider taking partial profits at defined target levels
Risk Management:
- Use clearly defined stop losses
- Watch for rejection at major resistance levels
- Monitor volume for confirmation of moves
- Consider scaling in/out of positions rather than all-in-all-out
จากกราฟของคู่เหรียญ VINEUSDT และ HBARUSDT Perpetual Swap นี้ ผมขอวิเคราะห์ดังนี้:
VINEUSDT:
1. สถานะปัจจุบัน:
- ราคาอยู่ที่ประมาณ 0.26561
- เคลื่อนตัวในกรอบสะสม (Consolidation)
- จุดเข้าซื้อที่ 0.22162
- แนวต้านสำคัญที่ 0.27417 (ระดับ SL)
2. ตัวชี้วัดทางเทคนิค:
- แสดงสัญญาณแนวโน้มขาขึ้น
- ราคาอยู่เหนือเส้นค่าเฉลี่ย EMA หลัก
- มีสัญญาณซื้อที่ชัดเจนบนกราฟ
- ปริมาณการซื้อขายอยู่ในระดับปานกลาง
HBARUSDT:
1. สถานะปัจจุบัน:
- ราคา: ประมาณ 0.3056 (-0.69%)
- อัตราชนะ: 71%
- จำนวนเทรด: 60 ครั้ง
- อัตราส่วน WL: 2.58
- สัญญาณพลิกตัวเร็ว: 8 ครั้ง
2. เป้าหมายราคา:
- TP1: 0.30582
- TP2: 0.30912
- TP3: 0.31242
- TP4: 0.31713
- TP5: 0.31993
- จุดเข้าซื้อที่: 0.29212
3. การวิเคราะห์ทางเทคนิค:
- มีแนวโน้มขาลงที่รุนแรง
- ปัจจุบันแสดงสัญญาณการกลับตัว
- ราคาเคลื่อนตัวต่ำกว่า EMA 100 และ 200
- เมฆสีแดงบ่งชี้แรงกดดันขาลง
- โซนแนวต้าน (Supply) อยู่ที่ประมาณ 0.32000
กลยุทธ์การเทรดโดยรวม:
- ทั้งสองคู่เหรียญแสดงรูปแบบการกลับตัว
- VINE ดูมีแนวโน้มขาขึ้นที่ชัดเจนกว่าพร้อมสัญญาณซื้อ
- HBar ต้องการการยืนยันการกลับตัวของเทรนด์เพิ่มเติม
- แนะนำให้ควบคุมขนาดการลงทุนและตั้ง stop loss อย่างเคร่งครัด
- พิจารณาทยอยทำกำไรตามเป้าหมายที่กำหนด
การบริหารความเสี่ยง:
- ใช้จุด stop loss ที่ชัดเจน
- ระวังการถูกปฏิเสธที่แนวต้านสำคัญ
- ติดตามปริมาณการซื้อขายเพื่อยืนยันการเคลื่อนไหว
- พิจารณาทยอยเข้า/ออกจากตลาด แทนการเข้า/ออกเต็มจำนวน

PNUTUSDT Perpetual Swap Contract 30mBased on the PNUTUSDT Perpetual Swap Contract chart, here's my technical analysis:
1. Current Market Status:
- Price: 0.2511 USDT (-1.53%)
- Volume: 1.73M
- Winrate: 64%
- Trades: 54
- WL Ratio: 1.8
- One Early Signal Flip recorded
2. Technical Analysis:
- Strong downtrend with recent potential bottoming pattern
- Price is trading below major EMAs (100 and 200)
- Recent bounce from lows showing potential reversal signs
- Red cloud formation indicating bearish pressure still present
3. Key Price Levels:
- Entry point: 0.2281
- Target Prices (TP):
* TP1: 0.2464
* TP2: 0.2521
* TP3: 0.2577
* TP4: 0.2657
* TP5: 0.2705
- Major supply zone around 0.2760
4. Trading Considerations:
- Recent bullish reversal attempt from oversold conditions
- Volume increasing on the bounce, suggesting potential accumulation
- Multiple resistance levels ahead that need to be cleared
- EMA crossovers could provide confirmation of trend change
5. Risk Management:
- Clear stop loss levels below recent lows
- Strong overhead resistance suggests scaling out positions
- Consider taking partial profits at each TP level
- Position sizing should be conservative given recent volatility
The overall market structure remains bearish, but showing early signs of potential reversal. Traders should wait for confirmation of trend change and maintain strict risk management given the strong previous downtrend.

SOLUSDT Perpetual Swap Contract chart 30mBased on the SOLUSDT Perpetual Swap Contract chart, here's my technical analysis:
1. Current Market Status:
- Price is trading at 230.42 USDT (+0.13%)
- Trading volume is 1.64M
- Winrate showing a bearish trend with 4.96 WL Ratio
- 50 trades recorded
2. Technical Analysis:
- The chart shows a significant downtrend from recent highs
- Price is currently attempting to form a bottom
- EMA 100 is acting as dynamic resistance
- A possible reversal pattern may be forming at current levels
3. Key Price Levels:
- Major resistance at 243.90 (TP7)
- Important target points:
* TP1: 232.29
* TP2: 234.51
* TP3: 236.73
* TP4: 239.88
* TP5: 241.76
- Entry level marked at 225.12
- Current demand zone visible around 224-225 area
4. Trading Considerations:
- The downtrend has been steep but showing signs of potential reversal
- Volume profile suggests accumulation at current levels
- Multiple resistance levels need to be cleared for trend reversal confirmation
- EMA crossover might signal trend change if price sustains above current levels
5. Risk Management:
- Strong demand zone provides potential stop loss area
- Multiple overhead resistance levels suggest scaling out positions
- Position sizing should be conservative given recent volatility
- Consider partial profit taking at each TP level
Overall sentiment appears to be attempting to shift from bearish to neutral, but requires confirmation of reversal pattern and break above key resistance levels. Traders should maintain strict risk management given the recent downtrend momentum.
