Focus on MA line (resistance) and trading channel (support)EURUSD is stalling between 1.11 and 1.13 following a down trend line breakout.
For about a month now EURUSD has been consolidating and it can end this week with speeches from Draghi, Yellen and the U.S GDP number (impact on the Dollar and therefore EURUSD).
1.12 is the nearest resistance zone - The Fast MA line is the technical element to focus on
From below we have the bottom of a trading channel (pink) as potential support.
A breakdown of the trading channel will probably lead EURUSD towards 1.11 and maybe even towards 1.1
A breakout above 1.12 will trigger a bullish move that can end with a re-test of the weekly resistance zone 1.14-1.15
Read more about EURUSD, DXY, GLD and SPX in this week's newsletter
#WeeklyMarketsAnalysis on Twitter
Dollar_index

EURUSD should test 1350 any moment.If 1350 is broken 1520 will be the next station. Going steady this time.
Depending on the news coming out of Syria until the end of July, 17 will be tested after 2.5 years.
Or else 0815 is strong support.

DXY: Two Buy Setups DXY has been forming an inverse head and shoulders, with nice price action during the rate hike event. Watch for a break of the neckline for a favorable trade setup.


US DOLLAR INDEX: Buy setup on reversal channelHere we have dollar index chart and we are having a reversal channel formation to upside.
Look for breakout and if price does not breakout this time then look for the bottom to buy.
When dollar index moves, it means that dollar pairs will move with it as well (correlation). So you should look for sell on pairs such as NZDUSD, AUDUSD, EURUSD....

Hammer on #USD INDEX #DXYPossible Hammer building and a bounce of 61.8 fib. A close above 97.52 would be short term bullish. Watch #EURUSD a close below 1.1180 = dollar bullish

People buy USD as Comey tension eases and focus shifts to FOMCThe Harmonic Support Zone I mentioned in this week's newsletter.
Comey's tension eases, the GBPUSD is crashing down following the UK elections (1.3 was also a resistance zone I mentioned in this week's newsletter) and Investors are starting to buy again with expectations for another rate hike next week.
DXY is up and back above 97$
The final target zone of this potential bullish scenario is the 200 days MA line and the re-test of the broken trend line.
More updates in next week's newsletter

Potential Buy Zone for Gold GLD fell last week as Dollar rallied towards FOMC.
The turn came after the completion of a bearish Gartley pattern.
Now GLD is approaching a potential Buy Zone that includes:
Weekly MA lines
Daily MA lines
Broken trend line
Structure
Risk and Potential Reward are shown
If the Fed won't raise rates, GLD can be an interesting buy.
Read more about GLD, DXY, Bitcoin and more of my weekly forecast in the #WeeklyMarketsAnalysis (search on Twitter)


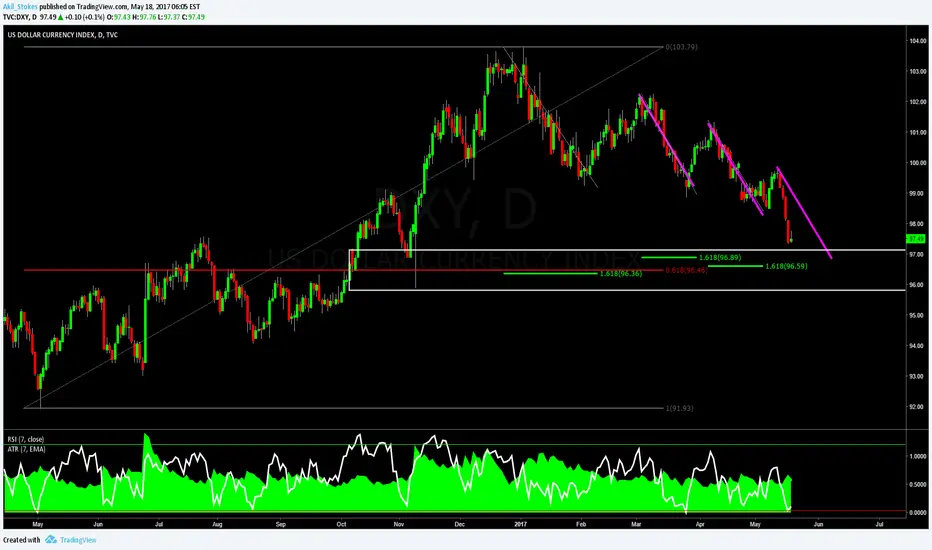
Dollar Index RIPDollar Index on the daily time frame looks like it's set for a free fall.
ADX shows a very strong bearish trend and Stoch Rsi still shows strong selling pressure. When you look at the price levels its just broken through a resistance and it seems to keep trading in the fresh downwards channel.
With this in mind, stay sharp on possible sell setups on the dollar pairs. Also look to buy JPY.

Dollar Index To Further DropAnalyzing Dollar Index is somthing every trader should do no matter if he or she trades it. The Index affects many pair in our portfolio so having a view on where is about to head helps us in our trading decision. Looking at the 240min chart we may see that obviously is in a downtrend, moving into a descending channel and is now testing a key resistance level, the sliding parallel of the median line. Switch to the hourly chart and wait for a brekout below the correction. Then watch for a sell setup completion which most likely will make Dollar Index drop
Hourly structure:


Rising channel leads Bitcoin into resistance The rising channel you see in the chart is leading BTCUSD into a daily resistance zone that includes a bearish harmonic pattern and a Fib confluence zone.
Stop loss above the psychological level, 2000 (with some buffer), should be enough if you want to try and trade Bitcoin lower based on this setup
Conservative entries - Below the Fast MA line and the trading channel (trading channel breakdown)


Break out to the downside in the Dollar IndexThe US Dollar Index has resolved its recent daily wedge to the downside. The break out below 98.35 is a clear signal for selling. A recent is at 95.025 level

DXY: Just Some Random Analysis In my opinion, finding a good trading opportunity is like a detective gathers clues and seeing what they all add up to. There are lots of tools that we can use in our technical analysis, but in my opinion no single one is great. Rather it's the combination of those tools & tactics that allow us to dial down on the best areas in the markets.
USD index long?An old trendline plus the weekly 100SMA could make an interesting point to buy now, if fundamentals come with it. Good luck everyone!

Who killed Dollar Index despite stronger Sentiments and draggingdespite showing you fundamental analysis which also favoring downside in Dollar Index and upside in gold.I have marked the Killer of USD index in technical because we understand pattern but not the soul fundamental behind that pattern.
So guys no worry FOMC hike rate or not the DXY going nowhere but only downside.
Wish you best of luck trade safe and be safe.
Kinds and Regards,
Dipak Z

USD index DXY bearishUSD index price crossed below neck line of head and shoulders that gives us 2 scenarios:
1- Stall into target that is the price range between head and neck line
2- Get stuck in an ascending wedge (between neck line and trend line) until it retests all levels and then break down

Strong rally from MA line drive Dollar Index to 100DXY experienced an amazing week so far and it is charging the 100$ resistance zone again.
The rally started from the 50 weeks MA line.
Near 100$ DXY will meet the psychological structure zone and the Fast MA line as resistance. Will this zone kill the Dollar's comback?
Still ahead this week - Dragi, Fed members and G7

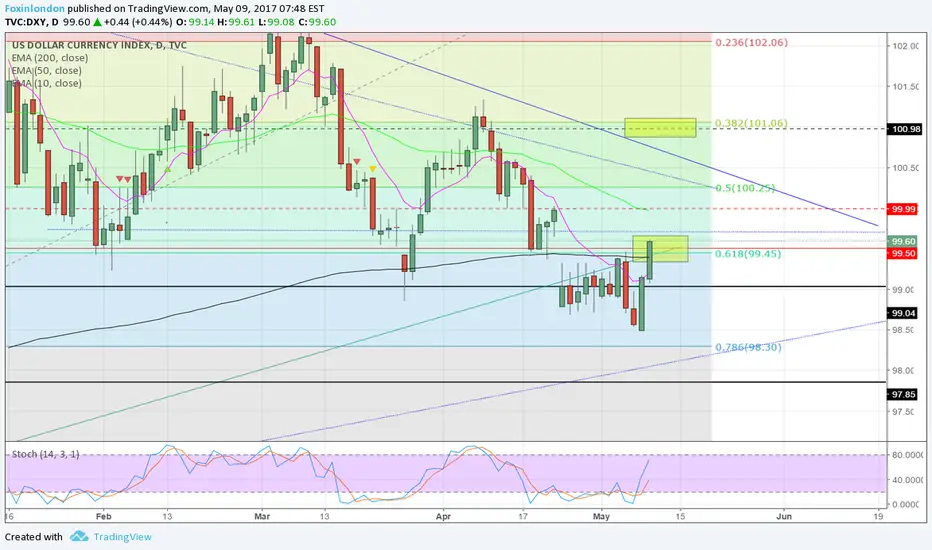
DXY Daily price levelsBullish above 99.5 to 101
Possible reverse at 99.5 and leg lower to 98 and 97.
Bearish below 99

USDJPY - WELCOME BEARS!!USDJPY has finally reached the top of the trend line. we now have consolidation happening. If price comes below the consolidation box 111.900 this will be a great area for shorting. We can expect to see 105 area if this happens. as of now we are currently waiting to see if the trend holds. RSI is making lower highs. Patience is key, so if we see price jump about 40 pips above the consolidation box this will be invalid.
