LONG ON GBP/JPYNice Double Bottom at a Key Demand Level
Jpy index is also Falling from a major resistance area.
I am taking GJ long
Double Top or Bottom

EURUSD: Bearish Outlook Explained 🇪🇺🇺🇸
It feels like EURUSD may continue falling,
following a strong bearish reaction to the underlined
key daily/intraday resistance.
A breakout of a neckline of a double top pattern on a 4H
give a strong bearish confirmation.
Next support - 1.0295
❤️Please, support my work with like, thank you!❤️

EURUSD (2H) - High Volatility and Bearish MomentumOANDA:EURUSD
📶 Technical Analysis:
Weekly Chart
🟢 The overall trend has been consistently bearish since October 2024, indicating a longer-term downtrend
🟢 A strong level of support has been broken and tested at 1.0500, indicating potential for further bearish movement.
🟠 In the past three weeks, volatility has significantly increased, due to a combination of fundamental factors.
Daily Chart
🟢 The overall trend has been bearish since October 2024, reinforcing a larger downside momentum.
4-Hour Chart
🟡 There was a bullish trend early in 2025, but it was broken, and bearish momentum took over by the end of January.
🔴 The February opening gap, influenced by Trump tariffs, caused a strong bullish volatility before a reversal took place.
2-Hour Chart
🟢 A reversal pattern in the form of a double top is visible, suggesting that the bullish momentum has ended. This pattern has been confirmed by two lower highs and two lower lows.
🟡 Watch for a retest of the 1.035 resistance level and confirmation of the double top pattern.
🟢 A break below the recent low at 1.030 would suggest continued bearish movement.
🟠 The next strong support level on the daily chart is around 1.022, where the price could potentially stall or reverse if it moves lower.
🆕 Fundamental Analysis:
🟢 The EUR/USD dropped to near 1.0360 after the release of US Nonfarm Payrolls (NFP) data for January.
🟡 US Labor Market: The economy added 143K jobs, fewer than expected (170K), but the Unemployment Rate dropped to 4% (better than the expected 4.1%).
🟡 The Fed is expected to cut interest rates in its June meeting, but this is uncertain due to mixed signals from the labor market. Chair Powell indicated that any rate adjustments will depend on real progress in inflation or weakness in the labor market.
🟢 President Trump warned of potential tariffs on European goods, which could hurt the Eurozone economy. The Eurozone is facing increased uncertainty, with concerns about higher US tariffs negatively affecting growth.
🟢 EUR/USD faces continued selling pressure, as the Eurozone's economic outlook remains weak, especially with the risk of US tariffs and a dovish ECB.
🔤 Summary:
🟡 Neutral Position Above Red Trend Line: If the price breaks above the red trend line, it could signal a shift to a neutral position, requiring fresh analysis for clearer direction.
🟢 Bearish Continuation Confirmation: As long as the price remains below resistance and the double top formation holds, a bearish continuation is likely.
🟡 Watch for Key Breaks: Pay attention to the break below 1.030 and how price reacts to the 1.022 support level for further confirmation of the bearish trend.

USDCAD on 1h time frame . Testing historical Resistance levelsUSDCAD 1H Analysis – February 10, 2025
📈 Potential Bullish Reversal
The chart shows a double bottom formation near 1.4280, which is a strong bullish reversal pattern.
Price has bounced from this level, suggesting a possible upward move.
📊 Key Resistance Zones to Watch:
1.4550 - 1.4570 → First key resistance (previous support turned resistance).
1.4780 - 1.4800 → Major resistance area where price previously rejected strongly.
🔍 Trading Outlook:
A break above 1.4350 could confirm the bullish momentum.
If price clears 1.4550, the next target would be 1.4800.
A rejection from resistance zones could lead to another decline.
📌 Conclusion: USDCAD is forming a potential bullish structure, but confirmation of a breakout above 1.4550 is needed before expecting further upside. 🚀

EURJPY LongEuro Yen Analysis
The pair is on a strong support line and on a fibonacci level; its expected to bounce back and be in the triangle shape it formed.
What are your technical and fundamental analysis on this pair?

Dogwifhat Coin (WIF): Possible Double Top Pattern / FallingDogwifhat coin seems desperate, where price is looking like it is about to fall hard.
We noticed on bigger timeframes the formation of a "double top" pattern, which upon breaking the neckline zone would result in a possible 60% downfall so keep attention at that neckline zone for now!
Swallow Team

Elf gap swingElf dumped on earnings tonight and I have been watching the company for a while. This seems overblown and looks to have formed a macro triple bottom. My setup here was aftermarket spot entry.
My plan:
Depending on how fast this pivots the PT1= 98$
PT2=108$

BTC Potential Drop to $72K: 3 Signs Indicating a Trend BreatherBitcoin has been on an incredible run, but I believe we may be heading for a pullback toward $72K. There are three key signs that suggest a breather is due:
Double Top Formation – We've seen a clear double top pattern forming, signaling a potential reversal.
RSI Divergence – The RSI is showing divergence from price action, often a sign that the momentum is weakening.
Overbought Conditions – Bitcoin has been in overbought territory for a while now, suggesting that a correction could be on the horizon.
Keep an eye on these factors as they could play a big role in where BTC goes next. Stay cautious and be prepared for potential volatility.
I hope you find it helpful!
Take care and keep it shiny.
Kina ♥

XAUUSD1#Double Top with Bearish divergence.
2#also bearish engulfing candle.
Trade plan
sell limit at 2869.7
Stop Loss 2887
Take profit 2852.4
RRR 1:1

Correction to ELF chart I postedThis is the correction to the elf chart I posted, this was a profitable trade for me. I forgot to draw the lines regarding the post-market level which lines up with Jan-March 2023 consolidation.

PEP "Pepsi" ready to bounce soon!- Low RSI
- Double Bottom
- Gap Fill (Upside)
- Low impact from potential Upcoming Tariffs

SUNDOG +20% UPWARD MOVEWe can check that if market continues like this, on SUNDOG we'll see an upwards move of 20% in 1-2 days.

Genpact Limited Stock Quote | Chart & Forecast SummaryKey Indicators On Trade Set Up In General
1. Push Set Up
2. Range Set up
3. Break & Retest Set Up
Notes On Session
# Genpact Limited Stock Quote
- Double Formation
* Double Bottom Structure | Entry Bias | Subdivision 1
* Numbered Retracement | Long Support
- Triple Formation
* 1st Trendline | Completed Survey | Subdivision 2
* 2nd Trendline | Uptrend Bias & Pattern Confirmation | Subdivision 3
* Daily Time Frame | Trend Settings Condition
Active Sessions On Relevant Range & Elemented Probabilities;
European Session(Upwards) - US-Session(Downwards) - Asian Session(Ranging)
Conclusion | Trade Plan Execution & Risk Management On Demand;
Overall Consensus | Buy

Cocoa UK Commodity Quote | Chart & Forecast SummaryKey Indicators On Trade Set Up In General
1. Push Set Up
2. Range Set up
3. Break & Retest Set Up
Notes On Session
# Cocoa UK Commodity Quote
- Double Formation
* (Uptrend Argument)) | Completed Survey
* 2X Pattern Structure | Combo Feature & Entry Bias | Subdivision 1
- Triple Formation
* Numbered Retracement | 0.786 & 1 | Subdivision 2
* Trendline 1&2 | Neutral Bias | Subdivision 3
* Daily Time Frame | Trend Settings Condition
Active Sessions On Relevant Range & Elemented Probabilities;
European Session(Upwards) - US-Session(Downwards) - Asian Session(Ranging)
Conclusion | Trade Plan Execution & Risk Management On Demand;
Overall Consensus | Neutral

GE Aerospace Stock Quote | Chart & Forecast SummaryKey Indicators On Trade Set Up In General
1. Push Set Up
2. Range Set up
3. Break & Retest Set Up
Notes On Session
# GE Aerospace Stock Quote
- Double Formation
* (Consolidation Argument)) | Complete Reversal Area
* ABC Flat Feature | Continuation Entry | Subdivision 1
- Triple Formation
* Pattern Reversal | Uptrend Bias & Entry | Subdivision 2
* Numbered Retracement | Long Entry & Supported Survey
* Daily Time Frame | Trend Settings Condition | Subdivision 3
Active Sessions On Relevant Range & Elemented Probabilities;
European Session(Upwards) - US-Session(Downwards) - Asian Session(Ranging)
Conclusion | Trade Plan Execution & Risk Management On Demand;
Overall Consensus | Buy

Rush Street Interactive Stock Quote | Chart & Forecast SummaryKey Indicators On Trade Set Up In General
1. Push Set Up
2. Range Set up
3. Break & Retest Set Up
Notes On Session
# Rush Street Interactive, Inc. Stock Quote
- Double Formation
* (Uptrend Argument)) At 7.50 USD | Subdivision 1
* 012345 Wave Count | Entry Feature Survey
- Triple Formation
* ABC Flat Wave Continuation | Subdivision 2
* Numbered Retracement | Uptrend Bias | Subdivision 3
* Daily Time Frame | Trend Settings Condition
Active Sessions On Relevant Range & Elemented Probabilities;
European Session(Upwards) - US-Session(Downwards) - Asian Session(Ranging)
Conclusion | Trade Plan Execution & Risk Management On Demand;
Overall Consensus | Buy

US30 Bearish M-Pattern Setup for Next Week Overview: Potential M-Pattern (Double Top) Formation
Analyzing the US30 4H chart, we might see a bearish M-pattern develop next week.
Here’s why:
🔹 Price Action: Rejection near the 0.786 - 0.886 Fibonacci zone suggests a potential reversal.
🔹 Bollinger Bands 📊: Price hit the upper band and is contracting, signaling a potential downside move.
🔹 RSI 📉: Falling from overbought and heading toward 40, confirming bearish momentum.
🔹 MACD ⚡: Bearish crossover happening, with the histogram turning red—momentum is shifting down.
🔹 Fundamental Catalyst: Next week’s economic events:
CPI Data (Tuesday) 🏦
Retail Sales (Thursday) 🛍️
Unemployment Claims (Thursday) 📊If inflation remains high, the Fed could maintain a hawkish stance, further weighing on US30.
🔥 Bearish Trade Plan 🔥
🔢 Entry Zone: 44,600 - 44,750 (Watch for rejection)
🔢 Confirmation:
✅ Bearish engulfing candle 🔥
✅ RSI below 50
✅ MACD maintaining bearish momentum🎯 Take Profit Levels:
TP1: 44,350 (0.618 Fib Level)
TP2: 43,950 (0.5 Fib Level)
TP3: 43,075 (0.382 Fib Level - Strong Demand Zone)
🚨 Stop Loss: Above 44,900 to protect against false breakouts ⚠
💸 Risk-Reward: Aim for 1:2 or better
Final Thoughts 🤔
If the M-pattern plays out, expect a bearish move next week. However, CPI data will be a key factor—stay flexible and manage risk!
🚀 Trade smart & stay disciplined! 🚀
Do not risk more than 1% of your account.
Comment your thoughts and follow for more cool ideas
Regards,
Nozuk
#US30 #Trading #PriceAction #TechnicalAnalysis #Forex #Indices #Nozuk

UNIUSDT: A Massive Bullish Move Loading… or a Trap?Yello, Paradisers! Is UNIUSDT finally gearing up for a major breakout, or is this just another fake move before a deeper correction? Let’s break it down.
💎UNIUSDT is currently trading within a descending channel, increasing the probability of an upcoming bullish move. The key support zone is holding strong, and we might be witnessing the early signs of a double-bottom formation—a classic reversal pattern.
💎However, confirmation is everything in trading. To increase the probability in our favor, we need to see: Bullish divergence, Bullish I-CHoCH (Internal Change of Character), Bullish reversal patterns such as a W-pattern or inverse head and shoulders from our support zone.
💎If UNIUSDT retraces further, we expect a bounce from the strong support zone—but again, we must wait for clear bullish confirmations before taking any positions.
💎The invalidation level? If price breaks and closes candle below the strong support zone, the entire bullish setup gets invalidated. In that case, we wait patiently for better price action before considering any new trades.
🎖Patience and discipline are key, Paradisers. Many traders will get trapped in bad positions, but those who wait for the right confirmations will be the ones making money. Trade smart & stick to high-probability setups only.
MyCryptoParadise
iFeel the success🌴

Selling SPY after signs of lost of momentumSPY has once again tested the ATH level, marking its third approach to this price zone and, once again, making a reversal candle. It feels like the market may be losing momentum, so I’ve decided to set up a bear put spread trade that would benefit from a potential decline within the next 42 days. All information is available on the chart.


NATGATE - 11 RECORD SESSION LOWS ?NATGATE - CURRENT PRICE : RM1.79
On 02 August 2024, the stock made a FALLING WINDOW . The selling pressure continues until price starts to stabilize and create a double bottom support level near RM1.65 - 1.68.
On 29 October 2024, the share price closes above the top of FALLING WINDOW resistance level indicates strong bullish momentum. At the same time, the share price also successfully closed above ICHIMOKU CLOUD (after trading below KUMO almost 3 months). This two scenario gives strong bullish outlook for NATGATE. From here, the stock continue moving upside until RM3.03 (ALL TIME HIGH) - upside movement of 40% from the breakout point on 29 OCTOBER 2024.
After reach ALL TIME HIGH, the stock made an EVENING STAR pattern. From there, the stock starts declining and makes 11 RECORD SESSION LOWS.
Here is the important points to have a look. We can expect a rebound from current price as there are some hints given by chart :
1) 11 RECORD SESSION LOWS creates an OVERSOLD situation (The record session topic is discussed by STEVE NISON in his book - BEYOND CANDLESTICK , PAGE 121 - 127)
2) The last two session was bullish HAMMER - the long lower shadows give hint that potential bottom had reached and the bears are getting tired.
3) Price bounce from the previous DOUBLE BOTTOM support level area near RM1.65 - RM1.68 indicates that the BULLS are aggresively buying the shares near the support level.
In conclusion, as a aggresive trader, this is an oppurtunity for me to buy the stock at price RM1.79 - RM1.81. If as expected the share price starts rebound higher, i would take my profit at RM1.95 (+8%) and RM2.05 (+14%). My support level will be RM1.68 (the low of bullish hammer). My time frame for trading this stock is only one month.
ENTRY PRICE : RM1.79 - RM1.81
TARGET PRICE : RM1.95 , RM2.05
STOP LOSS : RM1.68
TIME FRAME - Not more than ONE MONTH
TAYOR !

EURCAD - Bearish Double TOPHello Traders !
The EURCAD price formed a double top pattern.
Currently, The neckline is broken !
So, I expect a bearish move📉
______________
TARGET: 1.47880🎯

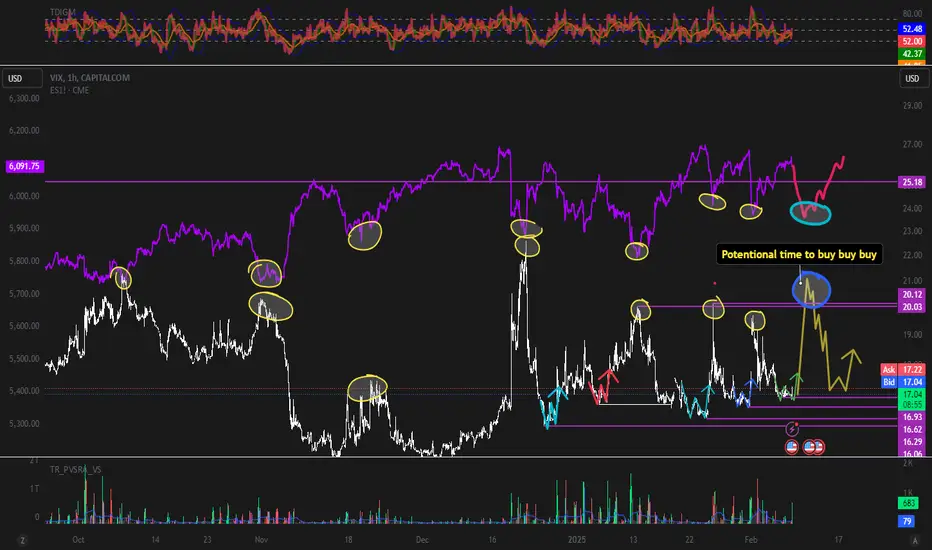
VIX & SXP There is some W on actual lows in VIX , so if it will play out ...It will be next higher low on VIX. It could lead in to higher high. Time will show how markets react on today employment data .I think it was little bit pro inflation with can lead in to stronger DXY situation ...