Ethereum (ETH): A Break Above $4,200 Seems Within ReachHello everyone,
Ethereum continues to show strong momentum, maintaining a steady rise from around $4,050 to nearly $4,183. The ongoing bullish structure signals that buyers remain firmly in control in the short term. On the chart, the Fair Value Gap (FVG) between $4,040–$4,070 is acting as a key support, while the $4,150–$4,170 zone stands as the major resistance that ETH must clear to open the path toward higher levels.
On the news front, investor sentiment toward Ethereum remains positive. Ongoing progress in Ethereum 2.0 and the broader DeFi ecosystem continues to reinforce long-term confidence in the platform. The consistent growth in staking inflows suggests that investors prefer holding ETH rather than taking profits early. However, macroeconomic headwinds — including the Fed’s tight monetary stance and the strong US dollar — could trigger short-term pullbacks if market sentiment weakens.
Technically, a decisive breakout above $4,150 could pave the way for a run toward $4,200, or even $4,300 in the near term. Conversely, failure at this resistance may push ETH back to retest the $4,040–$4,070 support zone before regaining upward momentum. Losing that level would likely activate a deeper correction toward $3,900.
What do you think — how long can ETH sustain this bullish energy?
ETHUSDT
ETHUSDTHello Traders! 👋
What are your thoughts on Ethereum?
Ethereum is currently trading between two major zones of support and resistance.
In this range, we expect a short-term correction toward the ascending trendline, followed by some consolidation before a potential breakout above the resistance zone.
If the support holds, followed by a positive reaction from the trendline and a breakout above the resistance level, Ethereum is expected to begin a new bullish wave and move higher toward the identified target levels.
If a daily candle closes below $3,500, this bullish scenario will be invalidated and a deeper correction could follow.
Don’t forget to like and share your thoughts in the comments! ❤️

ETH Bulls Defending $4000. Can They Spark the Next Rally?After breaking out from a major resistance, BINANCE:ETHUSDT delivered a clean and healthy retest, just as expected. The bounce from that level showed strong buyer confidence, confirming that bulls are still in control.
Currently, Ethereum is holding a crucial support zone around the $4000 range. This level will play a key role in determining the next big move. If CRYPTOCAP:ETH manages to sustain and bounce from here, we could see the price rallying towards the $7000–$8000 zone in the coming weeks.
However, traders should stay cautious, a drop below $3500 could signal further downside and a deeper correction. As always, risk management is key in every setup.
Watch the $4000 zone closely, the next CITYINDEX:ETHUSD wave could be massive!
Follow Our Tradingview Account for More Technical Analysis Updates, | Like, Share and Comment Your thoughts
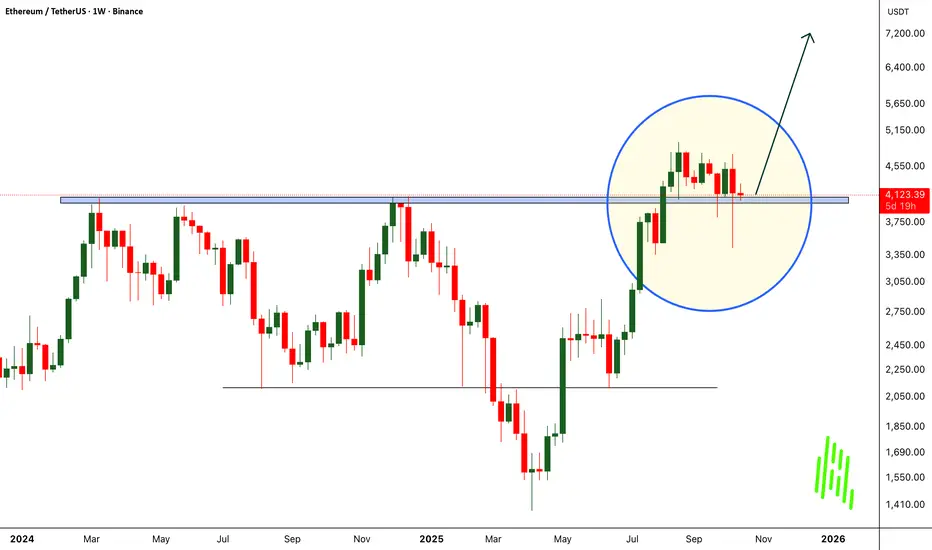
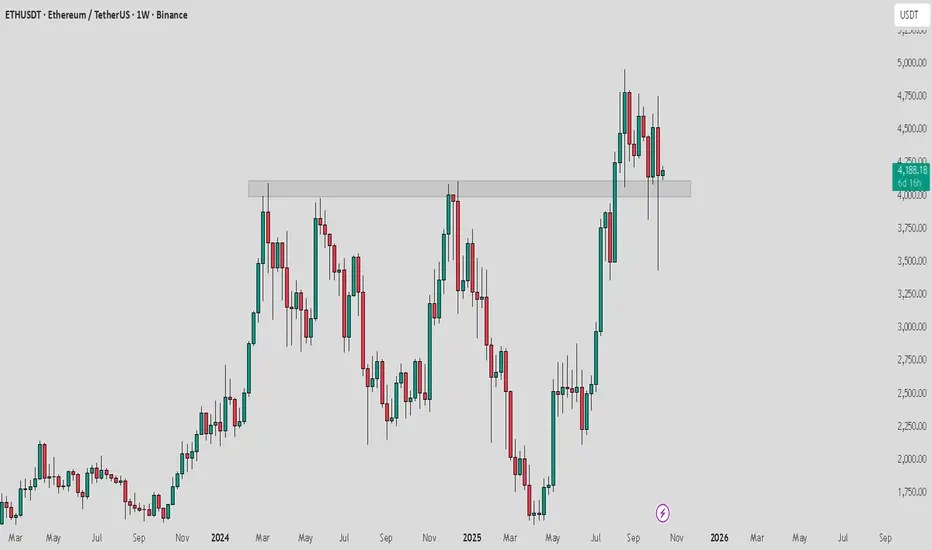
Zoom out $ETH Ethereum is currently retesting the same area after breaking its major falling that has been ongoing since 2021.
The area that was previously resistance is now a strong demand zone.
The pullback in the short term is not a cause for panic, but rather a healthy retest in the bigger picture.
The trend remains upward, and staying above the demand zone will mark the beginning of Ethereum's next major run.

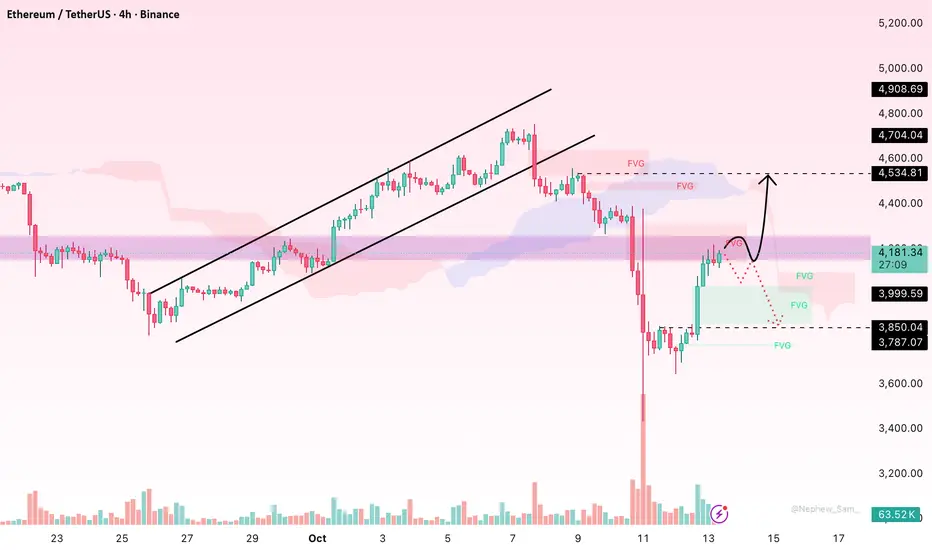
ETH Looks Bearish (12H)It seems that Ethereum has completed a large bearish triangle, with the first move already played out.
A pullback to the supply zone | marked in red | has now occurred.
The price is expected to eventually reach the green zone, accompanied by some fluctuations along the way.
The main target is the green zone.
A daily candle closing above the invalidation level will invalidate this analysis.
For risk management, please don't forget stop loss and capital management
When we reach the first target, save some profit and then change the stop to entry
Comment if you have any questions
Thank You

Ethereum fighting to make a comebackETH is the signal, the way forward, the only thing that could indicate a rotation of capital. The current data provided on the chart suggests that ETH is still fighting to reclaim previous price action. Cup and handle, bull flag, whatever the thesis, just be prepared.
ETH/USDT — Critical Retest at 3950–3520 Before Next Major Move?Ethereum has once again faced strong rejection from the key supply zone between 4,940–5,272 (Fib 0.5–0.618), signaling heavy selling pressure at this multi-year resistance area.
Price action now points toward a potential retracement into the major demand zone (yellow block) between 3,950–3,520, where the next directional move is likely to be decided.
---
📊 Key Technical Structure
Major Supply Zone: 4,940 – 5,272 (Fib 0.5–0.618)
Minor Support: 4,120
Primary Demand Zone (Yellow Block): 3,950 – 3,520
Next Supports (if broken): 3,210 → 2,132
Bullish Fibonacci Targets: 6,345 → 8,082 → 10,891
---
📈 Bullish Scenario — “Reclaim & Expansion”
ETH still maintains a macro structure of higher-highs and higher-lows on the weekly timeframe.
As long as the 3,520 support holds, the broader trend remains bullish.
A strong rebound from 3,950–3,520 followed by a weekly close above 5,272 would confirm bullish continuation and open up:
Target 1: 6,345 (Fib 1.0)
Target 2: 8,082 (Fib 1.618)
Target 3: 10,891 (Fib 2.618 — potential cycle top)**
The key confirmation for bulls is a weekly reclaim above 5,272 with volume.
---
📉 Bearish Scenario — “Breakdown & Deeper Retracement”
If the selling pressure continues and ETH closes below 3,520, the bullish structure will be invalidated.
Such a breakdown could trigger a deeper retracement toward:
3,210 (Fib 0.618 confluence)
2,132–1,955 (deeper structural retracement)
Failure to defend the yellow block would shift ETH into a lower-high / lower-low structure, signaling a medium-term trend reversal.
---
🔍 Market Context
ETH is currently retesting the same macro resistance zone that marked the all-time high area in 2021.
The rejection at 5K highlights that supply remains dominant in this region, while the 3,950–3,520 demand block now serves as the key battlefield for bulls and bears.
As long as the yellow block holds, this pullback can still be considered a healthy correction within a macro uptrend.
But if it breaks, the market may enter a prolonged consolidation phase before the next cycle begins.
---
📍 Summary
Ethereum stands at a major inflection point:
Bullish Case: Bounce from 3,950–3,520 and reclaim 5,272 → targets 6.3K – 8K – 10.8K
Bearish Case: Breakdown below 3,520 → deeper correction to 3.21K or even 2.13K
The 3,950–3,520 demand zone is the final defense for ETH’s mid-term bullish structure — hold it, and the trend continues; lose it, and momentum fades.
---
#Ethereum #ETHUSDT #Crypto #TechnicalAnalysis #Fibonacci #PriceAction #CryptoMarket #WeeklyChart #ETHAnalysis #MarketStructure

$ETH Channel Test – Bullish Bounce or Deeper Dip Ahead?BINANCE:ETHUSDT
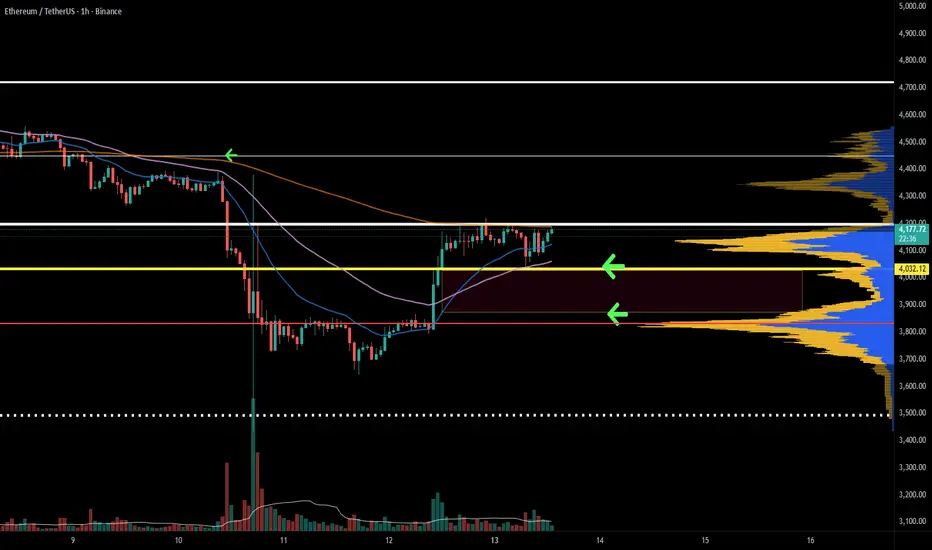
ETHUSDT 1H: Channel Test – Bullish Bounce or Deeper Dip Ahead? 📊🚀
Hey traders! On this 1H ETHUSDT chart from Binance, we're seeing a classic descending channel squeeze with price hugging the lower support boundary around $4,040–$4,070 after a sharp V-shaped rebound from $3,500 lows. The orange trendline resistance at ~$4,150–$4,170 is capping upside for now, but higher lows signal accumulation and potential reversal vibes.
My take: Strong chance it holds the key support here – no major breakdown yet, fueled by that bullish momentum bounce. Breakout above $4,170 could ignite a quick rally, but watch for rejection risking a dip to $3,800 if volume fades. Overall bias? Mildly bullish if we close green above channel midline.
Target: Short-term upside to $4,500 on breakout; downside stop at $3,950.
Indicators I'm eyeing: RSI bouncing off 40 (not oversold), MACD histogram flipping positive, and rising volume on greens for confirmation. Stay nimble! 💥
#ETHUSDT #CryptoAnalysis #TradingView

ETH 15M Analysis - Key Triggers Ahead | Day 33☃️ Welcome to the cryptos winter , I hope you’ve started your day well.
⏰ We’re analyzing ETH on the 15-Minutes timeframe .
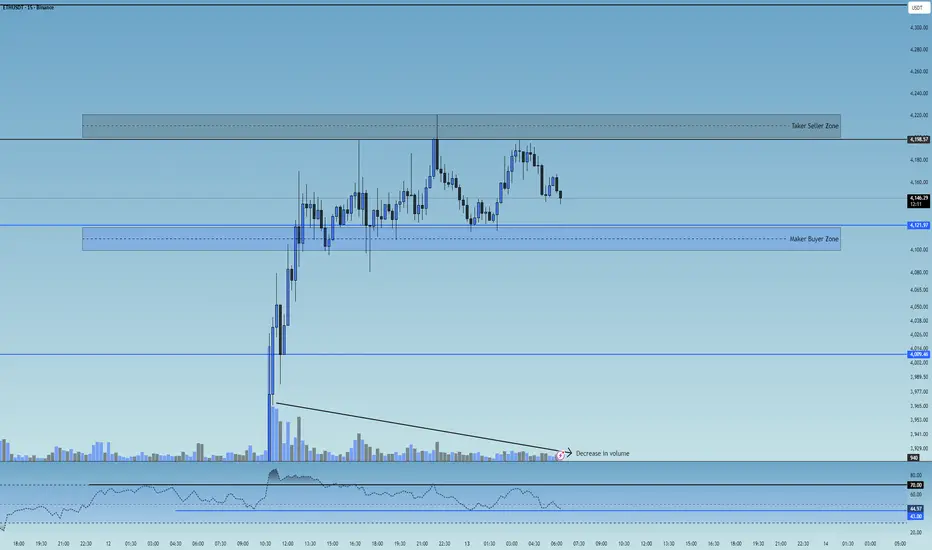
👀 On the 15-minute timeframe for Ethereum, we can see that after an impressive 10% rally, ETH showed one of the strongest recoveries in the market compared to other major coins — managing to climb above $4,100 and form a new trading range early in the week. Currently, Ethereum is consolidating within a range between $4,200 (top) and $4,121 (bottom). A breakout from this range could create either a long or short setup. Keep in mind that following this strong bullish move, trading volume has started to decline inside this range.
🧮 Looking at the RSI oscillator, we can see that after the recent surge, ETH’s momentum is now fluctuating between 43 and 70. A breakout above or below this RSI range would likely increase volatility and accelerate Ethereum’s next move — potentially with fewer candles but stronger momentum.
🕯 The size and volume of recent candles during Ethereum’s rally have been exceptional. Major buyers and institutional players have added substantial ETH positions to their portfolios. The large, high-volume bullish candles leading up to the current range reflect Ethereum’s strong momentum. Now, while the price is oscillating inside the range with reduced volume, a clear volume expansion is expected once the range breaks.
🧠 As Ethereum remains trapped inside this trading range, a breakout will require increased volume and RSI confirmation beyond the defined thresholds. This setup gives us two potential scenarios:
↗️ Long scenario: If Ethereum breaks above $4,200, which acts as a taker-seller resistance, and RSI pushes above 70 (Overbought zone), ETH could launch another bullish leg early in the week — showing an even stronger recovery compared to the rest of the market.
📉 Short scenario: If Ethereum breaks below $4,121, which is a maker-buyer support, and RSI drops under 43 toward the Oversold zone, it could continue its downward correction. However, given ETH’s strong bullish momentum, this bearish scenario would likely require negative market fundamentals to fully play out.
❤️ Disclaimer : This analysis is purely based on my personal opinion and I only trade if the stated triggers are activated .
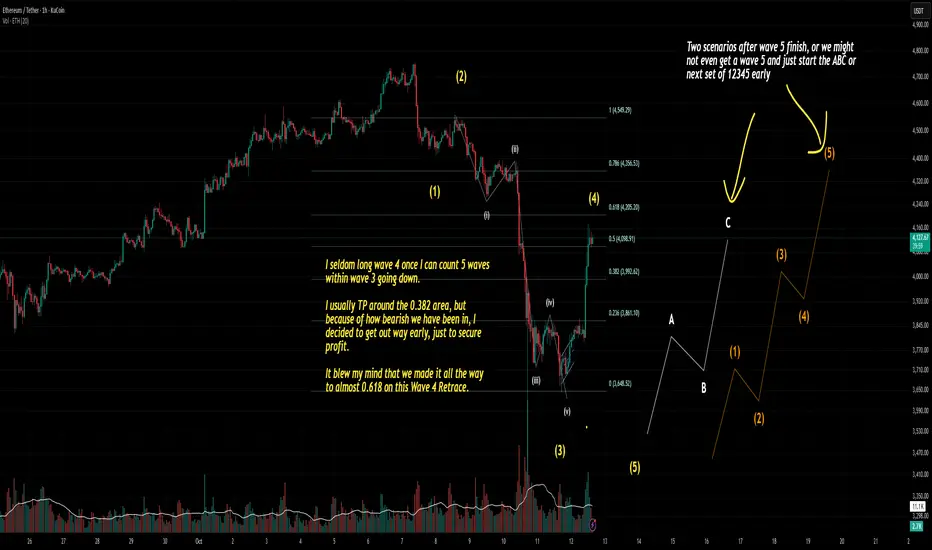
ETH (My thoughts after TP on my long position)I’m still an Elliott Wave noob, so the drawing on my chart is purely theoretical. It’s based on personal speculation — not financial advice.
Right now, I’m working under the assumption that we’re either in a corrective Wave A heading down, or in Wave 2 of a larger structure on a higher timeframe.
Last night, I counted five waves down within Wave 3 and started to notice signs of support. So instead of riding it out for a retrace back to the usual 0.382 Fib, I decided to long Wave 4 early and took profit once it hit an amount I was comfortable with.
Given how sharp the recent drop was, I was worried this might be one of those weak sub-Wave 4 retracements. I honestly doubted we’d even make it to 0.382, and even if we did, I expected it to take another 12–24 hours.
This morning, ETH shot up another $200 to $4000 right after I TP’d. I won’t lie — I definitely felt some ROMO (regret of missing out). An hour later, I checked again and saw it nearly tagged the 0.618 Fib. I was shocked at how fast it recovered.
But I reminded myself: don’t FOMO in and end up stuck in a long while Wave 5 is setting up to go down. I’ve learned that less profit is better than no profit. So I’m sticking to my plan and moving on.
My outlook from here:
I’m expecting Wave 5 to start between now and the London session open. Then, during the U.S. session, we might see another impulsive 1-2-3-4-5 leg up or begin corrective Wave B (if we really are in corrective Wave A down).
Good luck, everyone. Stay disciplined and trade your plan.
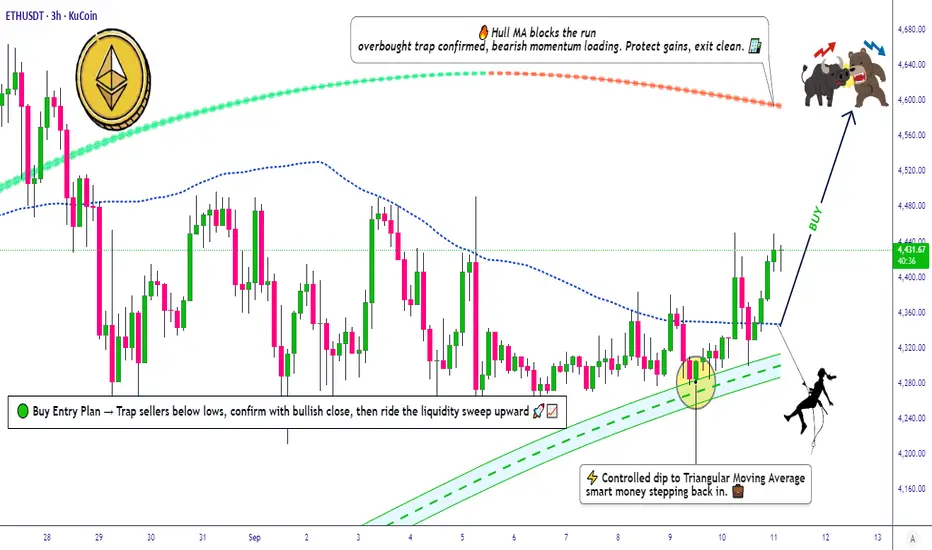
ETH/USDT Technical Roadmap | Bullish Swing & Day Trade Levels📌 ETH/USDT "Ethereum vs Tether" Crypto Market Plan (Swing/Day Trade)
🔹 Plan: Bullish (Pending Order Breakout Plan)
We are preparing for a breakout setup around 10.000⚡ TRIANGULAR MOVING AVERAGE BUY PLAN.
Price action shows strong buyer strength with signs of institutional accumulation on dips.
🛠️ Thief Strategy (Layered Entry Style)
This strategy uses multiple limit orders (layering method) after breakout confirmation.
✅ Example buy limit layers (can be adjusted to your own risk):
4350
4370
4390
4420
👉 Please set a TradingView alert near the breakout level so you don’t miss confirmation.
🛑 Stop Loss (Risk Management)
📍 Suggested risk level: 4300 (after breakout confirmation)
This is the Thief SL reference point, but remember:
Adjust your SL based on your personal risk tolerance & strategy.
🎯 Target (Profit Zone)
Price may face resistance near moving averages with possible overbought traps.
📍 Planned exit zone: 4600
Manage your own TP — use targets that fit your risk/reward ratio.
🔗 Related Pairs to Watch
BINANCE:BTCUSDT – Bitcoin breakout strength often leads ETH moves.
BINANCE:ETHBTC – Key ratio showing ETH’s relative strength vs BTC.
BINANCE:SOLUSDT – High-beta crypto that often correlates with ETH sentiment.
BINANCE:BNBUSDT – Another major altcoin for cross-market momentum comparison.
✨ “If you find value in my analysis, a 👍 and 🚀 boost is much appreciated — it helps me share more setups with the community!”
#ETH #ETHUSDT #Ethereum #Crypto #SwingTrade #DayTrade #BreakoutStrategy #LayeredEntries #CryptoTrading #TradingPlan
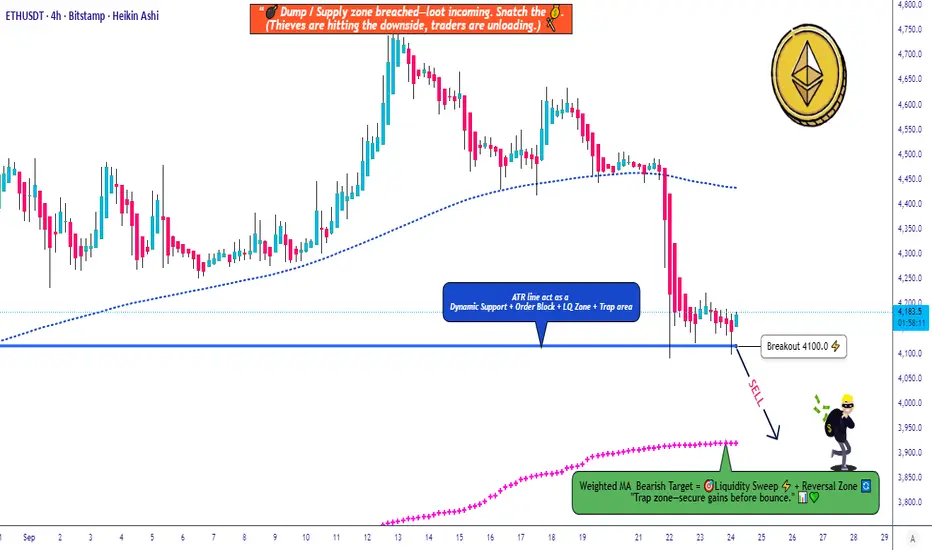
ETH/USDT Drop Plan Layered Entries + Smart EscapeETH/USDT 🚀 Market Wealth Strategy Map (Swing/Day Trade)
Market Outlook:
🔻 Bearish Confirmation: Watch for candle breakouts below the ATR Line @ 4100. This signals sellers gaining control — perfect for short entries.
Entry Plan (Thief Style 🕵️♂️):
💡 Multiple layered entries using limit orders (Thief layering strategy):
Sell layers: 4250 | 4200 | 4150 (adjust layers as per your own preference)
⚠️ Important: Set layer limit orders only after breakout confirmation. Do not enter blindly.
Stop Loss (SL):
⛔ Thief SL: 4300
Note: Dear Ladies & Gentlemen (Thief OG’s), SL is your choice — manage your risk and profits at your own discretion.
Target (TP):
🎯 Target: Weighted Moving Average Line (~3900) — strong support, oversold signals, and trap potential. Escape with profits before market catches you.
Note: TP is also your choice, manage money at your own discretion.
Related Pairs to Watch 🔗:
BINANCE:BTCUSDT : Correlated short setups, watch BTC for confirmation.
BINANCE:ETHBTC : Relative weakness/strength check vs Bitcoin.
BINANCE:BNBUSDT : Can provide additional trend confirmation in altcoin moves.
Key Points / Correlations:
ETH closely follows BTC sentiment; if BTC tanks, ETH likely follows.
Layering strategy allows flexible entries, reducing risk exposure.
Oversold + WMA support often signals profit escape zones for smart exits.
✨ “If you find value in my analysis, a 👍 and 🚀 boost is much appreciated — it helps me share more setups with the community!”
Disclaimer: This is Thief style trading strategy, just for fun.
#ETHUSDT #Ethereum #CryptoTrading #SwingTrade #DayTrade #ThiefStrategy #CryptoAnalysis #CryptoLayering #TradingViewIdeas #CryptoSetup
$ETH the big picture is still in play.After breaking out of its long-standing downtrend, Ethereum is currently only retesting the demand zone and trend line.
This move is a healthy retest inherent in a bullish structure.
Fluctuations on short timeframes don't change direction; it's the longer timeframes that matter.
The macrotrend is still upward.
The bigger picture hasn't yet spoken.

Ethereum is looking strong to bounce back from supportETH is bouncing back from key support and still showing potential for a bullish rally towards $5,000 in the coming days.
Momentum looks constructive — manage risk wisely and monitor key levels closely.
mrmoney limited ETH/USD position trading ideaprice has approached our monthly key resistance level which made price to have a bearish turn we have a minor support zone which price reacted to and has recently givenen us bullish momentum

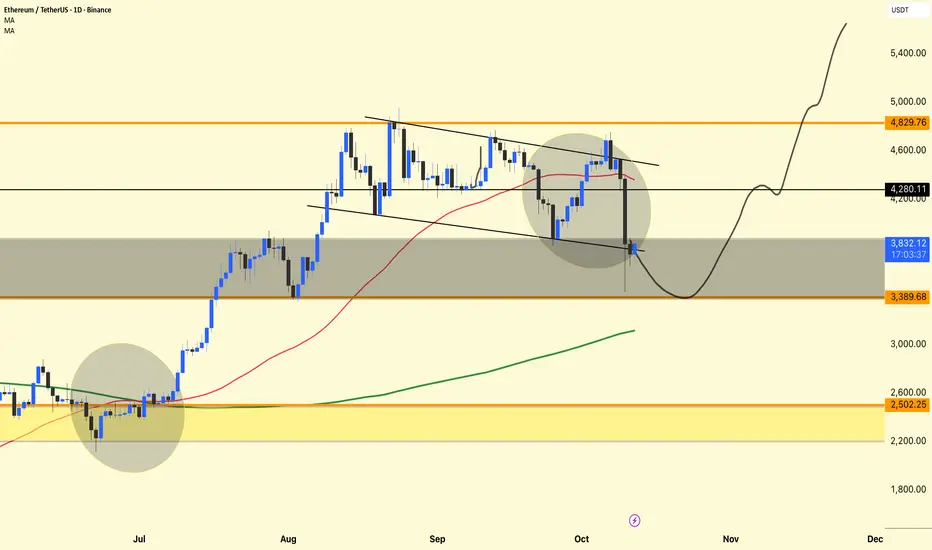
Ethereum (ETH/USDT) – Daily Chart Analysis !!!Ethereum (ETH/USDT)
Ethereum is moving at a similar pace to Bitcoin – showing heavy volatility and liquidation pressure, but there are also signs of accumulation near strong support.
The chart shows a return to a key demand zone after a breakout failure from a descending wedge, followed by the formation of a potential reversal structure.
Descending Channel and Breakdown
ETH had been moving within a descending channel for several weeks.
Recently, it attempted a breakout, but sellers regained control, resulting in a false breakout and a retest rejection.
The candle's sharp decline through the red moving average (around $4,300) indicates that bulls were heavily liquidated.
However, the price saw buying interest around the $3,800–$3,400 area, which aligns with the chart's gray support area.
Moving Average Insights
Red MA (50-day): Currently acting as dynamic resistance; ETH needs a clear close above it to confirm a short-term bullish recovery.
Green MA (200-day): Still trending upwards, indicating that the long-term structure remains bullish despite near-term weakness.
If the price stabilizes above the 200-day MA, it will likely attract medium-term investors.
Current Price Activity
At $3,836, ETH is testing the lower boundary of the support zone.
The chart projection (curved black line) suggests:
A possible short-term retest towards $3,380,
Followed by a gradual recovery towards $4,200,
And then a potential continuation towards $4,800+ if momentum strengthens.
This pattern resembles a "spring" setup—a common accumulation behavior before a major reversal.
DYOR | NFA
ETH/USD Bearish Retracement from Daily FVG Zonea bearish retracement setup on Ethereum (ETH/USDT) in the daily timeframe. After a strong bearish impulse, the price entered a highlighted Daily Fair Value Gap (FVG) zone — a potential area of supply where sellers may regain control. The projection indicates a likely short-term pullback into the FVG before continuing downward toward Target 1 (≈ $3,601) and Target 2 (≈ $3,399).

Ethereum ShortAs U.S. Treasury yields and the U.S. dollar continue to strengthen, The crypto market continues its selloff. I have outlined some key areas where bulls will start to nibble on longs. Shorts are still open for at least another 2% down.

$ETH Before the parabolic expansion.ETH is once again in a similar technical structure to that seen before its parabolic run in 2020.
As was the case then, the falling trend breakout and subsequent retest phase are now complete.
As seen previously, the RSI is still holding above the 50 level, clearly indicating that momentum continues in a positive direction.
The structure is clear in both linear and stick bar charts.
The trend has broken, the retest is happening, and Ethereum is on the verge of a major expansion movement.

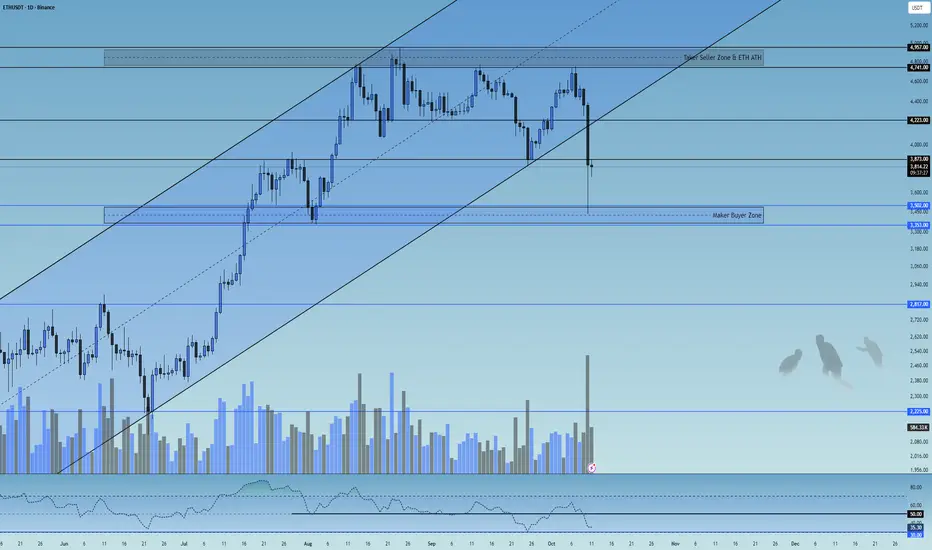
ETH 1D Analysis - Key Triggers Ahead | Day 32☃️ Welcome to the cryptos winter , I hope you’ve started your day well.
⏰ We’re analyzing ETH on the 1-Day timeframe .
👀 On the Ethereum daily timeframe, we can see that after the historic economic war between the U.S. and China, Ethereum broke its ascending channel with a high-volume whale candle and has now managed to stabilize below this channel. Currently, Ethereum is in a critical decision-making zone, with two key resistance levels at $3,873 and $4,223.
A break and confirmation above these zones, especially $4,223, could lead to a bullish continuation; otherwise, a breakdown below the channel support may trigger a deep correction and cause Ethereum to enter a risk-off phase on the higher timeframe (weekly).
🧮 Looking at the RSI oscillator, after crossing down from the 50 level, it is now heading toward the 30 and oversold region. These two zones — 50 and 30 — are our key RSI levels, and when volatility crosses these zones, it can be accompanied by a significant increase in trading volume.
🕯 The recent daily candle of Ethereum has shown a massive amount of sell volume, with an open around $4,400 and a close below $3,900 (ignoring the shadow). This indicates strong selling pressure — if buyers fail to hold Ethereum above $4,200, we could see further correction and selling pressure ahead.
🧠 Currently, there’s no specific trigger for Ethereum, but a trading range will likely form in this zone until the end of the week.
A break of either the top or bottom of this range across multiple timeframes could give us a potential long or short position.
❤️ Disclaimer : This analysis is purely based on my personal opinion and I only trade if the stated triggers are activated .
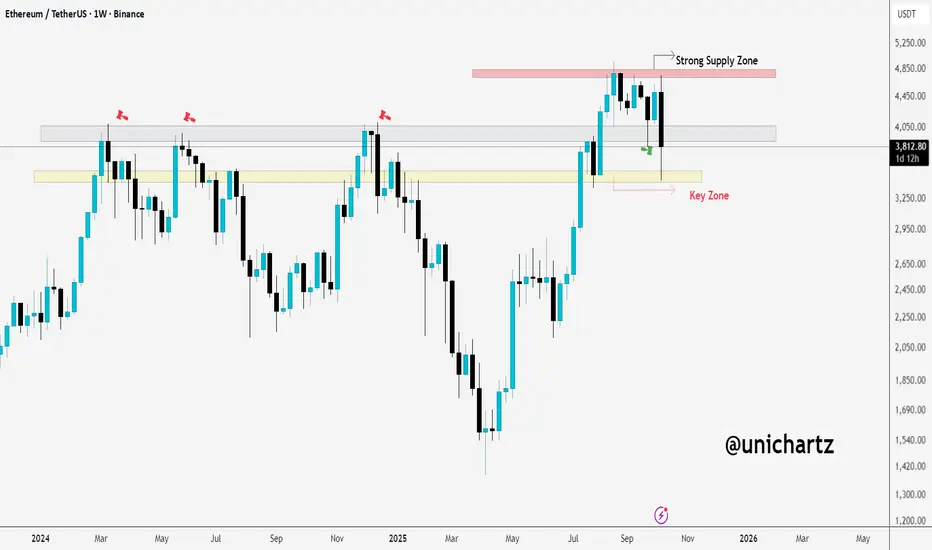
ETH in Danger: Breaking Below $3,200 Could Signal Bigger DropCRYPTOCAP:ETH is facing rejection from the strong supply zone around $4,800. The weekly candle failed to hold above that level and is now pulling back towards the key demand zone between $3,200–$3,300.
If the price fails to reclaim this support, we could see a more bearish scenario unfolding.
DYOR, NFA
Thanks for the reading
#ETH #ETHUSDT #ETHEREUM #Analysis #Update #Eddy#ETH #ETHUSDT #ETHEREUM #Analysis #Update #Eddy
According to the formed pattern, namely QM in the RTM style on the weekly block breaker, I expect an upward movement and a ceiling hunt and an ATH of Ethereum, and also in the ICT and liquidity styles, I expect a Fake BOS and a drop to the weekly block order to liquidate long positions and then continue the upward trend according to the analysis I did on the chart and the Path I drew. I expect the Ethereum currency to act accordingly.
So I expect an upward movement, a drop and a re-rise according to this analysis and explanation.
The important upper timeframe area for volatility has been identified and named.
These settings are based on a combination of different styles, including volume style with ict style and a combination of RTM and liquidity style.
Based on your strategy and style, get the necessary confirmations to enter the trade in these volatility settings.
Don't forget about risk and capital management.
The entry point, take profit point and stop loss point along with their values are indicated on the chart.
The responsibility for the transaction is yours and I am not responsible for any failure to comply with your risk management and capital.
🗒 Note: If, according to the analysis, the progress after the main rise begins, I expect the price of Ethereum to reach the targets of the latest analysis provided on Ethereum, which will be attached.
⚠️ Warning: Predicting market movements is a mistake and this analysis may be violated, so do not rush into your decisions and proceed to trade after obtaining the necessary confirmations. Market makers will always surprise us and predicting movements and future movements is a complex and difficult task.
Check out my previous analysis on Ethereum via the link below :

ETH/USDT Bearish Continuation from Supply Zonea bearish continuation setup on Ethereum (ETH/USDT) in the 4-hour timeframe. After a strong downward impulse, the price retraced into a highlighted supply zone, suggesting a potential rejection from this resistance area. The projection shows a likely continuation of the downtrend, targeting the 3,797.51 level, with a Stop Loss positioned above the recent swing high around 4,303.62.
