EURO - Price can drop to $1.0700, breaking support levelHi guys, this is my overview for EURUSD, feel free to check it and write your feedback in comments👊
Recently price started to trades inside a broadening wedge, where it at once bounced up from support level to resistance line.
Then Euro some time traded in a range, and then dropped to support line of wedge, breaking $1.0420 level.
After this, Euro turned around and made strong upward movement to resistance line of a broadening wedge.
Also, it broke $1.0420 level and soon exited from broadening wedge and broke $1.0770 level too.
Next, Euro continued to move up inside rising channel, where it rose from support level to resistance line.
Possibly, price can rise a little in a channel and then bounce down to $1.0700, breaking support level and exit from channel.
If this post is useful to you, you can support me with like/boost and advice in comments❤️
Euro

EUR/USD analysis – two Key Scenarioshello guys.
The EUR/USD pair has witnessed a strong bullish surge, breaking through key resistance levels. However, two possible scenarios emerge from this critical point:
🔴 First Scenario (Bullish Continuation):
Price could retrace to the 1.07-1.072 demand zone before resuming its upward trajectory.
If support holds, the pair may climb towards the 1.10-1.105 resistance zone, aligning with the upper boundary of the ascending channel.
🔵 Second Scenario (Bearish Reversal):
If bullish momentum fades, a deeper correction may follow, breaking below the key support zone.
This could lead the price toward the 1.04-1.043 area, marking a retest of previous lows and reinforcing bearish sentiment.
-------------------
Conclusion:
The current level serves as a critical decision point. If price sustains above support ($1.072-$1.068), bullish momentum may continue. However, a break below could signal a bearish correction, shifting market sentiment. Traders should watch key levels for confirmation of either scenario.

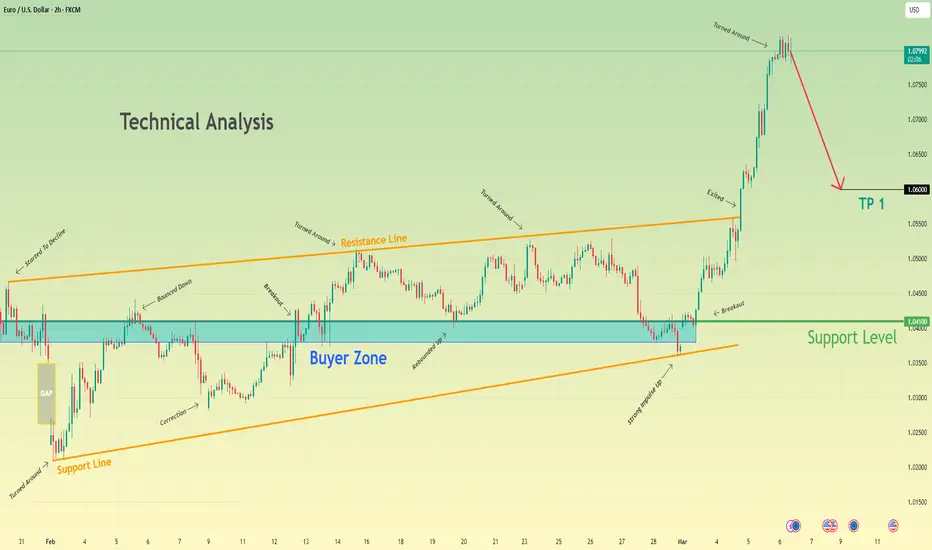
Euro can rebound up from support line to 1.1000 pointsHello traders, I want share with you my opinion about Euro. Looking at this chart, we can see that a few days ago, the price entered a range, where it immediately broke through the 1.0425 support level, which aligned with the buyer zone, and then moved to the upper part of the range. After trading near this area for some time, the price dropped back to the buyer zone, reaching the support line before starting to rise again. Soon, the Euro broke the 1.0425 level once more and later exited the range, continuing its upward movement. Not long after, the price climbed to the 1.0805 support level, which coincided with a support area. It traded around this level for a while before breaking through it as well. Following that, the Euro reached the resistance line, reversed, and corrected back to the support area, where it found support again. Recently, it rebounded and started moving upward. Given this, I expect a further rebound from the support line and a breakout above the resistance line. Based on this scenario, my TP is set at 1.1000 points Please share this idea with your friends and click Boost 🚀

EURUSD’s Pullback in Play: Next Stop $1.0934?The EURUSD ( FX:EURUSD ) has managed to break through the Resistance zone($1.0817-$1.0760) and has been on a good upward trend with good momentum in the past week.
The EURUSD appears to be completing a pullback to the Resistance zone (broken) .
According to the Elliott Wave theory , the EURUSD appears to have completed wave 4 , which is a Double Three Correction(WXY) .
I expect EURUSD to rise to the Resistance zone($1.0983-$1.0916) after completing the pullbac k.
Note: If EURUSD goes below $1.0755, we can expect more dumps.
Please respect each other's ideas and express them politely if you agree or disagree.
Euro/U.S. Dollar Analyze (EURUSD), 1-hour time frame.
Be sure to follow the updated ideas.
Do not forget to put a Stop loss for your positions (For every position you want to open).
Please follow your strategy and updates; this is just my Idea, and I will gladly see your ideas in this post.
Please do not forget the ✅' like '✅ button 🙏😊 & Share it with your friends; thanks, and Trade safe.

HelenP. I Euro may rise a little and then start to fallHi folks today I'm prepared for you Euro analytics. Looking at this chart, we can see how the price entered a wedge formation and immediately dropped to the trend line, breaking Support 2. The Euro also made a sharp gap down but soon reversed and started to climb from the trend line within the wedge. Shortly after, the price reached Support 2, which aligned with the support zone, and broke through it. Following this, it continued to rise, reaching the wedge’s resistance line before reversing and making a correction. Later, it returned to the trend line, broke below it, and exited the wedge, falling back to Support 2. For some time, the price traded near this level before making a strong upward impulse, breaking above the trend line, and eventually reaching 1.0770 (Support 1), which also coincided with the support zone. Soon after, the price broke through this level as well and started consolidating around it. Recently, the Euro has continued to push higher. However, in this scenario, I expect EURUSD to rise slightly before dropping below the support level, breaking it. With that in mind, my goal is set at 1.0700. If you like my analytics you may support me with your like/comment ❤️

EURUSD on its 1W MA200 after 5 months.The EURUSD pair hit on Friday its 1W MA200 (orange trend-line) for the first time in 5 months (since October 03 2024). This is a major Resistance level which initiated a strong -4.00% decline on December 28 2023.
In fact -4.00% declines have been quite common for EURUSD in the past 2 years. However, the pair's strongest Resistance level has been the 1M MA100 (red trend-line) which has formed both market tops on October 01 2024 and July 18 2023.
As a result, the most optimal sell entry would be when the 1W RSI hits its Resistance Zone, with the price probably close to the 1M MA100 within the Lower Highs Zone. On the long-term, the R/R has shifted dramatically in favor of selling right now. If the rejection does happen on the 1W MA200 eventually and won't close any 1W candle above it, we have a short-term Target at 1.04600 (-4.00% decline) and if the rejection takes place higher, we will be expecting a bottom near parity with a technical Target at 1.00500 (Lower Lows Zone).
-------------------------------------------------------------------------------
** Please LIKE 👍, FOLLOW ✅, SHARE 🙌 and COMMENT ✍ if you enjoy this idea! Also share your ideas and charts in the comments section below! This is best way to keep it relevant, support us, keep the content here free and allow the idea to reach as many people as possible. **
-------------------------------------------------------------------------------
Disclosure: I am part of Trade Nation's Influencer program and receive a monthly fee for using their TradingView charts in my analysis.
💸💸💸💸💸💸
👇 👇 👇 👇 👇 👇

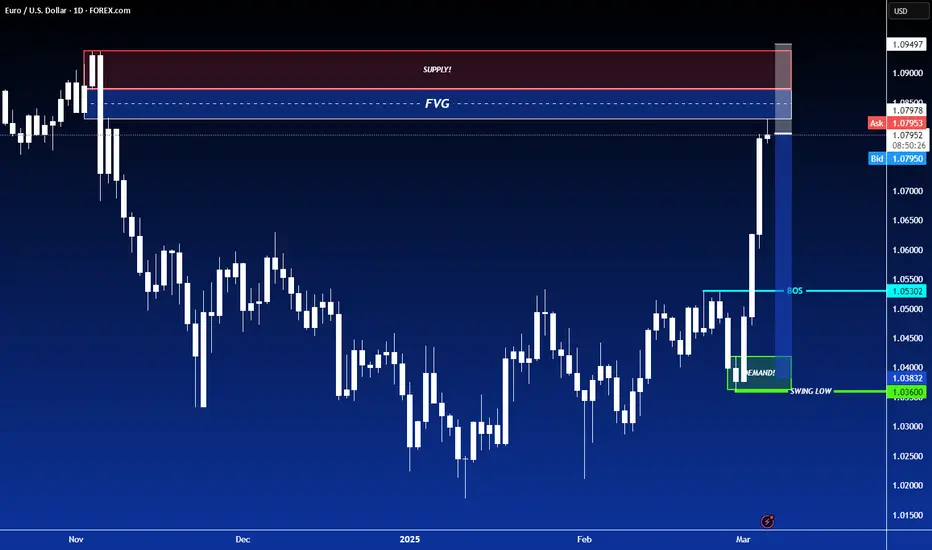
EURUSD Weekly FOREX Forecast: March 10 - 14thIn this video, we will analyze EURUSD and EUR Futures. We'll determine the bias for the upcoming week, and look for the best potential setups.
While the USD is bearish, the EUR is finding strength to the upside. This is noted in the very strong Friday candle. Meh NFP numbers, tariffs and trade wars are pulling the USD down, allowing the EUR and the other majors to move higher.
Look for a retracement to the +FVG in the beginning of the week. This could potentially set up the higher probability buy setup that potentially forms there.
Enjoy!
May profits be upon you.
Leave any questions or comments in the comment section.
I appreciate any feedback from my viewers!
Like and/or subscribe if you want more accurate analysis.
Thank you so much!
Disclaimer:
I do not provide personal investment advice and I am not a qualified licensed investment advisor.
All information found here, including any ideas, opinions, views, predictions, forecasts, commentaries, suggestions, expressed or implied herein, are for informational, entertainment or educational purposes only and should not be construed as personal investment advice. While the information provided is believed to be accurate, it may include errors or inaccuracies.
I will not and cannot be held liable for any actions you take as a result of anything you read here.
Conduct your own due diligence, or consult a licensed financial advisor or broker before making any and all investment decisions. Any investments, trades, speculations, or decisions made on the basis of any information found on this channel, expressed or implied herein, are committed at your own risk, financial or otherwise.

After strong impulse up, Euro makes correction to 1.0600 pointsHello traders, I want share with you my opinion about Euro. Looking at the chart, we can see that the price entered a wedge formation and immediately started to decline. The Euro broke through the 1.0410 level, creating a strong gap before reaching the wedge's support line and beginning to rise. In a short time, it climbed back to the support level and attempted to break it but failed, pulling back slightly. After that, the Euro returned to the 1.0410 support level and finally managed to break through. Following this move, it reached the resistance line of the wedge and made a correction down to the support level. Then, the Euro pushed back up to the resistance line, consolidating near it for a while before dropping to the buyer zone, where it later touched the wedge’s support line again. From there, it made a strong upward impulse, breaking the 1.0410 level once more, exiting the wedge, and surging to 1.0820. However, more recently, the price reversed and started to decline. I believe the Euro may enter a corrective phase after such a strong upward move. Based on this, my TP is set at 1.0600 points. Please share this idea with your friends and click Boost 🚀
EUR/UDS D1 | Heading into swing-high resistanceThe Euro (EUR/USD) is rising towards a swing-high resistance and could potentially reverse off this level to drop lower.
Sell entry is at 1.0929 which is a swing-high resistance.
Stop loss is at 1.1031 which is a level that sits above the 78.6% Fibonacci retracement and a pullback resistance.
Take profit is at 1.0728 which is a pullback support.
High Risk Investment Warning
Trading Forex/CFDs on margin carries a high level of risk and may not be suitable for all investors. Leverage can work against you.
Stratos Markets Limited (www.fxcm.com):
CFDs are complex instruments and come with a high risk of losing money rapidly due to leverage. 63% of retail investor accounts lose money when trading CFDs with this provider. You should consider whether you understand how CFDs work and whether you can afford to take the high risk of losing your money.
Stratos Europe Ltd (www.fxcm.com):
CFDs are complex instruments and come with a high risk of losing money rapidly due to leverage. 63% of retail investor accounts lose money when trading CFDs with this provider. You should consider whether you understand how CFDs work and whether you can afford to take the high risk of losing your money.
Stratos Trading Pty. Limited (www.fxcm.com):
Trading FX/CFDs carries significant risks. FXCM AU (AFSL 309763), please read the Financial Services Guide, Product Disclosure Statement, Target Market Determination and Terms of Business at www.fxcm.com
Stratos Global LLC (www.fxcm.com):
Losses can exceed deposits.
Please be advised that the information presented on TradingView is provided to FXCM (‘Company’, ‘we’) by a third-party provider (‘TFA Global Pte Ltd’). Please be reminded that you are solely responsible for the trading decisions on your account. There is a very high degree of risk involved in trading. Any information and/or content is intended entirely for research, educational and informational purposes only and does not constitute investment or consultation advice or investment strategy. The information is not tailored to the investment needs of any specific person and therefore does not involve a consideration of any of the investment objectives, financial situation or needs of any viewer that may receive it. Kindly also note that past performance is not a reliable indicator of future results. Actual results may differ materially from those anticipated in forward-looking or past performance statements. We assume no liability as to the accuracy or completeness of any of the information and/or content provided herein and the Company cannot be held responsible for any omission, mistake nor for any loss or damage including without limitation to any loss of profit which may arise from reliance on any information supplied by TFA Global Pte Ltd.
The speaker(s) is neither an employee, agent nor representative of FXCM and is therefore acting independently. The opinions given are their own, constitute general market commentary, and do not constitute the opinion or advice of FXCM or any form of personal or investment advice. FXCM neither endorses nor guarantees offerings of third party speakers, nor is FXCM responsible for the content, veracity or opinions of third-party speakers, presenters or participants.

SHORT ON EUR/USDEUR/USD has Reached a Major Resistance Area/Zone and is highly over brought.
The Dollar (DXY) is inverted with the Eur/usd negatively. The dollar is highly oversold and should rise from its major Demand zone.
This should cause the Euro to Fall from its resistance zone.
Dollar has news at 8:30 for Unemployment claims. If the news is somehow good for the dollar and causes it to rise, the Euro will have the potential of reaching about 400 pips over the next few days.
I will be selling EUR/USD to the demand level shown.
Euro/Usd (Mar/06) for rest of the weekHello eveyone.
as you can see price at golden pocket (high to low).alos near cpr Monthly R3 .
I know it's scary to sell at thi moment but this is what i see in chart.
......................................
( This is an idea and entry-tp-sl placed for my own trade , you can change entry-tp-sl depends on your risk management )

EUROUSD 4H LONG (3 Targets DONE)Re-opening in the specified block after confirmation of the level of $1.03744 brings 3 targets for the position.
Considering the current formations on the 1D TF, the probability of price growth to the current maximum increases multiple times. Locally, I expect to see a price correction (a rollback next week) and preferably with a depiction of a bullish imbalance. After which, you can work long for a whole month until 1.12758

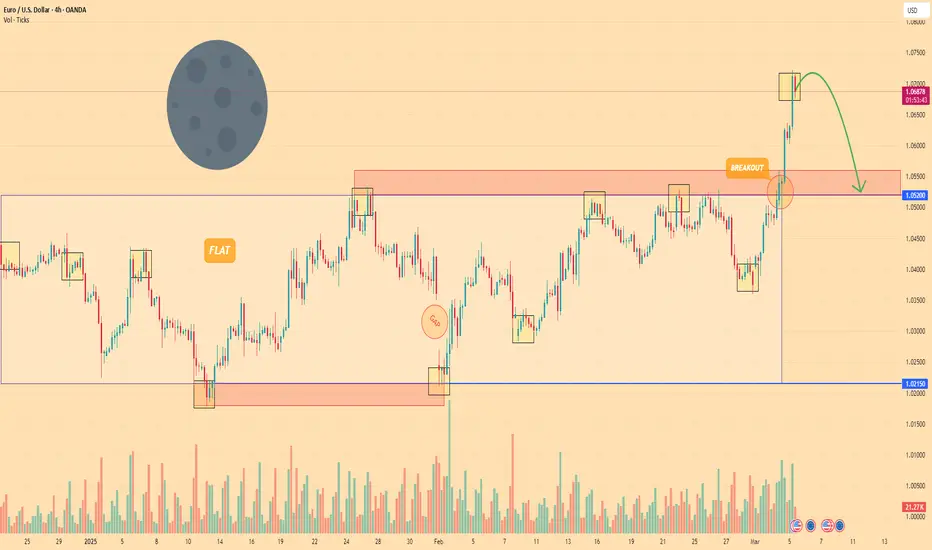
EURO - Price can make correction, after strong movement upHi guys, this is my overview for EURUSD, feel free to check it and write your feedback in comments👊
A few days ago price entered a flat, where it at once declined to support level, which coincided with support area.
The price entered this area and then started to grow, so EUR rose to $1.0520 points in a short time.
After this movement, Euro turned around and fell to $1.0215 support level again, making a strong gap.
Next, price turned around and in a short time rose to $1.0520 level and some time traded near it.
Later, price broke this level and rose until to $1.0720 points, but recently it turned around and started to fall.
So, I think that the Euro can make a correction movement to $1.0525 support area, after movement up.
If this post is useful to you, you can support me with like/boost and advice in comments❤️
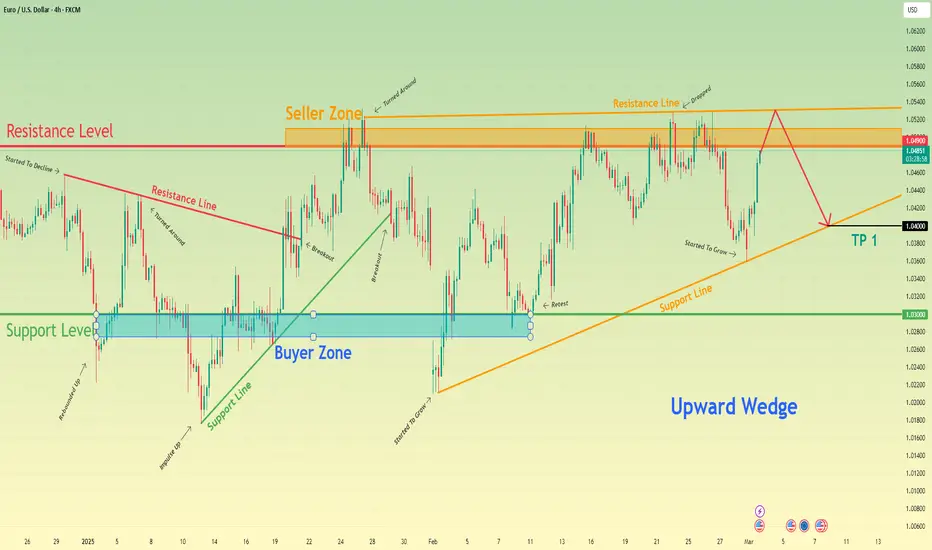
Euro can reach resistance line of wedge and then drop to $1.0400Hello traders, I want share with you my opinion about Euro. Observing the chart, we can see that the price reached the resistance line before beginning to decline. Shortly after, the Euro dropped to the support level, aligning with the buyer zone, then rebounded back to the resistance line before falling again and breaking below the 1.0300 level. Following that, the Euro made a strong upward move, pushing past the resistance level and briefly entering the seller zone. However, the price quickly reversed and started declining within a wedge pattern, eventually breaking through the support line as well. It then fell to the lower boundary of the wedge, forming a gap before beginning to climb again. Not long after, the Euro broke above the 1.0300 level, retested it, and surged toward the resistance level, where it immediately re-entered the seller zone. After some consolidation in this area, the price dropped back to the wedge’s support line, breaking below 1.0490 once again. Recently, however, it rebounded and is now trading near the 1.0490 resistance level. From my perspective, the Euro has the potential to rise toward the wedge’s resistance line, breaking above the resistance level before reversing downward. If that happens, I expect the price to break below 1.0490 again and continue falling toward the wedge’s support line. That’s why I’ve set my TP at 1.0400, as it aligns with this key level. Please share this idea with your friends and click Boost 🚀
EURUSD Channel Up testing 1D MA200 after 4 months!The EURUSD pair has been trading within a Channel Up since the January 13 Low and after the 1D MA50 (blue trend-line) bounce, the current Bullish Leg is testing the 1D MA200 (orange trend-line).
This is the first 1D MA200 test since November 06 2024 and happens to be at the top of the Channel Up with the 1D RSI almost overbought (70.00). These conditions create a low risk opportunity for a short-term Sell. Our Target is the bottom of the Channel Up and the 1D MA50 at 1.04500.
-------------------------------------------------------------------------------
** Please LIKE 👍, FOLLOW ✅, SHARE 🙌 and COMMENT ✍ if you enjoy this idea! Also share your ideas and charts in the comments section below! This is best way to keep it relevant, support us, keep the content here free and allow the idea to reach as many people as possible. **
-------------------------------------------------------------------------------
Disclosure: I am part of Trade Nation's Influencer program and receive a monthly fee for using their TradingView charts in my analysis.
💸💸💸💸💸💸
👇 👇 👇 👇 👇 👇

Eur/Usd Mar/05 Daily biasHello eveyone.
i closed all my longs.last 2 days was great ( check my posts )
price is up almost 3% this week.price above cpr weekly 3rd res . so in this situation i think we will see a pullback.
i'm using tight stop loss.( today ADP...be carefull )
..............................
( This is an idea and entry-tp-sl placed for my own trade , you can change entry-tp-sl depends on your risk management )

Eur/Usd (Mar/04) Weekly biasHello everyone...
as you can see 1.05 to 1.054 is major resistance and if you go to monthly-weekly chart you can see that + weekly 21 ema + D 100 ema-ma
.............
but i think price can go above that area...
Monthly Open above Monthly pivot also right now price is above weekly pivot and euro attacked this area so many times...
( but if price can't close above 1.054 is bad for euro )
.......................................................
( This is an idea and entry-tp-sl placed for my own trade , you can change entry-tp-sl depends on your risk management )

EURO - Price can continue to decline inside falling channelHi guys, this is my overview for EURUSD, feel free to check it and write your feedback in comments👊
Recently price declined to $1.0380 level and then started to grow inside a wedge, where it at once reached $1.0500 level.
Then price turned around and made correction movement to support line of the wedge, after which quickly bounced up.
Price grew to $1.0500 level and some time traded near this level and later finally broke it, after which turned around.
Euro broke $1.0500 level again, exited from wedge and continued to decline inside falling channel.
Inside channel, price declined to $1.0380 level and a few moments ago broke it and now continued to fall.
Possibly, Euro can rise a little higher than $1.0380 level and then continue to fall to $1.0300 inside channel.
If this post is useful to you, you can support me with like/boost and advice in comments❤️
Gold (XAU/USD) Key Levels & Trade Setups: BUY & SELL ENTRY Gold (XAU/USD) 1-Hour Chart Analysis:
1. Key Resistance Zone:
- The price is currently near the $2,922-$2,930 resistance zone.
- This area has acted as a previous supply zone, indicating potential selling pressure.
2. Potential Price Scenarios:
Scenario 1: Rejection from Resistance & Downtrend
- If price fails to break above $2,922-$2,930, a rejection could send it lower.
- A break of the rising trendline could confirm bearish momentum.
- First target: Around $2,898-$2,900 (previous support zone).
- Second target: Around $2,873, which is a strong demand area.
- Final bearish target: Around $2,855-$2,846 if the momentum continues downward.
Scenario 2: Breakout Above Resistance & Bullish Move
- If gold breaks and closes above $2,930 with strong momentum, further upside is expected.
- First target:$2,945-$2,950, marked as the next resistance level.
- A successful breakout could lead to higher bullish continuation.
3. Trendline & Breakout Structure:
- The price had a previous breakout from a descending channel.
- The current bullish structure could be invalidated if the price breaks below the trendline and key support levels.
Trading Plan:
- Watch for price action at $2,922-$2,930 resistance.
- Look for a rejection confirmation (bearish candle patterns) for a potential short setup.
- For a buy position, wait for a strong breakout above $2,930 with a retest for confirmation.

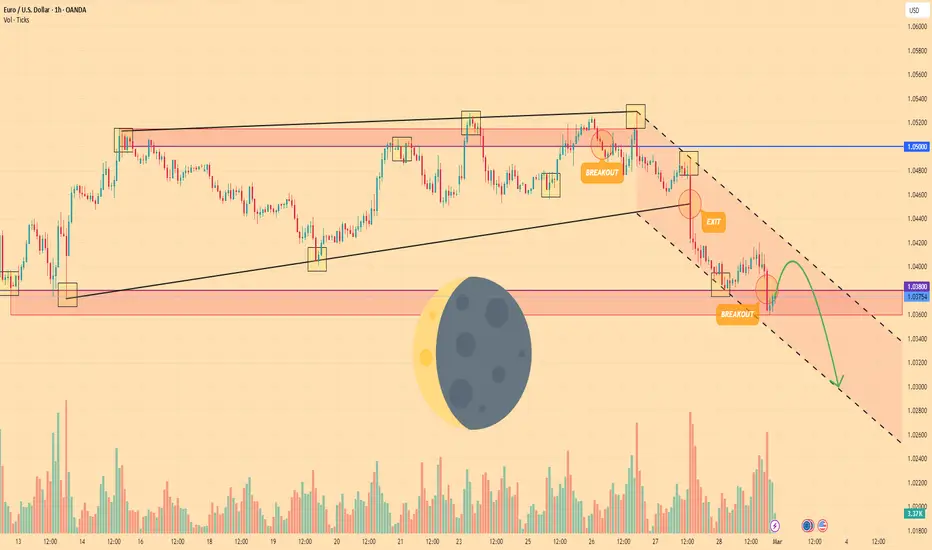
EUR/USD: Double Top Formation with Potential Downside TargetTechnical Analysis:
The EUR/USD chart shows the formation of a double top pattern around the 1.0480 level, which is commonly interpreted as a bearish reversal signal. The price action highlights that the previous resistance level has been tested twice, with an inability to break above this level, suggesting that selling pressure is building. Additionally, a broken trendline (indicated in the chart) supports the likelihood of a downward move.
The price has already broken below the ascending trendline, confirming the weakening bullish momentum. The target for this pattern is located at around 1.0325, which aligns with previous support levels and the projected completion of the pattern.
________________________________________
Fundamental Analysis:
Fundamentally, several factors could contribute to a potential downside for EUR/USD:
Economic Data Releases:
The Eurozone has been facing challenges with economic growth, particularly due to inflationary pressures and the ongoing impact of global supply chain disruptions.
On the other hand, the US economy has shown resilience, with strong labor market reports and consumer spending data that may indicate continued strength. If these trends persist, the USD could gain strength relative to the EUR.
Monetary Policy Divergence:
The European Central Bank (ECB) has been cautious in raising interest rates, with a focus on stimulating growth in the region. This contrasts with the US Federal Reserve, which has been tightening its monetary policy more aggressively to combat inflation.
The divergence in monetary policy could continue to support the USD, adding downward pressure on the EUR/USD pair.
Geopolitical Events:
Ongoing geopolitical uncertainties, including the impact of global trade tensions and regional conflicts, could further affect the Eurozone's economic outlook, while the USD might benefit as a safe haven in times of uncertainty.
________________________________________
Conclusion: With both technical and fundamental factors pointing to a potential bearish scenario for EUR/USD, traders should be cautious of further downside movement. The key support around 1.0325 is critical, and a break below this level could open up further downside towards the next support levels.

Eur/Usd buy Idea Friday Feb/28going to buy euro at golden pocket...TP1 RR:2- TP2 RR:3
( check my last trades )
..............................................
( This is an idea and entry-tp-sl placed for my own trade , you can change entry-tp-sl depends on your risk management )

EUR: watch for a single word that could change everything The European Central Bank (ECB) is set to cut interest rates by 25 basis points at its March 6 meeting, lowering the deposit rate to 2.5%. All 82 economists surveyed by Reuters expect the cut.
So, with this in the bag, the focus shifts to what comes next. Markets see a 60% chance of another cut in April, but hawkish policymakers like Isabel Schnabel are pushing back.
According to ING, a key signal will be whether the ECB drops the term “restrictive” from its stance. If it does, a pause could follow; if not, further cuts may be likely.
Overall, though, the ECB is unlikely to provide detailed forward guidance. Factors like U.S. tariffs and developments in Ukraine could significantly impact the eurozone economy, making it difficult to set a long-term policy path.

BTCUSD Bullish Breakout: Targeting 88,000 and BeyondBTCUSD Bullish Target Analysis
BTCUSD has successfully broken out of the **descending channel**, indicating a potential trend reversal to the upside. The price is currently retesting the 85,272 support zone, which aligns with a rounding bottom pattern—typically a bullish continuation signal.
If this support holds and buyers step in, BTCUSD could see upward momentum toward its next key resistance level. The first bullish target is 88,000, which aligns with the previous price structure. A strong breakout above 88,000 could push BTCUSD toward 89,500–90,000, where sellers may re-enter the market.
To confirm further bullish momentum, BTCUSD needs to maintain support above 85,000 and show increasing volume on the breakout. If it fails to hold this level, a potential retest of lower zones may occur before another push higher.
TARGETS 88,000 - 89,500 - 90,000
STOP LOSS 83,000
