XAUUSD- BUYPrice just broke out of a key downtrend, retested the 50% retracement zone, and is now pulling back into a strong demand block (blue box) sitting right on top of former resistance.
We’re seeing:
✅ Trendline break + retest
✅ Clean retracement into structure
✅ Bullish momentum after reclaiming the mid-range
🎯 Upside targets toward the -27% extension zone (around 3,800+)
This is a classic break–retest–continuation setup. As long as price holds above the 3,740 zone, I’m looking for buyers to step in and push higher.
📈 Bias: Bullish | 🕒 1H Chart | 💰 GLD / XAUUSD
Fibonacci Retracement

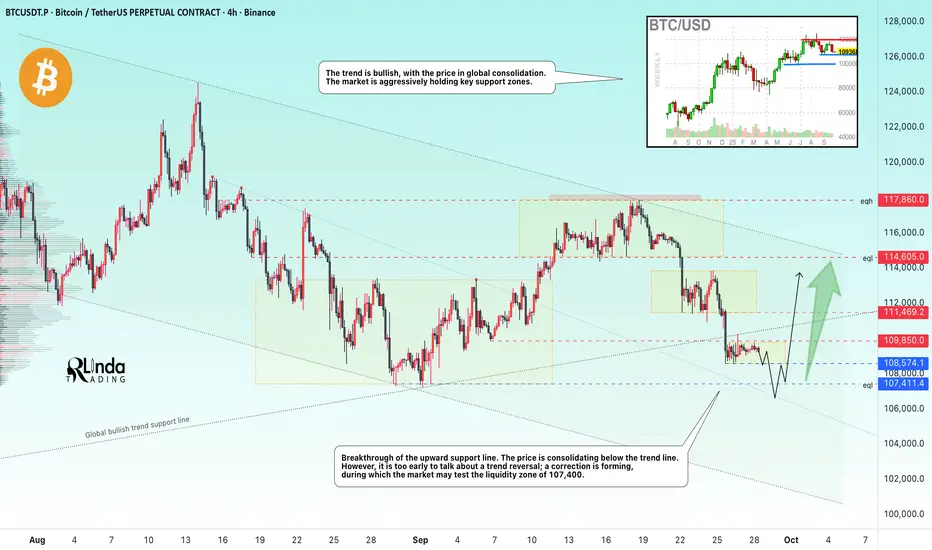
BITCOIN → Stagnation. A brief overview of the current situation.BINANCE:BTCUSDT.P is consolidating after breaking through the trend line support. Despite the positive fundamental background and bullish trend, the market is forming a countertrend correction.
The decline in interest rates in the US has had a negative impact on the cryptocurrency market. Can this be called manipulation? Most likely, yes. But the cryptocurrency market needs a constant driver to keep it alive; calm or neutral conditions lead to corrections and retests of intermediate lows...
As for Bitcoin, I have identified several key areas: the boundaries of the current consolidation at 109,850 and 108,575. Accordingly, a breakout and close above or below one of these boundaries could trigger a move in the corresponding direction. But within the local trend, we can expect a decline to the intermediate bottom of 107,400, from which an attempt at growth could form. In addition, an important zone is the conglomerate of resistance at 110K and the ascending support line. If the price can form an upward momentum and close above the trend support, the market may react positively.
Resistance levels: 109,850 - 110K, 111,500
Support levels: 108,500, 107,400
After breaking through the trend support, there is no momentum and the price is consolidating. This suggests that the market does not believe this premise and a battle for the area is forming. If the bulls can hold their ground and bring the price back within the boundaries of the uptrend, then it may be worth looking for a buying opportunity. Otherwise, it is worth waiting for a retest of the intermediate bottom at 107,400 before looking for an opportunity to open long positions.
Best regards, R. Linda!
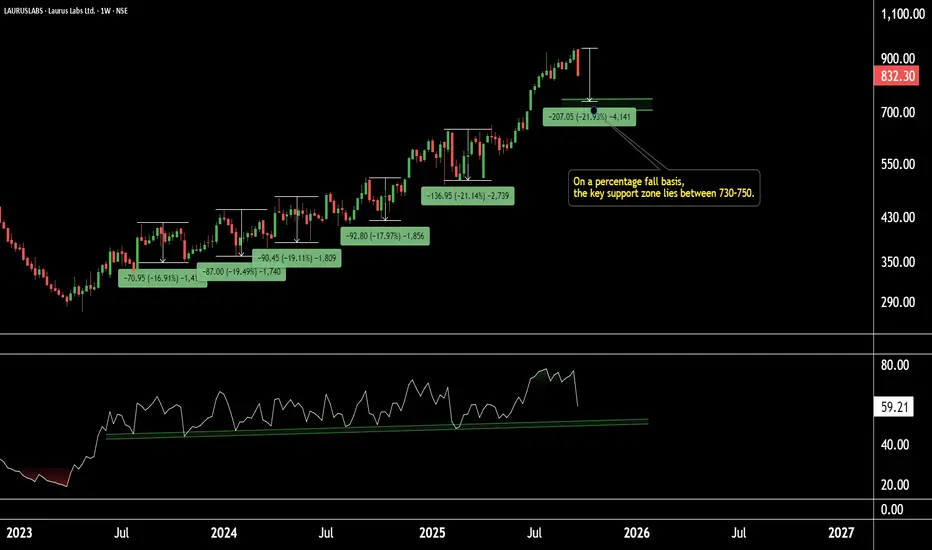
Laurus Labs | Price Action Buying Zone on RadarLaurus Labs | Weekly Technical Outlook
On the weekly timeframe, Laurus Labs has been showing consistent corrections of around 19–20% in each fall.
Currently, the stock is approaching a strong support zone near 700–730, where the weekly RSI is also holding support.
If this level sustains, Laurus Labs has the potential to see higher price levels in the coming sessions.
Thank You !!
Gold Near $3,800 & Preparing for a Major Move🔥 XAUUSD – FiboMatrix Trading Plan
📊 Market Overview
Gold extended its bullish momentum on Thursday, pushing closer to the record high near $3,800/oz on Friday. The rally is fueled by a weaker USD as Treasury yields continue to slide, while expectations of further Fed rate cuts support non-yielding assets.
However, the market is not without risk. As we move into the end of September, gold could face a sharp correction wave, setting up liquidity sweeps and a technical pullback in early October before the next major bullish leg.
📍 Key Technical Levels (H4–H2 Chart)
🔴 SELL Reaction Zones
3,750 – 3,752 → First intraday rejection area.
3,735 – 3,736 → Secondary resistance zone.
3,719 – 3,720 → Short-term rejection level.
🟢 BUY Support Zones
3,693 – 3,695 (Fibo 0.618 confluence) → Strong liquidity zone for bullish setups.
Breakdowns may provide a high-RR BUY opportunity for swing traders.
🎯 Trading Plan
1️⃣ Short-Term SELL Setup
Entry: 3,750
Targets: 3,720 → 3,695.
SL: Above 3,760.
2️⃣ Major BUY Opportunity
Entry: 3,693 – 3,695 zone with bullish confirmation.
Targets: 3,735 → 3,780 → Break above 3,800.
SL: Below 3,685.
⚡ Pro Insights
Expect end-of-month volatility with potential liquidity grabs.
Best R:R comes from waiting for pullbacks into Fibo confluence zones.
If gold holds above 3,695, the bullish structure remains intact heading into October.
💬 Community Discussion
Will gold break $3,800 this week, or will we see a deeper pullback to 3,695 first before the next big rally? Drop your charts & setups 👇

NEAR — Prime Swing Setup at $2.5NEAR is shaping up for a high-probability swing trade, and the chart is lining up beautifully. The $2.5 zone is packed with confluence, making it one of the most attractive long opportunities on NEAR in a while.
Confluence Support Zone
Previous Monthly Open (Key Level): $2.535
0.786 Fib Retracement: $2.506
Liquidity Pocket: Sitting right at this zone
📌 Together, these factors make the $2.53–$2.50 area a critical support level to watch.
🟢 Long Setup
Entry: $2.53–$2.50 zone
Stop-Loss: Below monthly open at $2.366
Target: $4 (major resistance + TP zone)
Potential Gain: ~+50% if played to target
R:R 1:7+
Trade Outlook
If NEAR reacts strongly off the $2.5 zone, this setup could unfold into a powerful swing trade. The structure suggests this could be the launchpad for the next leg higher.
As always, confirmation is key: I’ll be watching closely for a clean reaction before committing fully. Profit-taking decisions will be refined as price action develops, but the $4 level stands out as the main TP zone.
Indicators used
DriftLine — Pivot Open Zones → For identifying key yearly/monthly/weekly/daily opens that act as major S/R reference points
➡️ Available for free. You can find it on my profile under “Scripts” and apply it directly to your charts for extra confluence when planning your trades.
_________________________________
💬 If you found this helpful, drop a like and comment!

SOL/USDT 1D chart review 1. General trend
• A strong upward trend has been underway since June (orange trend marked).
• Recently, we had a very strong rally to around USD 250, but there was a violent correction.
2. Support and resistance
• resistance:
• USD 214 (local resistance, the market has bounced down here).
• 230 USD (strong resistance).
• USD 250 (peak, main resistance).
• Support:
• USD 193 (here the price is currently fighting).
• 176 USD (another strong support - earlier consolidation).
• USD 158 (key support, fracture could mean a change in the trend).
3. STOCHASTIC RSI
• Currently in the sales zone (nearly 0) → may suggest that the market is approaching a local hole and a potential reflection.
4. Scenarios
• Bullish:
If support is supported at 193 USD, possible reflection in the direction of USD 214, and after breaking this level - an attack on USD 230.
• Bearish:
If the price pierces $ 193 down, the next goal is 176 USD, and below even USD 158.
5. Summary
• The market is in correction after strong height.
• At the moment, the key level is 193 USD. Maintaining this support can be reflected.
• However, breaking 193 will open the road to 176.
• RSI shows the sale → short -term relief.

GOLD → Consolidation ahead of the news. Rise or fall?FX:XAUUSD is consolidating in the range of 3738-3759 in anticipation of US PCE inflation data, a key indicator for forecasting further Fed policy. Pressure on the metal is intensifying amid a strengthening dollar.
The revision of GDP growth in Q2 to 3.8%, a decline in jobless claims, and an increase in durable goods orders have lowered expectations for aggressive Fed easing.
The new tariffs imposed by Trump have supported demand for defensive assets, but have not been able to offset the pressure from the rise of the USD.
The overall fundamental backdrop is stagnant amid Powell's uncertain stance and the start of a rate cut cycle. The market reaction is mixed...
Gold is in wait-and-see mode. Strong PCE data could send the price to support at $3700, while weak data could bring back interest in record highs.
Resistance levels: 3754, 3759, 3776
Support levels: 3738, 3728, 3703
Technically, the price is storming the resistance of the downward correction and the resistance of the “triangle” consolidation. A breakout and close above 3754-3759 will confirm the bullish sentiment, which could trigger growth towards the ATH. Otherwise, we can expect a retest of 3738-3728 before a possible rise.
Best regards, R. Linda!

Bitcoin Weekly Elliott Wave & Fibonacci ZonesThis chart presents a comprehensive weekly analysis of Bitcoin (BTCUSD) at a critical juncture following a completed 1-2-3-4-5 Elliott Wave impulsive sequence. The structure now transitions into an ABC corrective phase, with particular focus on the positioning of Wave C in relation to Fibonacci retracement zones.
Elliott Wave Structure: The main bullish cycle is clearly mapped out, beginning from the Wave 2 support low and culminating at the Wave 5 peak. The ABC corrective move is forecast to target classical retracement levels, consistent with historical BTC cycle behavior.
Fibonacci Retracement: Key support zones are defined at the 38.2%, 50%, and 61.8% levels ($95,604; $86,747; $77,890), selected using the Wave 2 low as the anchor for maximal relevance. These levels represent statistically dominant retracement targets for the final stage of corrective pullbacks before blow-off tops historically observed in Bitcoin macro cycles.
Volume Profile and Indicators: The chart incorporates volume spikes and momentum measures (MACD, RSI), validating cycle peaks and inflection points. RSI currently hovers near neutral, supporting the thesis of a corrective move without signaling complete oversold conditions. Accumulation/Distribution remains positive, but fading momentum confirms the need for a reset.
Scenario Outlook:
This analysis anticipates a standardized corrective process in line with Bitcoin’s history, where the C wave of ABC retracement is highly likely to resolve within one of the highlighted Fibonacci zones, most commonly between 38.2% and 61.8% retracement. Technical confluence across price structure and indicators suggests these areas as optimal watchpoints for buyers and macro cycle accumulation. Upon completion of this corrective leg, BTC is statistically favored to embark on a renewed impulsive rally, reinforcing strategic accumulation for the next leg toward new ATH.
The chart is designed as an actionable reference for traders and investors aiming to navigate potential volatility and anticipate high-probability reversal zones consistent with previous bull market cycles.

Solana's oversold RSI. Major upward move ahead.Solana Fibonacci .618 retracement resets RSI to oversold, which signals a major move ahead.
A major move would also coincide with the upcoming major ETF approval on October 10.

DB Corp | Crucial Price Action Zone AheadDB Corp | Technical Outlook
On the daily timeframe, DB Corp is currently trading rangebound within a well-defined consolidation zone, with a strong support zone at 250–260.
The stock is respecting the 0.382 Fibonacci retracement level, with a critical support level placed at 254.
If this level holds, we may see a potential upside move towards 287.
However, if the support at 254 breaks, the next major support lies around 170–180.
Conclusion: Price action around the 254 level will be crucial for the next directional move.
Thank You !!

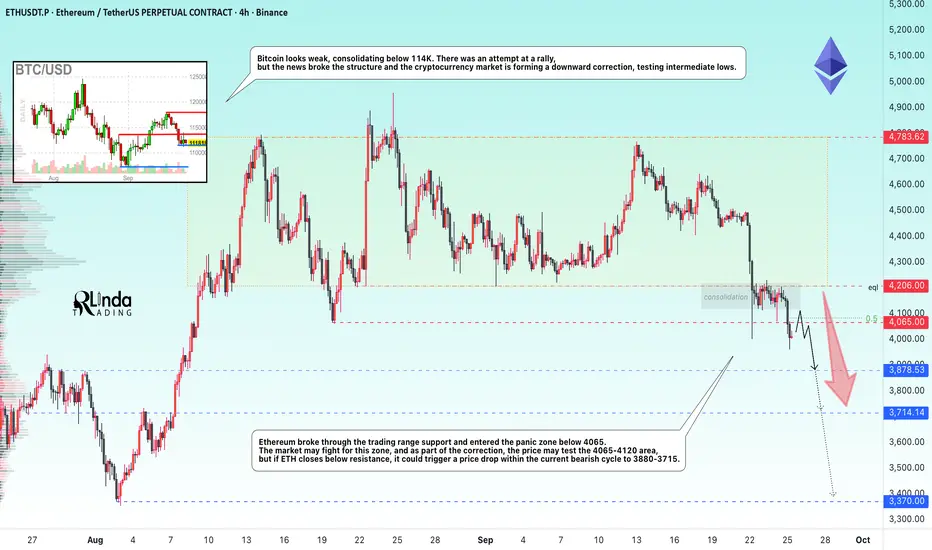
ETHEREUM → False breakout of 4100. Panic?BINANCE:ETHUSDT is forming a false breakout of resistance on the daily chart, formed by the ATH of the previous bullish cycle - 4100. Closing below this level could cause panic in the market...
Bitcoin looks weak, consolidating below 114K. There was an attempt at a rally, but the news broke the structure and the cryptocurrency market is forming a downward correction, testing intermediate lows.
Ethereum broke the support of the trading range and entered the panic zone - below 4065. The market may fight for this zone, and as part of the correction, the price may test the 4065-4120 area, but if ETH closes below resistance, it could trigger a price drop within the current bearish cycle to 3880-3715.
Resistance levels: 4065, 4120, 4206
Support levels: 3880: 3715, 3370
On D1, the structure is weak, the price breaks through 4100-4090 and consolidates in the sales zone. Everyone who bought above 4100 can now start active sales due to the activation of stop orders, panic, fear, and the reversal of their positions. If the market does not receive support (bullish driver), the correction may continue. The nearest target is 3878 - 3715 7 3400
Sincerely, R. Linda!
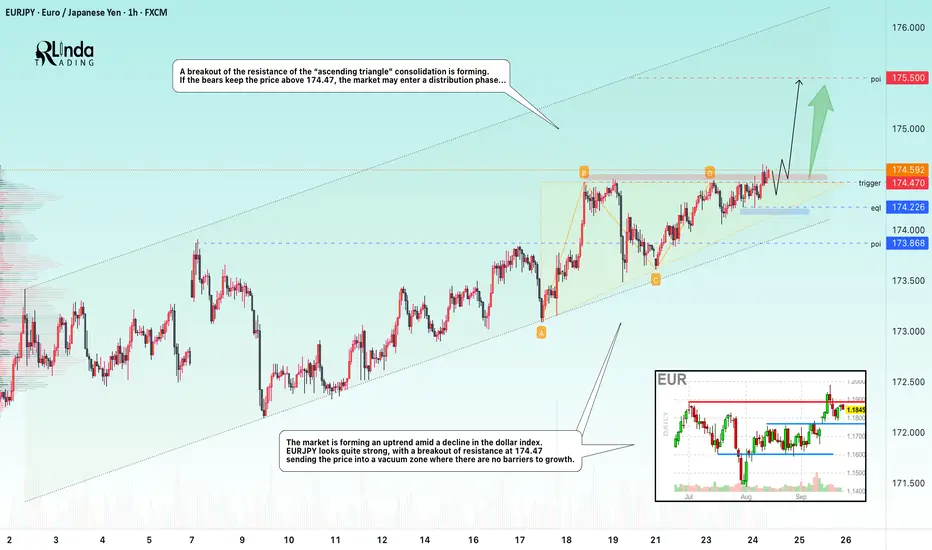
EURJPY → The classical model of technical analysis FX:EURJPY is attempting to break through resistance. The trend is bullish, and the probability of continued growth after consolidation above 174.50 is quite high...
The market is forming an uptrend amid a decline in the dollar index. EURJPY looks quite strong, breaking through resistance at 174.47 sends the price into a void zone where there are no barriers to growth.
A breakout of the “ascending triangle” consolidation resistance is forming. If the bears keep the price above 174.47, the market may enter a distribution phase...
Resistance levels: 174.47, 175.0
Support levels: 174.226, 173.86
The classic technical model for the continuation of the movement is a breakout of the resistance of the ascending triangle. Consolidation of the price above 174.47 - 174.5 may provoke a continuation of the movement within the bullish trend.
Best regards, R. Linda!
$BTC Bulls Must Step Up Or Next Target 200MA₿itcoin testing the perimeter of the DANGER ZONE ⚠️
Thankfully closed inside of it.
Notice how well PA respects this zone.
Bulls really need to step up here, otherwise the long awaited retest of the 200MA awaits CRYPTOCAP:BTC at $104k.
It has to retest there eventually nonetheless.
Note the RSI is nearly at the level we bottomed on Liberation Day.

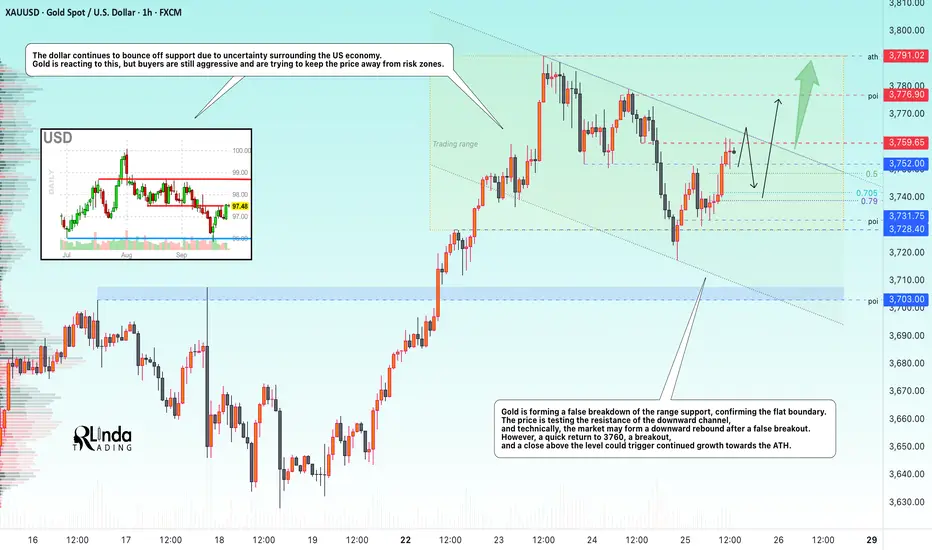
GOLD → Will the correction continue, or is it time for growth?FX:XAUUSD is inside a descending channel—corrections within a global bullish trend. The price is forming a retest of resistance, and the market's reaction to the 3760 zone will give further insight into price movement...
Gold is consolidating in the range of 3730-3790 in anticipation of US economic data and speeches by Fed officials. Pressure on the metal is intensifying due to revised expectations for rate cuts and a correction in the dollar...
Key factors: Markets have reduced expectations for easing to 43 bps by the end of the year after cautious comments from the Fed. The dollar index has reached a 9-day high, limiting gold's growth. Tensions between Russia and NATO are preventing gold from falling.
The market is in wait-and-see mode ahead of tomorrow's PCE data. Strong data today will strengthen the dollar and reinforce the correction in the metal, while escalating geopolitics will bring back demand for safe havens.
Resistance levels: 3760, 3776, 3791
Support levels: 3752, 3741, 3731
Technically, the market is testing downward resistance. Since the opening of the session, the price has already moved a lot and there may not be enough potential for an initial breakout. I expect a pullback to 3745-3740, and if the bulls return the price to 3760, the market will have a chance to break through resistance and continue growing towards the resistance level of the range.
Best regards, R. Linda!
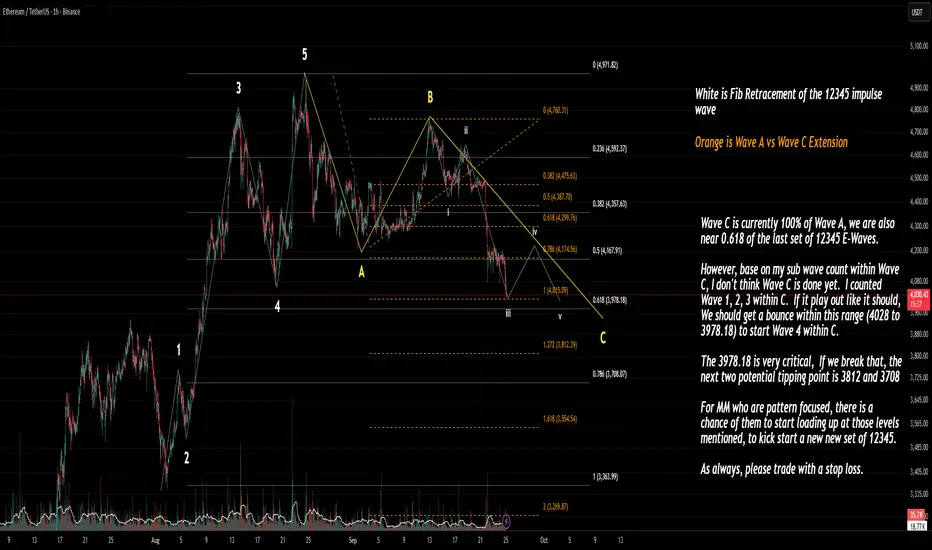
Elliott Wave Ethereum / Fibonacci LevelWave C Progress:
Wave C has already reached 100% of Wave A.
Price is sitting near the 0.618 retracement of the previous 12345 impulse wave.
Subwave Count Inside Wave C:
I have counted Waves 1, 2, 3 inside C.
If this sub-count is correct, a Wave 4 bounce is expected soon in the 4028 – 3978 zone.
Critical Levels
4028 – 3978.18: Expected bounce range (Wave 4 inside C).
3978.18: Key level — breaking it opens the door to deeper downside.
If broken, the next supports are:
3812 (1.272 extension)
3708 (0.786 retracement of entire impulse)
Implications
If 3978 holds, ETH may stage a corrective bounce (Wave 4) before a possible Wave 5 inside C.
If 3978 fails, 3812 and 3708 are the next tipping points where market makers/pattern traders might start accumulating for a new 12345 impulse set.
Watch for a bounce between 4028–3978.
Lose 3978, and 3812/3708 become the big decision zones for the next move.
ETHUSDT 1D chart Review1. Trendline (orange) - was clearly pierced down → it is a signal of weakening the growth moment.
2. Horizers of support / resistance:
• Resistance: $ 4,604 (strong), above $ 4,960.
• Support: $ 4 150 (currently tested), next $ 3,958 and $ 3,696.
3. Price - currently ~ 4 169 $, i.e. right with the support of $ 4 150.
4. Candles - a strong inheritance candle after piercing the trend → weakness signal.
5. STOCHASTIC RSI - in the sales zone (<20), which may suggest the possibility of short -term reflection.
⸻
🔹 Application:
• Short date: possible reflection from $ 4 150 thanks to the sale (technical bounce).
• average date: If level $ 4 150 breaks and the candle closes below → the road opens to $ 3,958 and even $ 3,696.
• Only a return above $ 4 272 and a retest trendline from below would give a signal of buyers.
⸻
👉 To sum up: The market is in the critical zone - support $ 4 150 decides.
• Bull: keeping the defense of this level + reflection from the sale.
• Bear: loss $ 4 150 = greater correction in the direction of $ 3 950–3 700.

GER40’s playin’ games—might be time to strike.Hey Guys,
Once GER40 hits my buy zone, I’m pulling the trigger—targeting 23691.52
• ENTRY:23552.12
Every like you drop pushes me to share more setups like this. Big thanks to everyone showing support!

Long Tia/usdtThe long correction on LSE:TIA might finally be over.
The price just completed a classic corrective pattern and tagged a major 4H support zone.
As long as this demand area holds, the outlook is bullish. Watching this one very closely for a long entry.
LSE:TIA #TradingSetup #nfa

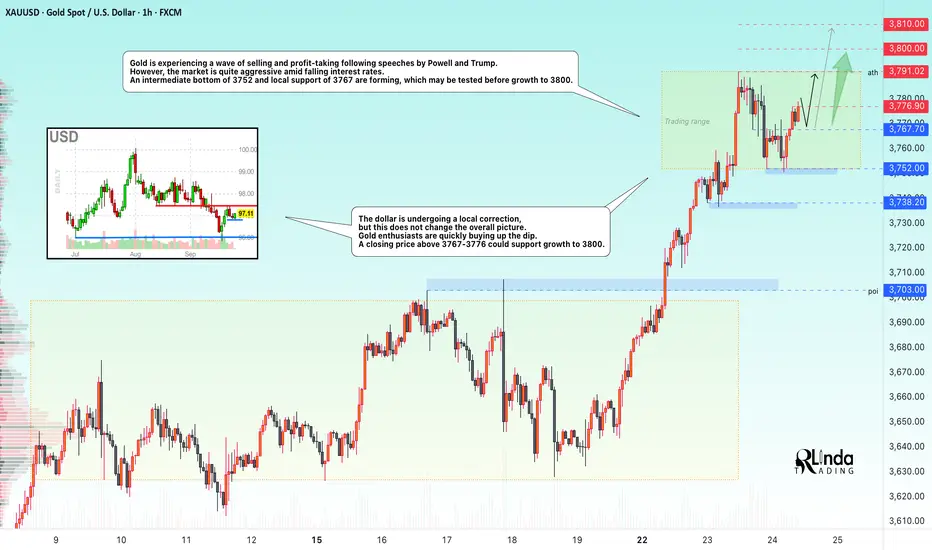
GOLD → Intermediate bottom. Consolidation before growth FX:XAUUSD is being sold off and declining amid profit-taking following speeches by Powell and Trump. However, the market is quite aggressive amid falling interest rates. After forming an interim bottom, the market quickly bought back the decline.
Gold is correcting after record growth, awaiting new signals from Fed representatives and PCE inflation data on Friday. The price remains close to historic highs, but the upward momentum has temporarily slowed, with consolidation forming at 3752-3791.
Key factors : Powell gave no clear hints about future rate cuts, noting the risks of rising inflation and a weakening labor market. The probability of a rate cut in October has risen to 92%, but the Fed's sentiment index is fluctuating somewhat...
The risk of a US government shutdown on October 1 and mixed PMI data are holding back the USD's strengthening.
Technically, gold remains in a bullish trend, but consolidation is possible in the short term. PCE data will be the deciding factor — weak figures will support the metal, while strong figures will trigger a correction.
Resistance levels: 3776.9, 3791, 3800
Support levels: 3767, 3752, 3738
The price is consolidating. Before reaching 3791-3800, there may be a retest of local support. Similarly, a retest of the ATH may also trigger a small pullback of 1/2 of the impulse before a breakout and growth to the specified targets.
Best regards, R. Linda!
BTCUSDT- 250924 - LONG - Bitstamp - Cycle Top - 1WBTCUSDT- 250924 - LONG - Bitstamp - Cycle Top - 1W
Market Cycle Top: 134k
Look to take profits around 134k

GBPUSD overhead supply keeps pressure, downside targets in focusGBPUSD once again tested the main supply zone around 1.3740, from where the market has repeatedly reversed lower. On the daily chart, the pair shows a series of lower highs, and the close below local support signals growing seller pressure.
The first downside target is near 1.3350, where initial profit-taking may occur. The next area is 1.3175, a stronger support level established earlier in the year. If bearish momentum develops further, 1.2900 becomes the key downside target to watch.
From a fundamental perspective, the pound remains under pressure due to Bank of England policy uncertainty, weak UK economic data, and the relatively hawkish stance of the Federal Reserve supporting the dollar. As long as the market trades below 1.3740, the bias remains toward the downside.

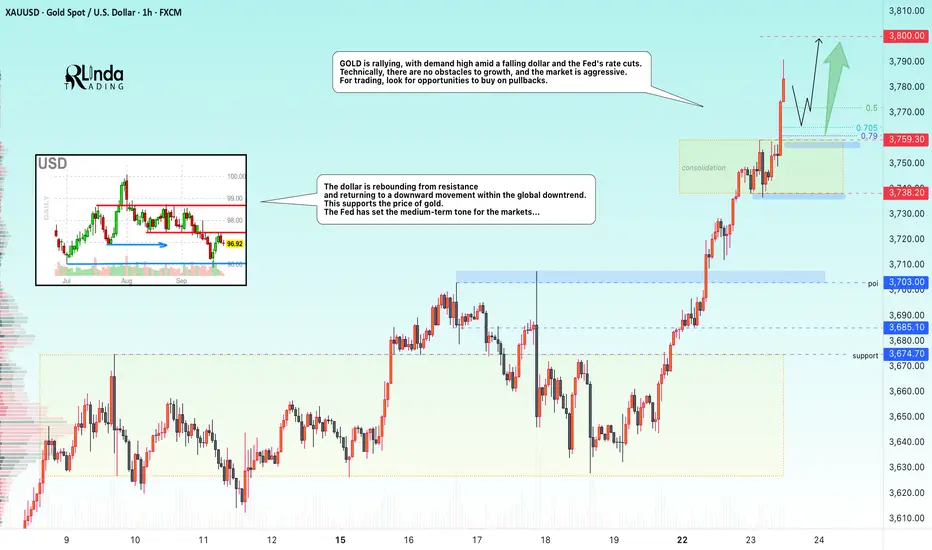
GOLD → Aggressive growth is not over. Powell's speech...FX:XAUUSD is rallying, with demand high amid a falling dollar and the Fed's rate cuts. Technically, there are no obstacles to growth, and the market is aggressive. For trading, look for buying opportunities on pullbacks.
Gold is rallying and hitting new highs as people realize what's going on (interest rates are falling). Powell's speech is coming up, and it may trigger a correction (profit-taking) amid growing risks.
Key factors: Powell's speech today, at which time the market is waiting for hints of further easing of Fed policy.
PMI data (US), weak figures will support the possibility of further rate cuts...
Demand for metal is supported by geopolitical tensions in the Middle East and Eastern Europe.
Resistance levels: 3800
Support levels: 3760
Many factors are supporting the rise in gold, and there are no compelling reasons to sell gold now. The ideal trading strategy is to wait for a pullback and retest of support levels with the formation of strong reversal points for buying.
Sincerely, R. Linda!
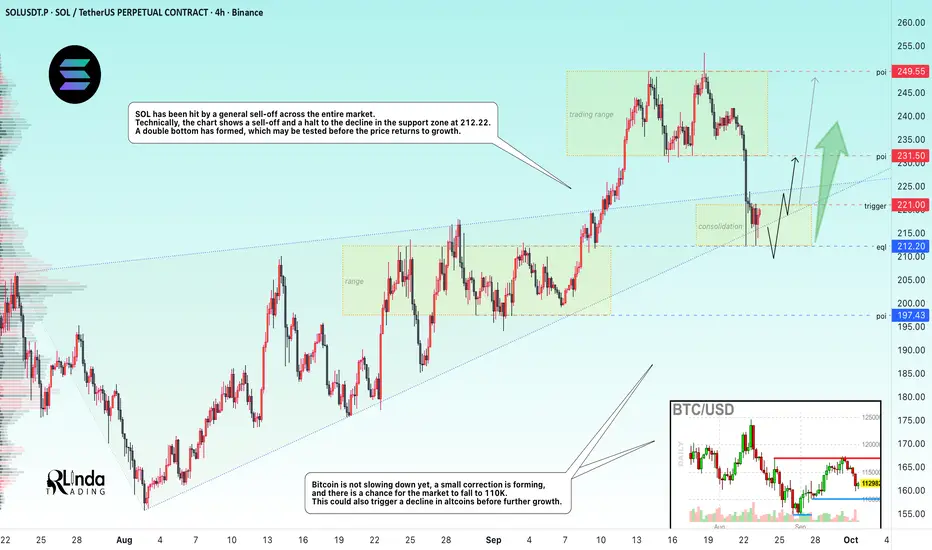
SOLANA → When will the sale end? Bullish trend...BINANCE:SOLUSDT.P is testing the key support zone of 210-215 amid a market decline. However, it is too early to say that the correction is over; additional signs are needed...
Bitcoin is not slowing down yet, a small correction is forming, and there is a chance for the market to fall to 110K. This could also trigger a decline in altcoins before further growth. SOL has been hit by a general sell-off across the entire market. Technically, the chart shows a sell-off and a halt to the decline in the support zone of 212.22. A double bottom has formed, which may be tested before the price returns to growth.
The current consolidation in the range of 212.0 - 221.0, the boundaries of which are of interest to the market, gives hope.
Support levels: 212, 200, 197
Resistance levels: 221, 231.5
A breakout of the local consolidation resistance and a close above 223.5 - 224 could trigger further growth within the bullish trend. Otherwise, MM may test the liquidity and support zone of 212.0 before the coin begins its recovery phase.
Best regards, R. Linda!