Gold Sector Outlook 2025: Is the Golden Era Just Beginning? Gold Sector Outlook 2025: Is the Golden Era Just Beginning? ✨🏆
Introduction
The gold sector is shining brighter than ever in 2025. With prices climbing rapidly amidst global economic uncertainty and rising geopolitical risks, the precious metal is once again a top choice for investors. But what’s driving this bullish momentum, and what should you watch out for? Let’s dig in. 🕵️♂️💰
Trending Sector Performance
🔍 Recent Sector Highlights
Gold Price Surge: Since October 2023, gold prices have surged 53%, recently hitting $2,801 per ounce. Goldman Sachs predicts a $3,000 target by year-end, while J.P. Morgan is a bit more conservative at $2,600—with room to overshoot. 🚀
Mining Output: Industry forecasts show a potential 17% decline in new gold mining supply over the next five years, signaling tighter future supply. This supply squeeze could fuel higher prices. 📉⛏️
Central Bank Demand: Central banks bought 290 tonnes of gold in early 2024, a sign that institutional demand remains strong. Ongoing debt concerns and geopolitical uncertainty are only amplifying gold’s appeal as a safe-haven asset. 🏦🌎
These data points underscore why gold's momentum might just be heating up.
Sector Valuation 📊
The valuation of key gold mining companies suggests opportunities for savvy investors. Here’s a quick snapshot of forward P/E ratios:
Barrick Gold Corp ( TSX:ABX ): 11.79
Barrick Gold (GOLD): 10.09
Gold Fields ( NYSE:GFI ): 8.01
AngloGold Ashanti ( NYSE:AU ): 7.10
Kinross Gold ( NYSE:KGC ): 12.18
With these valuations below broader market averages, the sector shows signs of potential undervaluation. For long-term investors, this could be a golden opportunity. 💡📈
Risk Assessment ⚠️
Like any investment, gold comes with risks:
Price Volatility: While forecasts remain bullish, economic stability or a stronger U.S. dollar could hurt prices.
Supply Constraints: With fewer new mining projects, gold miners may face production challenges if demand accelerates.
Strategic Sector Analysis 🛠️
SWOT Analysis
Strengths:
✅ Strong central bank demand.
✅ Gold’s status as a time-tested safe-haven.
✅ Potential supply constraints pushing prices higher.
Weaknesses:
❌ High operational costs for mining companies.
Opportunities:
💡 Geopolitical instability driving sustained demand.
💡 Mining innovations creating potential for new exploration.
Threats:
🚨 Economic recovery reducing gold’s appeal.
🚨 Higher interest rates diminishing gold’s relative attractiveness.
Key Trends Influencing Gold Prices 📈
Geopolitical Tensions: Uncertainty continues to steer capital towards safe-haven assets like gold.
Monetary Policy: Rate cuts or looser monetary policy could provide further tailwinds for gold prices.
These factors are expected to keep gold at the forefront of investment strategies throughout 2025.
Accuracy and Data Validity ✅
All insights in this article are based on recent data from financial reports, social media sources, and institutional projections, ensuring relevance for early 2025.
Conclusion 🏁
Gold remains a promising investment for 2025. With central bank demand, potential supply constraints, and persistent geopolitical risks, prices may continue their upward march. However, it’s crucial to stay alert to potential economic shifts that could affect the sector’s performance.
What's your 2025 gold price prediction?
🔺 Above $3,000
➡️ Between $2,600 and $3,000
🔻 Below $2,600
discuss in the comments! We’d love to hear your thoughts.
Fundamental Analysis

GOLD → Price is susceptible to manipulation. Correction?FX:XAUUSD amid high risks of tariff wars and high inflation reaches a new ATH and trend resistance, but due to manipulation by politicians there is a possibility of a small correction.
Gold price is consolidating above $2,800 after an all-time high of $2,831, awaiting US employment data and Fed speeches. Volatility increased amid manipulations about Trump's tariff policy: first they set tariffs, then a few hours later they cancel them. In a word, “politicians”. Gold is going into correction after a false breakout of resistance of the ascending channel and on the news about temporary suspension of tariff increase by the USA. Overall gold is holding its ground as the Fed remains cautious on rate cuts.
Resistance levels: 2817, 2830
Support levels: 2811, 2801, 2790
If the price breaks 2811 and consolidates below this area, we should expect a correction to 2800 - 2790 in the short term, there is no hint of a trend change, growth may continue from the key support areas.
Regards R. Linda!

DOGE - Time to buy again!Buy at 25 cents and sell at 28 and 33 cents . This signal is only valid for 3 days.
Give me some energy !!
Give me some energy !!
✨We spend hours finding potential opportunities and writing useful ideas, we would be happy if you support us.
Best regards CobraVanguard.💚
_ _ _ _ __ _ _ _ _ _ _ _ _ _ _ _ _ _ _ _ _ _ _ _ _ _ _ _ _ _ _ _
✅Thank you, and for more ideas, hit ❤️Like❤️ and 🌟Follow🌟!
❗Disclaimer
⚠️Things can change...
The markets are always changing and even with all these signals, the market changes tend to be strong and fast!!

Tariffs and Their Influence on GoldWe observed how gold has pivoted upward so precisely each time tariffs were applied since the start of the trade war in 2018.
Before the trade war, gold remained stagnant within this range. However, with the onset of the trade war, everything changed for gold.
We will conduct a case study since 2018, analyzing how gold has reacted to each significant tariff imposed.
With the latest proposed tariffs on Canada and Mexico, what could be the potential trend for gold, and how should it be managed above the current level?
Gold Futures & Options
Ticker: GC
Minimum fluctuation:
0.10 per troy ounce = $10.00
Micro Gold Futures & Options
Ticker: MGC
Minimum fluctuation:
0.10 er troy ounce = $1.00
1Ounce Gold Futures
Ticker: 1OZ
Minimum fluctuation:
0.25 per troy ounce = $0.25
Disclaimer:
• What presented here is not a recommendation, please consult your licensed broker.
• Our mission is to create lateral thinking skills for every investor and trader, knowing when to take a calculated risk with market uncertainty and a bolder risk when opportunity arises.
CME Real-time Market Data help identify trading set-ups in real-time and express my market views. If you have futures in your trading portfolio, you can check out on CME Group data plans available that suit your trading needs www.tradingview.com

Be careful with TRUMP !!!Buy at $15.5 and sell at 17 and 19 dollars . This Analysis is only valid for 3 days.
Give me some energy !!
✨We spend hours finding potential opportunities and writing useful ideas, we would be happy if you support us.
Best regards CobraVanguard.💚
_ _ _ _ __ _ _ _ _ _ _ _ _ _ _ _ _ _ _ _ _ _ _ _ _ _ _ _ _ _ _ _
✅Thank you, and for more ideas, hit ❤️Like❤️ and 🌟Follow🌟!
❗Disclaimer
⚠️Things can change...
The markets are always changing and even with all these signals, the market changes tend to be strong and fast!!

BITCOIN It will grow soon...Buy at 97k and sell at 103k and 105k . This signal is only valid for 3 days.
Give me some energy !!
Give me some energy !!
✨We spend hours finding potential opportunities and writing useful ideas, we would be happy if you support us.
Best regards CobraVanguard.💚
_ _ _ _ __ _ _ _ _ _ _ _ _ _ _ _ _ _ _ _ _ _ _ _ _ _ _ _ _ _ _ _
✅Thank you, and for more ideas, hit ❤️Like❤️ and 🌟Follow🌟!
❗Disclaimer
⚠️Things can change...
The markets are always changing and even with all these signals, the market changes tend to be strong and fast!!

GBPUSD Not Clear AT the MomentFrom a daily perspective Swing structure remains bullish and we still maintain the bias that price made a deeper pullback retesting the demand zone created on Nov 1, 2023.
Immediately we tapped into that demand zone, price shot up.
However, The daily internal structure remains bearish and until price breaks the internal protected high, we continue looking for selling opportunities.
- At this point, i will stay clear off the market, until i get a clear directional bias.
-Also, it is important to note that this is the 2nd time our daily supply zone (created on Jan 7, 2025) is getting retested. Until we get a nice strong clearance away from that supply , we stay clear from this market.
4HRS
Swing structure is bearish.
Internal Structure = Bullish
We gapped to the downside on Monday and immediately reversed breaking internal structure to the upside. This caused an internal trend change where the internal trend changed from bearish to bullish. This aligns perfectly with daily swing structure and a sign that overall the trend may be changing from bearish to bullish.
After a BoS, we expect a pullback but from where?

Trump’s Trade War Risks Throwing Markets into Chaos. TARIFFic?Apparently, Trump has slapped Mexico, Canada and China with hefty tariffs. Now all these three are either already retaliating with their own levies on US goods or getting ready to do so. The complex interplay of back-and-forth tariffs risks turning friends into foes and driving up prices. All the while the end consumer is likely to cover the difference.
President Donald Trump on Saturday actually went ahead and did what he wanted to do. He launched the game of tariffs. He hit Mexico, Canada and China with hefty import duties, threatening to throw the world’s trade into a spiral of ill intentions, retaliations and higher prices for your Stanley cups and iPhones.
The looming destabilization is already coming from both ends — Canada swiftly imposed 25% levies on roughly $20 billion of US goods coming into the country on Tuesday. Another $85 billion worth of goods are getting the same treatment within the next three weeks.
China, where nearly everything you get your hands on is made, said it will “take necessary countermeasures to defend its rights and interests.”
Trump’s new order requires Canada and Mexico to pay 25% tariffs on imports to the US (with a partial carve out for Canada’s energy and oil exports — 10% levies apply there). The US President was gearing up for a 60% tariff rate on China while he was running for office but said he’s imposing a 10% tariff that will likely get higher in time.
These three countries in 2023 collectively accounted for about 40% of all US imports. That year, the US imported about $3.85 trillion worth of goods. In November 2024, the US pulled in about $351 billion worth of stuff and then sold it to Americans.
What are tariffs and who pays them?
At the basic level, tariffs are a way for an economy to protect itself from foreign competition. Through tariffs, domestic businesses are somewhat shielded from outside interference and can snatch up a bigger portion of the local market.
Tariffs are just taxes placed on products that are made overseas and then imported to the country. Here’s the kicker: the foreign companies that make these goods and then import them aren’t on the hook for paying the tariffs — American businesses are.
Tech companies like Apple AAPL , which makes about 95% of its stuff in China, or Tesla TSLA , which makes half of its cars in China, will end up paying more for their products as they come into the US. Who’s collecting that import duty? The US government.
What could happen when these tariffs get cracking?
The US consumer will most likely cover the difference. Nearly every product will be affected — from cars to baby toys to the already expensive eggs (can egg prices get even higher?)
Here’s an example: potash, the product that’s used by US farmers as fertilizer, just got 25% more expensive. That extra cost, paid by the farmers, is likely to trickle down to the end consumer so farmers could keep trucking and produce at the same rates.
What could happen to the stock market?
One thing is certain — the companies that don’t pass on the added cost to the consumer will see their corporate profits dwindle. But if they want to keep generating value for shareholders, they’ll need to pass it forward to the end user. With the first quarter now well under way, the next earnings season will be a sight to see. (Friendly reminder to keep an eye on the economic calendar for all corporate earnings and updates.)
An analysis from Barclays estimates that all S&P 500 companies could see their profits shrink by 2.8% once the tariffs get in full flow.
Perhaps a bigger, scarier fallout is possible. Inflation can perk up again. Inevitably, the higher costs across the border risk undoing what the Federal Reserve was doing to combat inflation.
Goldman Sachs came out with the forecast that the looming tariffs could have an initial knock on effect on inflation to the tune of 0.7% to the upside. Gross domestic product could drop 0.4%.
And most of all, there’s one thing investors fear the most. Rising inflation could bring back interest rate hikes. A revival in consumer prices might prompt the Federal Reserve to walk back its intentions of more interest rate cuts and lean against the economy by raising borrowing costs.
There are early signs of this already. Fed chief Jay Powell last week said the central bank is in a wait-and-see phase as Trump’s policies unfurl.
The scary tariffs already knocked the wind out of stocks and crypto. Monday morning saw one of its worst openings in years, especially for Ethereum ETHUSD . The second-largest coin fell as much as 27% from the get-go as the bullish sentiment was nowhere to be seen.
Bitcoin BTCUSD also got a slap losing 6% in its first deals to settle near $91,000 before paring back some of the drop. And stock futures were looking at steep declines with Dow futures DJI shedding as much as 700 points ahead of the opening bell in New York. The only winner was the US dollar DXY , which stands to gain popularity in a high-tariff environment.
Until now, the market has been overwhelmingly on Trump’s side. He stepped into the White House riding on the promises of a strong economy and booming business. But if he takes aim (even indirectly) at shareholders’ profits, he might end up losing the support of all those billionaire executives who worked hard to get him elected.
What do you think? Is Trump acting in the best interest of America or is he driving markets into a ditch? Share your thoughts below!

MSTR is about to go down....you've been warnedMSTR is about to go down and we can see this by the consolidation at the upper end of the downward channel. Also, BTC drop won't help so it's seems like a double dip!
You've been warned. Always do your own due diligence! Best of luck...and leverage MSTZ :)

Possible selling Opportunity for GBPUSDPrice has been extremely bullish. We are approaching a possible supply zone where we may see a reversal for the overextended bullish run.
So we prepare for sells.
But at the same time, based on Daily swing structure which is bullish, price made a deep pullback into a daily demand zone. So we could actually see this bullish move hold and break above our Supply Zone.

HBAR Seeking Golden Ratio After False Break of Consolidation?There's some big tells in what COINBASE:HBARUSD could potentially be getting ready to do so lets break it down on the Daily Chart!
Since the High on Dec. 3rd @ .392, Price has steadily been forming what looks to be a Descending Triangle while finding Support in the ( .25 - .23 ) cent range. Bearish volume building and RSI going from Overbought to currently going Below 50 suggests further Bearish Price Action could occur!
After the Positive USD Economic News Results for ISM Services and JOLTS Jobs Openings coming in well above Forecast, this seen the Dollar gain strength and other markets like Stocks and Crypto take a dive, in COINBASE:HBARUSD instance, it generated a False Break of the Descending Triangle to now where we see Price plummeting down to test the Support of this Consolidation Pattern.
If Support breaks, we could see Price make a Retracement to the April 2024 Highs @ ( .18 - .15 )
This area looks especially favorable because:
-From the Low before the Rally @ .04172 to the High of the Rally @ .392, lands the Fibonacci Golden Ratio levels priced @ ( .19619 - .17553 ) with the April 2024 High @ .1842 right in the Middle of this Zone!
-The 200 EMA is curving up into the suspected Support of the April 2024 Highs if Price were to fall, it would test this as well!
*If Price continues to fill the Pattern more, keep an eye out for more False Breaks, this will be evident with Price breaking either Area of Value ( Falling Resistance or Support Zone) followed with minimal Volume.

Market is Weird (BTC down -15% ---> Altcoins -45%) Dump sign In this educational post we want to talk about investors money and Assets which is usually now down by 40% more or less and we also explain the reason of that before it happens in previous educational posts:
Now lets talk about the Topic and why the market is weird and you all know that and the reason is:
Take look at some major Coins i provide down here comparing to Bitcoin fall from Top to Low in previous month:
1. ETHUSDT(-48% fall):
2. DOGEUSDT(-58% dump):
3. SOLUSDT(-40% fall):
4. SHIBUSDT(-64% dump):
5. XRPUSDT(-48% dump):
So Bitcoin is only down -17% from ATH and need only that much correction and soon after that it is recovering that loss but other Altcoins even did not catch new ATH and if they did now they need 50%-60% correction and dump??
Lets explain more about view of most Investors not the whales and then you see what is going on?
most of the new investors or even old investors bought or buying Altcoins or meme coins or max they buy ETH because they usually say that here is Dream world and BTC can not do +300% in one day but my XRP can or my MEMECoin can do +1000% even or ...
so most of traders and investors and new People have Altcoins instead of Bitcoin so the market now is receiving some fall and correction and may need that correction because we need down and Up and it is not always pump pump pump, so now most of investors which have Altcoins are in a huge loss so they open chart of Bitcoin and see every thing is fine and the supports are strong and this was short-term fall and soon my Altcoins will also rise to hit new ATH like The god bitcoin but it is not happening.
and i think they are holding Bitcoin Up and hitting new ATH to sell more Altcoins to us, and make the chart of them looks good to enter now because now Altcoins charts looks great and they look like the correction and fall ended here but this may be the beginning.
Notice: Long-term i am bullish too but if you are going to get panic if you see -40% or -50% on your wallet so take care because this usually happen in crypto and if you hold good coins it usually turn to +100 to +300% profit in next years or months.
So take care and also i may be wrong and this weird market and dump in spot maybe was made by market to put out some panic holders and buy their token to pump market even more.
so every thing is possible and this was my view that the more dump is coming.
DISCLAIMER: ((trade based on your own decision))
<<press like👍 if you enjoy💚

EUR/NZD Triangle Breakout (5.2.2025)The EUR/NZD Pair on the M30 timeframe presents a Potential Selling Opportunity due to a recent Formation of a Triangle Breakout Pattern. This suggests a shift in momentum towards the downside in the coming hours.
Possible Short Trade:
Entry: Consider Entering A Short Position around Trendline Of The Pattern.
Target Levels:
1st Support – 1.8220
2nd Support – 1.8140
🎁 Please hit the like button and
🎁 Leave a comment to support for My Post !
Your likes and comments are incredibly motivating and will encourage me to share more analysis with you.
Best Regards, KABHI_TA_TRADING
Thank you.

Tesla - Another +100% After This Breakout!Tesla ( NASDAQ:TSLA ) can still double from here:
Click chart above to see the detailed analysis👆🏻
With Elon Musk actually becoming the richest person on this planet, Tesla is simultaneously attempting another all time high breakout. All the recent bullish momentum could further fuel this rally, leading to new all time highs and another 2x in Tesla's market cap.
Levels to watch: $450, $900
Keep your long term vision,
Philip (BasicTrading)

Gold: Bullish Momentum Remains, But Caution is Advised - UpdateGold: Bullish Momentum Remains, But Caution is Advised
The bullish momentum for gold remains intact, but we must exercise caution.
In the gold analysis I explained yesterday, we can see that gold has already reached two of our targets: 2830 and 2836. The 2830 level was reached twice.
The price is currently testing a very strong zone near 2836 - 2844, which also corresponds with the resistance zone of a larger channel. You have to...
You can watch the analysis for further details.
Thank you! 😊

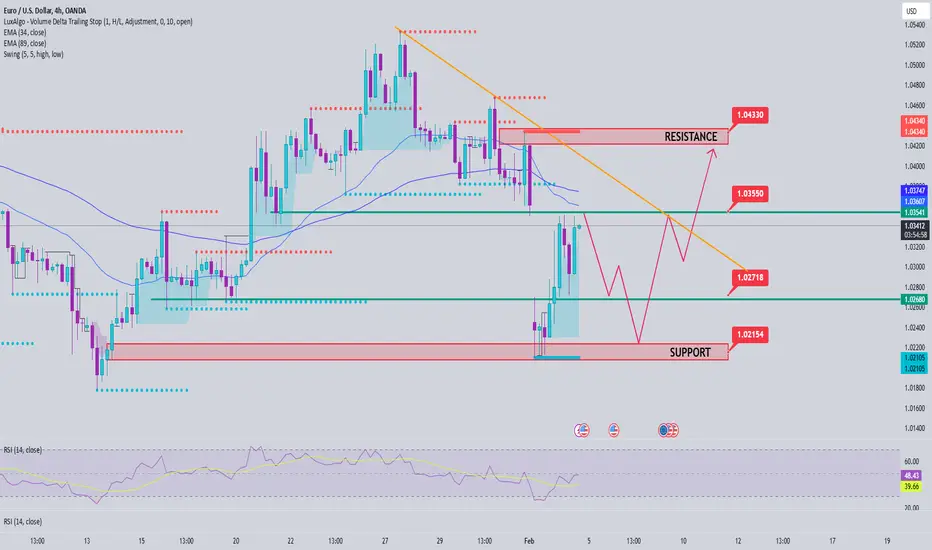
EURUSD Analysis February 4EURUSD is facing resistance at the 1.035 EMA. It is difficult to break this zone quickly. The pair may retest the 1.027 and 1.022 price zones to break the EMA zone to form an uptrend again. When still trading below the 34 and 89 EMA, the pair is still in a downtrend and prioritizes SELL signals.
XRP and LINK to Begin Run to $5200 and $4700 RespectivelyYour eyes and ears to the future of crypto right here in real life. (No need to look into the multiverse for that anymore ;-) Anyway, if you're balsy enough to hold these things all the way to the top, you're a big-time winner!! Why is that xntisma? Well, sir! Glad you asked! That's because crypto plateau's at the top my young friend!
Welcome to the world of the unknown, and sometimes, downright twilightish........
Ya Boi,
-Ant

Barrick Gold Corporation ($ABX): Golden Opportunity or Risky
Barrick Gold Corporation (ABX): Golden Opportunity or Risky Prospect? 🏆💰
1/10
Barrick Gold TSX:ABX has seen a solid financial performance recently. EPS for the last quarter hit C$0.42, with next quarter estimates at C$0.63. They beat estimates 75% of the time in the past year. 📈
2/10
Analysts are bullish! The average price target is C$33.57, implying a potential upside of 50.13% from the current C$22.36 price. Strong Buy ratings dominate: 10 Buy, 2 Hold. 🔍 What do analysts know that the market doesn’t?
3/10
However, ABX is facing operational challenges. A suspension in Mali due to government intervention highlights geopolitical risks in mining. 🛑 Regulatory challenges are part of the gold mining game.
4/10
Stock price check: ABX currently trades at C$23.15. That’s 20.94% below its 52-week high of C$29.28 but 21.59% above its low. What does this tell us? Room for recovery, but risks loom. 📊
5/10
Valuation time! Compared to sector peers, Barrick offers an attractive price level, especially given the 50% upside target. Analysts love undervalued plays like this, but what about the risks? 🤔
6/10
Strengths: Barrick operates across multiple countries, ensuring diversified production. That’s crucial in a volatile gold market. 🌍 Diversification is a key defensive strategy here.
7/10
Challenges: High operational costs are always a concern. Pair that with political instability, like the Mali suspension, and ABX faces a steep uphill climb. 🏔️ How much risk are you willing to take on?
8/10
Opportunities: Expansion is always on the table. With gold prices looking stable, Barrick could capitalize on new projects or mines. But timing matters in this market. ⛏️
9/10
Threats: Regulatory and political risks never sleep. Changes in mining laws or political unrest can hit Barrick hard—Mali’s situation is a prime example. Always know your risks. ⚠️
10/10
What’s your take on Barrick Gold TSX:ABX ? Will it strike gold again? Vote here! 🗳️
Buy for the long term 📈
Hold and watch growth 🔄
Too risky, avoid 🚫

Gold trading following the upward trend is the answerTrading gold with the trend is the answer. Don't be afraid of highs and don't guess the top.
Obviously, the upward trend of gold is still continuing. No one knows where gold will eventually rise, and no one knows when it will usher in a downward adjustment. We only know that the fundamentals are on the side of buyers. No matter how the short-term adjustments are made or how the market is cleaned up, it will not change the fundamental fluctuation direction. Therefore, the investment direction is very important. Breaking new highs every day, it is better to be conservative than to go against the trend. If the short position is not stopped in time during a strong rise, the result will be a liquidation.
The current daily line has risen for four consecutive trading days, which shows that the overall rhythm is still strong. With this trend, there is only one way to go long, either directly go long, if the retracement is broken, continue to go long at the low position, and break the high and go long. Going with the trend is the only way. If the retracement is 10 US dollars and the price rises by 50 US dollars, there is no need to go against the market. Don't guess the top. Pay attention to the top and bottom conversion support 2830 and 2807 positions during the day. They are both positions for retracement and long positions. If the strong sideways pattern is considered, continue to go long directly above 2830.
Today's gold trading ideas: Don't be afraid of highs and maintain long positions. Don't guess the top and reject all short positions. The idea is that the retracement to stop the decline is the time to enter the market. For intraday operations, gold will continue to be long when it retraces to the top and bottom conversion area of 2830. It is more reasonable to set the stop loss below 2830, and the target is 20 $.

Crude ProspectI personally see crude in 2 different ways.
1.
- fall a little more to have a power to rebound up to the previous high easy.
- then, it will be completely bullish until the 80-90 dollars zone
2.
- take some time with sideways channel and digest the volume thats done until now..
- then the crude will gain its momentum to soar up to the same 80-90 dollars price line.
- However, ultimately it will go up until ATH and it will be the sign to sell your house and place your position with those money. This applies to the first scenario as well.

TWLOKey Metrics & Global Reach
●
●
Adoption & Scale:
○
Over 300,000 companies and 10 million+ developers worldwide use Twilio’s
platform.
○
The platform delivers over 130 billion text messages per year and supports
communications in 180+ countries.
Industry Penetration:
○
In financial services, 8 of the top 10 U.S. banks and 9 of the top 10 insurers
rely on Twilio.
○
Across sectors like healthcare, e-commerce, SaaS, and logistics, Twilio is a
critical communications backbone.
Industries Leveraging Twilio’s Services
1. Financial Services (Banking & Fintech):
○
Use Cases: One-time passcodes, fraud alerts, transaction notifications.
○
Examples:
■ Morgan Stanley uses secure, compliant text messaging for advisors and
clients.
■ Stripe leverages Twilio for two-factor authentication (2FA) to verify millions
of users and secure payments.
2. Healthcare:
○
Use Cases: Appointment reminders, telehealth, patient outreach via
HIPAA-eligible APIs.
○
Examples:
■ NYU Langone Health integrated Twilio for appointment reminders and
critical health messages, boosting patient engagement.
3. E-commerce & Retail:
○
Use Cases: Order confirmations, shipping/delivery updates, customer service
chats, and promotional campaigns.
○
Examples:
■ Instacart uses SMS for real-time order and delivery notifications.
■ Retailers also use Twilio’s omnichannel capabilities (including SendGrid
for email) to drive personalized marketing.
4. Software & SaaS:
○
Use Cases: In-app notifications, user verification, embedded voice/SMS chat
features.
○
Examples:
■ Platforms like Salesforce and HubSpot integrate Twilio for enhanced
customer communication.
○
Additional Sectors: Marketing, media, education, and even public utilities find
Twilio’s flexible APIs invaluable.
5. Transportation & Logistics:
○
Use Cases: Real-time ride updates, coordination between drivers and riders,
tracking alerts, and masked communications.
○
Examples:
■ Uber sends live text updates to riders, while Lyft built a custom contact
center on Twilio Flex to support both riders and drivers.
Major Companies & Partnerships
●
●
●
●
●
●
●
●
Uber:
○
Uses Twilio’s SMS and voice APIs to send real-time ride status notifications and
enable privacy-preserving, masked calls.
○
Twilio’s global reach has been critical as Uber scales into new cities.
Airbnb:
○
Integrates Twilio for secure, anonymized communication between hosts and
guests, increasing booking success rates and response times.
Lyft:
○
Built its customer support contact center on Twilio Flex, handling millions of
weekly interactions with a custom, scalable solution.
Instacart:
○
Uses Twilio extensively for order confirmations, delivery updates, and two-way
communications between shoppers and customers.
○
The platform’s near-instant messaging was essential to Instacart’s operational
success.
Morgan Stanley:
○
Implements compliant client communications via Twilio, ensuring secure and
logged text messaging for financial advisors.
Stripe:
○
Relies on Twilio Verify for sending one-time passcodes that secure logins and
payment confirmations for millions of users worldwide.
Shopify:
○
Overhauled its customer support center using Twilio Flex, consolidating multiple
communication channels into one efficient system.
Additional Notable Partners/Users:
○
Toyota Connected for connected car notifications, Reddit for account verification
and chat, HubSpot for marketing automation, Deliveroo for customer updates,
and even Netflix has leveraged Twilio SMS for user engagement.
Primary Use Cases & Applications
1. Two-Factor Authentication (2FA) & Verification:
○
Widely implemented across industries to add an extra layer of security.
○
Examples include banking apps and social platforms that use Twilio to verify
phone numbers via SMS or voice calls.
2. Customer Service & Call Centers:
○
Twilio’s suite (including the Programmable Voice API and Flex) supports IVR
menus, intelligent call routing, and multi-channel support, enabling agents to
handle queries efficiently.
○
Integration with CRM systems provides context-rich interactions, ensuring
personalized and prompt customer service.
3. SMS Alerts & Notifications:
○
Utilized to provide time-sensitive alerts (e.g., shipping updates, appointment
reminders, ride status notifications) across industries.
○
The reliability and speed of Twilio’s messaging are crucial for mission-critical
updates, as seen with Instacart and healthcare providers.
4. Marketing Campaigns & Engagement:
○
Marketing teams use Twilio’s Messaging APIs (SMS, WhatsApp) and SendGrid
for email to run targeted campaigns, promotions, and customer engagement
initiatives.
○
Twilio Engage and Segment help in unifying customer data for personalized
outreach.
5. Chatbots & Conversational Interfaces:
○
Developers build SMS chatbots and AI-driven conversational agents using Twilio
Studio and integrations with platforms like Dialogflow.
○
These bots handle customer inquiries and tasks, with the ability to escalate to live
agents when necessary.
User Roles Driving Twilio Adoption
●
●
●
●
Software Developers:
○
The primary users who integrate Twilio’s APIs and SDKs into applications,
handling everything from SMS verification to in-app chat and voice
communications.
IT Administrators & Architects:
○
Oversee Twilio integration with back-end systems, manage provisioning, secure
API keys, and ensure compliance (e.g., HIPAA in healthcare).
Marketing Teams:
○
Use Twilio’s no-code interfaces (like Segment or Campaign Studio) to design,
execute, and measure customer outreach campaigns.
Customer Support & Operations Teams:
○
Leverage Twilio-powered contact centers (like Flex) to enhance customer
service, manage automated alerts, and resolve issues across channels.
Conclusion
Twilio’s flexible, API-first platform is trusted by leading companies across diverse
industries—from financial services and healthcare to e-commerce, SaaS, and transportation. Its
key metrics (global reach, high message volumes, and robust developer community) underscore
its importance in modern digital communications. Companies such as Uber, Airbnb, Lyft,
Instacart, Morgan Stanley, Stripe, and Shopify not only use Twilio’s services but also partner
with it to innovate customer engagement, drive operational efficiency, and ensure secure,
real-time communications worldwide.
This summary draws on available evidence and examples from multiple sectors, reflecting both
the breadth and depth of Twilio’s market impact.

BTCUSDT Price Action - Liquidity & Imbalance AnalysisPremium Zone Rejection: Price entered a marked imbalance (FVG) before rejecting lower, indicating possible distribution by smart money.
Key Liquidity Zones:
96,188.39 - Potential support where price could react.
Feb 03 Low (91,255.44) & Jan 13 Low (89,244.90) - Significant downside liquidity pools where price may seek orders.
Next Steps: If BTC fails to reclaim the rejection area, expect a potential sweep of liquidity towards the Feb 03 low. Alternatively, a reclaim of $98,000+ could suggest bullish continuation.

Stay patient! US Job openings just came in 5% lower than expected!
What does this mean?
It will show the FED that high interest rates are detrimental to the US economy.
On top of the pressure from China and Deepseek, the tariff news and the fear of a global trade war.
This will push the FED to review policy, and if we see a continued trend of less-than-expected jobs, we could transition from Quantitative Tightening to Quantitative Easing, which will be extremely bullish on the market!
You just need to be patient and focus on holding CRYPTOCAP:BTC and winning projects such as $SNAI!
If you are reading this, you are still early in the 2025 bull run!
