WIFI: Bangkit dari Koreksi! Rebound atau Dead Cat Bounce?Trading langsung melalui TradingView x STAR!
Teknikal:
• Last: 1935
• Resist: 2170 : 2730
• Support: 1825 : 1550
• Cutloss: < 1550
Sales Note:
• WIFI through its brand Surge is a co providing internet connecticity through a fiber optic network along railroad tracks on Java island , partnering with local ISPs via revenue sharing system.
• Surge offers affordable (start from IDR100k/month), high quality and unlimited internet access to households located within 1-5km from KAI railroad – this has achieved so far an solid 90% take-up rate.
• WIFI owns 6,972km of fiber optic lines along railway tracks and highways in Java. As of 9M24, WIFI owner fixed assets in the form of project equipment worth IDR890bn and more than IDR800bn worth of fiber optic lines .
• In 9M24, Surged booked revenue growth of 46% y-y to IDR505bn. The company aims to roll out up to 40mn homepasses in 2025 – this coupled with a conservative 45% EBITDA margin, could translate to more than IDR250bn in profit .
• B/S is also manageable, with net gearing of 1.4x in 2024; with potentially increasing debt but reasonable given the exponential revenue growth.
• PT Investasi Sukses Bersama (ISB) owns 50.4% stake in WIFI, whereas around 45% of that is owned by PT Arsari Sentra Data (co owned by Hashim S Djojohadikusumo) .
• The stock trades at 7x EV/EBITDA 2025E , which is lower than global telco, especially fiber optic names avg of 8x.
Anthony Yunus
Head of Sales
PT Samuel Sekuritas Indonesia
__
Jika Anda memiliki pertanyaan, jangan ragu untuk menuliskannya kepada kami di kolom komentar di bawah.
PT Samuel Sekuritas Indonesia berizin dan diawasi oleh Otoritas Jasa Keuangan
Fundamental Analysis

Silver finally has a silver lining for 2025 After all my bearishness with market analysis.
There is one metal that is showing semblance of hope and upside.
Gold's baby sister to follow along a Resource train in 2025.
Silver.
Now there are a few reasons we've seen upside inccluding:
Inflation Hedge:
Investors are buying silver as a hedge against rising inflation, keeping prices on the up and up 💰📈
Safe Haven Demand:
With market uncertainty, more people are flocking to silver as a safe haven, pushing its price higher 🛡️🚀
Industrial Demand Boost:
Growing industrial uses in tech and renewable energy are boosting demand for silver, driving prices up ⚙️🔋
Supply Constraints:
Limited mine output and slow supply growth are tightening the market, adding upward pressure on silver ⛏️📉
Bullish Market Sentiment:
Technical trends and positive investor sentiment signal that silver's rally is likely to continue upward 🔮📊
And of course the TECHNICALS agree.
We have seen a price break above the rim of the CUp and Handle.
The price is above the 20MA and 200MA.
So we can see the price is heading up!
What are you thoughts?
Disclosure: I am part of Trade Nation's Influencer program and receive a monthly fee for using their TradingView charts in my analysis.

Breaking: Adobe Inc. (ADBE) Down 10% Amidst Disappointed OutlookAdobe Inc. shares (NASDAQ: NASDAQ:ADBE ) tanked 9% in Thursday premarket trading amidst a disappointed outlook as shares faces downgrade.
Adobe (ADBE) reported record quarterly revenue above analysts’ expectations, though its outlook disappointed. The Creative Cloud developer’s revenue climbed 10% year-over-year to a record $5.71 billion, above the analyst consensus from Visible Alpha. Adjusted earnings of $2.22 billion, or $5.08 per share, rose from $2.05 billion, or $4.48 per share, a year earlier and topped estimates.
Adobe’s Digital Media arm, which includes Creative Cloud subscriptions, saw revenue of $4.23 billion, up 11% year-over-year and exceeding analysts' projections.
CEO Shantanu Narayen said Adobe is "well-positioned to capitalize on the acceleration of the creative economy driven by AI." The results come ahead of the company's Adobe Summit event next week, with analysts saying they'll be watching for updates on generative AI metrics.
Looking ahead, Adobe maintained its full-year revenue outlook of $23.3 billion to $23.55 billion, and adjusted earnings per share of $20.20 to $20.50, both below analyst consensus projections at the midpoint.
Technical Outlook
as of the time of writing, shares of Adobe Inc. (NASDAQ: NASDAQ:ADBE ) are down 10.67% trading within oversold levels with the RSI at 26. This disappointed outlook led to a gap down pattern on the chart which is a very strong bearish pattern, however, it gets filled up overtime. NASDAQ:ADBE has already broken the 1-month low base and approached the support point a break below that level could be canning for ADBE shares.

GER40/DAX "Germany40" CFD Index Market Heist Plan🌟Hi! Hola! Ola! Bonjour! Hallo! Marhaba!🌟
⚔Dear Money Makers & Thieves, 🤑 💰✈️
Based on 🔥Thief Trading style technical and fundamental analysis🔥, here is our master plan to heist the GER40/DAX "Germany40" CFD Index Market. Please adhere to the strategy I've outlined in the chart, which emphasizes short entry. Our aim is the high-risk Green Zone. Risky level, oversold market, consolidation, trend reversal, trap at the level where traders and bullish thieves are getting stronger. 🏆💸Book Profits Be wealthy and safe trade.💪🏆🎉
Entry 📈 : "The vault is wide open! Swipe the Bearish loot at any price - the heist is on! profits await!" however I advise placing Sell limit orders within a 15 or 30 minute timeframe. Entry from the most recent or swing low or high level should be in retest.
Stop Loss 🛑: Thief SL placed at (23000) swing Trade Basis Using the 2H period, the recent / swing high or low level.
SL is based on your risk of the trade, lot size and how many multiple orders you have to take.
🏴☠️Target 🎯: 21400 (or) Escape Before the Target
🧲Scalpers, take note 👀 : only scalp on the Short side. If you have a lot of money, you can go straight away; if not, you can join swing traders and carry out the robbery plan. Use trailing SL to safeguard your money 💰.
GER40/DAX "Germany40" CFD Index Market is currently experiencing a Neutral trend to Bearish., driven by several key factors.
📰🗞️Read the Fundamental, Macro Economics, COT Report, Seasonal Factors, Intermarket Analysis, Sentimental Outlook, Future trend predict.
Before start the heist plan read it.👉👉👉
📌Keep in mind that these factors can change rapidly, and it's essential to stay up-to-date with market developments and adjust your analysis accordingly.
⚠️Trading Alert : News Releases and Position Management 📰 🗞️ 🚫🚏
As a reminder, news releases can have a significant impact on market prices and volatility. To minimize potential losses and protect your running positions,
we recommend the following:
Avoid taking new trades during news releases
Use trailing stop-loss orders to protect your running positions and lock in profits
💖Supporting our robbery plan 💥Hit the Boost Button💥 will enable us to effortlessly make and steal money 💰💵. Boost the strength of our robbery team. Every day in this market make money with ease by using the Thief Trading Style.🏆💪🤝❤️🎉🚀
I'll see you soon with another heist plan, so stay tuned 🤑🐱👤🤗🤩

first target of 2025 roadmap We can sell gold from 2991.58 with 100pips sl and 500 pips tp
By just 2% risk of your balance

BUY AUDUSDIn a daily time frame, the price is breaking the highs and it tends to pull back to the Ote fib level. Now we see it may break the previous high. Au has become some how strong following the USD reporting negatively in fu damentals.
Let us observe how it will play

Copper (HG): Red Metal Rally or Rusty Bet?(1/9)
Good afternoon, everyone! ☀️ Copper (HG): Red Metal Rally or Rusty Bet?
With copper at $4.88 per pound, is this industrial darling a steal or a trap? Let’s dig into the dirt! 🔍
(2/9) – PRICE PERFORMANCE 📊
• Current Price: $ 4.88 per pound as of Mar 13, 2025 💰
• Recent Move: Up slightly this week (Mar 10-13), per data 📏
• Sector Trend: Industrial metals volatile, with tariff impacts 🌟
It’s a mixed bag—let’s see what’s driving the price! ⚙️
(3/9) – MARKET POSITION 📈
• Global Demand: Key in construction, electronics, renewable energy ⏰
• Supply Dynamics: Major producers in Chile, Peru, China; tariff risks loom 🎯
• Trend: Green energy demand up, but economic slowdowns could dampen growth 🚀
Firm in its industrial roots, but facing new challenges! 🏭
(4/9) – KEY DEVELOPMENTS 🔑
• Trade War Escalation: U.S.-China tensions on Mar 13, 2025, per data, could hit supply chains 🌍
• China’s Response: Uncertain, but likely to affect prices due to its role in copper 📋
• Market Reaction: Prices volatile but up slightly, indicating cautious optimism 💡
Navigating through geopolitical storms! 🛳️
(5/9) – RISKS IN FOCUS ⚡
• Economic Slowdown: Reduced industrial activity could lower demand 🔍
• Supply Disruptions: Tariffs or geopolitical issues could disrupt supply, per data 📉
• Substitution: Other materials or technologies could reduce copper’s importance ❄️
It’s a risky ride, but potential rewards are there! 🛑
(6/9) – SWOT: STRENGTHS 💪
• Increasing Demand from Green Energy: Solar panels, wind turbines, EVs require copper 🥇
• Industrial Staple: Essential in construction and electronics, ensuring steady demand 📊
• Price History: Historically, copper has been a good long-term investment, especially during expansions 🔧
Got solid fundamentals! 🏦
(7/9) – SWOT: WEAKNESSES & OPPORTUNITIES ⚖️
• Weaknesses: Price volatility due to economic cycles and supply disruptions 📉
• Opportunities: Expansion in emerging markets, new applications in tech and infrastructure 📈
Can copper shine through the challenges? 🤔
(8/9) – 📢Copper at $4.88 per pound—your take? 🗳️
• Bullish: $5+ soon, green energy boom drives prices up 🐂
• Neutral: Steady, risks and opportunities balance out ⚖️
• Bearish: $4 looms, economic slowdown hits demand 🐻
Chime in below! 👇
(9/9) – FINAL TAKEAWAY 🎯
Copper’s $4.88 price reflects a mix of optimism and caution 📈. With green energy demand rising but economic and geopolitical risks lingering, it’s a volatile market. DCA-on-dips could be a strategy to average in over time, banking on long-term growth. Gem or bust?

Likely deeper NVDA drop on Tues. Bluffs or Tariffs!The Daily chart is Bearish! The northern corrective wave 4 could be over and ready for a wave 5 drop! The fall has some volume & momentum...

GBPUSD : 2 Possible Scenarios for GBPUSDGBPUSD : 2 Possible Scenarios for GBPUSD
On January 13, 2025, GBPUSD began a price reversal for the bullish wave, and since then, it has been on a continuous rise.
However, in recent days, GBPUSD has paused, suggesting it might undergo another significant correction, similar to previous months before resuming its upward trend. Given the current data, it seems unlikely that GBPUSD will change its bullish trend.
Scenario 1:
GBPUSD may consolidate between 1.2860 and 1.2965 before another substantial bullish wave occurs.
Scenario 2:
If GBPUSD breaks below 1.2860, it could decline to around 1.2735 before potentially rising from that zone.
Today, with the US CPI data release, the situation becomes more complex, adding uncertainty to how the market may interpret the data.
You may find more details in the chart!
Thank you and Good Luck!
❤️PS: Please support with a like or comment if you find this analysis useful for your trading day❤️
Disclosure: I am part of Trade Nation's Influencer program and receive a monthly fee for using their TradingView charts in my analysis.

U.S. Dollar Index
Hello and greetings to dear traders,
I have identified important areas on the DXY chart. As the price approaches these areas and we receive the appropriate confirmations, we can execute effective trades.
Key Areas:
Strong Area for Selling:
Secret Order Block (4H): 103.979 and 104.064
Liquidity (4H): 104.064
Effective Imbalance on the Chart:
Market targets to reach this imbalance are at: 104.558 and 104.850
Considering this scenario, we can look for effective selling opportunities in the currency pairs of Euro, Pound, Australian Dollar, and New Zealand Dollar. I will send you updates with these charts for more information.
Thank you for your support. A very simple and clear chart has been drawn for your use.
Wishing you all success!
Fereydoon Bahrami
A retail trader in the Wall Street Trading Center (Forex)
Risk Disclosure:
Trading in the Forex market is risky due to high price volatility. This analysis is solely my personal opinion and should not be considered financial advice. Please do your own research. You are responsible for any profits or losses resulting from this analysis.

Did someone say, BEAR MARKET?!Oh yeah! I think it's time to start talking about the possibility and likelihood of the reality we are seeing. I enjoy doing more educational and analytical posts, and my goal this year was to do more of them again—so here we go, round two of 2025!
Let’s Talk About the Market
It's selling, in case you hadn’t noticed. Some may say “correction,” but I say tomato, tom-ah-to. The reality is that a bear market is, at its core, a correction. Historically, bear markets haven’t just started for no reason. It’s not like the S&P 500 wakes up one day and has this conversation with the NASDAQ:
S&P: Yo, Nazzy.
NAZ: What?
S&P: Let’s do something new.
NAZ: What?
S&P: Let’s tank and shake the whole world. You up for it?
NAZ: I don’t... I don’t know, I don’t think...
S&P: Nah, nah, trust me. It’ll be funny. Let’s ruin some 401(k)s and give the economy a real shock. It’ll be hilarious! You in?
NAZ: I... I don’t... fine, I guess. 🙄
Yeah, no. The reality is that bear markets result from multiple factors, such as:
Bubbles
Over-exuberance
Changing economic conditions
Changing geopolitical factors
Many other interconnected influences
Every bear market in the long history of the S&P has been the result of several of these factors combined. No bear market ever materialized out of thin air. While some crashes have occurred for questionable reasons—such as Black Monday in the 1980s—true bear markets typically result from a prolonged accumulation of unsustainable growth.
This could be due to:
Outpricing the average investor (which the S&P currently does).
Being fueled by speculative innovation (we have AI hype today, just as the ‘90s had dot-com hype).
Becoming disproportionately large compared to the actual monetary supply in which it operates (as of 2025, the S&P 500 is valued higher than the U.S. money supply—more on that later).
So, as you can see, we have some basis for a bear market thesis here.
Blame Trump?
I see a lot of people blaming Trump, so let me preface this—I don’t support him, but I’m not about to make this a politically fueled post because that would distract from the real issue at hand. The reality is that he’s not the root cause of the market’s decline.
These structural factors existed pre-Trump and will exist post-Trump once this correction is complete. However, while he may not be the root cause, he is certainly throwing fuel on the fire.
His obsession with tariffs, economic instability, and personal financial gains (cough crypto cough) has arguably added to the growing lack of confidence in the market. Investors and hedge funds aren’t dumb—when Warren Buffett and other major firms pulled out before the decline started, that should have been the first warning sign.
The market was already reaching astronomically high valuations. However, recovery may take longer when the leader of the economy is actively contributing to instability rather than fostering confidence.
The Crypto Situation—A Warning Sign
What Trump did with crypto raises serious concerns. If crypto can be manipulated for personal gain, who’s to say the NYSE itself won’t be next?
Elon Musk and others have already gotten away with market manipulation, setting a dangerous precedent of complacency from the SEC. In my opinion, investor confidence should have eroded long ago.
To put numbers behind this sentiment, the American Association of Individual Investors conducts a weekly survey on investor sentiment. As of March 13, 2025, results show:
Only 19% of investors are bullish
60% are bearish
This marks the 4th consecutive week of majority bearish sentiment
Complex Market Dynamics
There’s a lot happening right now that complicates the situation. Months ago, I posted a video about the US Money Supply vs. the S&P 500, available here:
In this video, I discuss how overextended the market is relative to the US money supply. The only way to sustain current valuations would be to drastically increase the money supply.
But here’s the problem:
📌 Increasing the money supply = higher inflation
With the US already narrowly avoiding recessions since 2022, increasing the money supply further would exacerbate inflation, leading to even greater economic instability.
Check out this chart I plotted, showing US Money Supply (green) vs. Inflation (red):
As you can see, whenever the money supply increases, inflation follows.
Tariffs & The Economy
Many people assume that tariffs increase the money supply—but that’s not how it works. The USA is not self-sufficient (no country is), and it still relies on imports.
Who actually pays the tariff? Not the foreign country—the domestic consumers do.
For example, when an American buys a product made in China, they pay the tariff cost, which is then sent back to China. It’s a net-zero game that hurts both economies without providing any real financial advantage.
Let’s Get Mathy 🤓
Now, let’s bring in the math.
In my last money supply video, I used visual scaling and qualitative comparison. But for a rigorous analysis, we need to:
Assess cointegration
Ensure stationarity
Develop a cointegrated pair regression
If the US Money Supply and the S&P 500 are cointegrated and stationary, we can use the money supply to predict the S&P’s valuation.
And guess what? They are.
Using the Augmented Dickey-Fuller test (for stationarity) and the Johansen Cointegration Test, we get positive results:
This confirms a strong relationship between US Money Supply & the S&P 500 across multiple cointegrated vectors.
The Cointegration Equation
Running a cointegration regression in R, we get this equation:
📌 y = 2.046e-10x - 1.492e+02
Where X = current money supply and Y = expected S&P 500 valuation.
Plugging in today’s money supply gives us an expected S&P value of 4,262.571.
Accounting for error range (σ = 294.8):
Upper Bound: 4,557.371
Lower Bound: 3,967.771
I’ve incorporated this equation into PineScript to show you here:
Will the S&P Correct to the Money Supply?
Not necessarily. Money supply is dynamic, and as it increases, so will the expected S&P valuation.
This relationship will persist until equilibrium is restored. We can see this in historical data:
The Verdict
This is a much-needed correction—or bear market, call it what you want.
The S&P’s growth rate was unsustainable, especially in relation to:
The US Money Supply
Speculative AI-driven hype
Economic & geopolitical instability
Whether the S&P falls all the way to equilibrium or they meet somewhere in the middle remains to be seen. But one way or another—equilibrium will be restored.
This post is already long enough, so I’ll leave it at that!
Thanks for reading, and as always—safe trades! 🚀

It seems that the time has come for the gold chart to declineIt seems that the time has come for the gold chart to decline and break through all the levels marked with the blue line. If my analysis is correct, the Russia-Ukraine war will most likely come to an end, and the U.S. economy will enter a period of growth.

EUROUSD 4H LONG (ALL Targets DONE)This position worked perfectly.
Now it is important to wait for the correction structure, as it was indicated in the previous update post:
Considering the current formations on the 1D TF, the probability of price growth to the current maximum increases multiple times. Locally, I expect to see a price correction (a rollback next week) and preferably with a depiction of a bullish imbalance. After which, you can work long for a whole month until 1.12758

ZILUSDT at a Breaking Point: Deeper Drop or a Surprise Reversal?Yello! Is ZILUSDT about to sink further, or are the bulls preparing for a comeback? The price action is flashing critical signals, and a major move is brewing traders, stay sharp.
💎#Zilliqa remains under heavy bearish pressure, struggling to reclaim the key $0.01503 resistance level. The price is trading below both the 50 and 200 EMAs, reinforcing the downtrend and showing that sellers are still in control. If GETTEX:ZIL fails to hold above the current trendline, it will likely retest $0.01278, where a rejection could send it lower. Until $0.01503 is reclaimed and sustained, the risk of further downside remains high.
💎The next major support sits at $0.01032, where a temporary bounce could occur. This is a crucial level, as it marks a strong historical support zone. However, if selling pressure persists, ZIL could drop further to $0.00879, a key accumulation area where bulls might step in—or where the bearish trend could deepen even further.
💎For the bulls to regain control, it must reclaim $0.01503 and break past the supply zone. A sustained push beyond this level, backed by strong buying momentum, could hint at the start of a trend reversal. However, a true shift in momentum will only be confirmed if ZIL closes above $0.01503, reclaims the 200 EMA, and invalidates the current bearish setup.
Patience is everything, traders. The biggest profits come from waiting for confirmation, not chasing every small move. Play it smart and stay disciplined only the prepared will win in the long run.
MyCryptoParadise
iFeel the success 🌴

AUDNZD Long Swing PositionEntry: 1.10097
Stop Loss: 1.09252
Take Profit 1: 1.11263
Take Profit 2: 1.12104
Take Profit 3: 1.13211

3/13/25 - $path - meh. tough call... pass?3/13/25 :: VROCKSTAR :: NYSE:PATH
meh. tough call... pass?
- snagged a meager position of this AH -16 or so %
- read the transcript. i'm just not impressed. all this "cash generation" is just going to buying back shares of so much stock comp. and honestly, blaming "macro economic" situation for budget decisions being kicked (which that may be true) is just nothing i want to get involved in.
- god bless if their agentic stuff is catching wind, but it sounds like it's not a needle mover and TBH the tools are getting so good that might be tough to compete so they better speed this TF up
- hoping it opens in the same range i bought it... cathie can keep holding it, it's so tough to own any sofware in this tape that's not scale/ network effect stuff (e.g. FB - social or BTC - money... etc.)
anyone actually use this and think it's worth a deeper look?
V

GOLD SELL NOW/ GOLD OVER-BOUGHT/ BEARISH ZONEere are some key reasons to sell gold now:
1. Stronger USD: A rising dollar pressures gold prices.
2. Hawkish Fed: Higher interest rates reduce golds appeal. .
3. Easing Geopolitical Risks: Less demand for safe haven assets.
4. Bearish Teachinacls: RSI, moving averages, and trendline signal downside.

GBPUSD cpi and ppi effects on the dollar.Price Movement: The price opened and traded lower during the Asian and London sessions, tapping into a 1-hour order block (1.29434) and a 15-minute fair value gap (FVG).
Key Levels:
London Low Liquidity: 1.29415
1-Hour Order Block: 1.29434
15-Minute BISI Consequent Encroachment: 1.29394
Targets:
Asian Highs: 1.29740
CPI High: 1.29870
Economic Indicators: The recent CPI data created a high that might be targeted. Additionally, the PPI is due today, and the sentiment is negative, potentially weakening the dollar.

Breakdown Confirmation & Next Key Levels!#BTCUSDT
Bitcoin is currently displaying bearish momentum following a parabolic rounding top pattern, leading to a decisive break below the $81,000 support zone.
🔍 Technical Analysis:
📉 Breakdown from Support: BTC failed to hold its key support and is now facing a lower high rejection, confirming further downside.
📈 Potential Retest: Expecting a retest of the $81,000 area before continuing lower.
📊 Targeting $78K - $77.5K: This area is a critical demand zone where we could see buying interest and potential reversal signs.
📌 Trading Plan:
Short Scenario:
🔻 Entry: Retest near $81,000 - $81,200
🔻 Stop Loss: Above $82,000
🔻 Take Profit: $78,000 - $77,500
Long Scenario (If BTC Rebounds):
🔹 Look for bullish signs near $78K
🔹 Possible bounce back towards $80K+
🧐 Market Sentiment:
🔺 Bullish if: BTC holds $78K and reclaims $81K.
🔻 Bearish if: BTC loses $77.5K, opening the door to $75K next.
What’s your outlook? Comment below! 🚀📉

BTCUSDT SHORT (FIXED 1-ST target NOW) I fix the 1st take at $80,913 and move the stop order to breakeven .
1- the position itself is correct, but such manipulations with the news background and constant volume shift do not allow to correctly assess the moment of price reversal
2- Key markings before opening the position also took the format of price manipulation and should not have reached the value of $84,000 again in a normal market
In this regard, I decide to secure the position and take part of the profit in order to calmly continue trading while respecting the risks .
Main overview:
Further targets remain unchanged

Gold surges, just $17 away from $3,000 Gold is sprinting to new all-time highs and approaching the $3000 level. The price has just reached $2983 at the time of writing, just $17 away from the key $3000 level.
Alex Ebkarian from Allegiance Gold forecasts “prices to trade between $3,000 and $3,200 this year,”.
Momentum is currently being driven by uncertainty around Trump tariffs and stalled ceasefire talks with Vladimir Putin, who has outlined sweeping conditions for any potential truce.
The upcoming Federal Reserve meeting next Wednesday could also be influencing prices. While the central bank is expected to keep its rate at 4.25%-4.50% until at least June, with the current economic environment, a change in guidance from the Fed might be warranted. A delay in the anticipated June rate cut wouldn't be helpful for the gold price

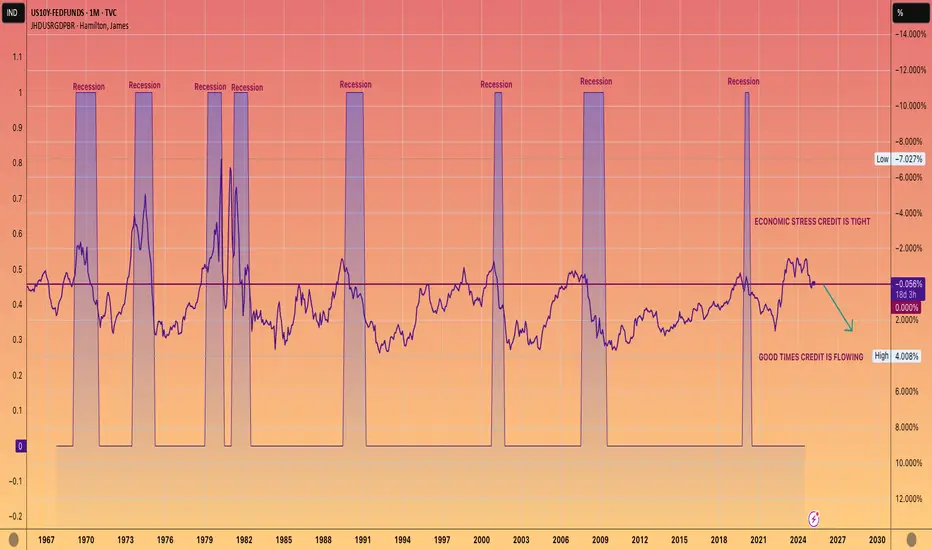
WE ARE COMING OUT OF A RECESSION. NOT GOING INTO ONE.This chart shows 10-year yield, which is closely tied to mortgage rates, minus the Federal funds rate.
When this figure is negative, it typically indicates that we are experiencing a recession or economic downturn.
Conversely, a positive number usually aligns with economic growth, often referred to as the good times.
While it's up to you to determine the reasons behind a official recession not being declared during the Biden administration, the undeniable data reflects a prolonged period of economic strain.
However, the current trend seems to be shifting towards a positive reading, which should lead to more accessible lending and economic growth.
AKA The good times are coming.
BTCUSD sell target successfully done next target 85.000BTCUSD sell target successfully done next target 85.000
We will continue to send accurate signals next Gold target don't miss it
not financial advise trade and manage your owner risk
