DEGOUSDT → An attempt to change the trend will end in a fallBINANCE:DEGOUSDT.P tried to break the trend, but faced strong resistance and a weak cryptocurrency market. The fall may continue...
After breaking through the resistance of the descending channel, a bullish momentum (distribution) of 45% is formed, but the price bumps into a strong resistance of 2.11 - 2.18, which forms a trading range. Bears are not ready to give this zone to buyers and put pressure, a false breakout of resistance is formed after a long struggle for this zone and liquidation is formed when the base of 2.0 is broken. Buyers are in the panic zone. If the price fixes below 2.11 - 2.18, the fall in the short or medium term may continue.
Resistance levels: 2.00, 2.18, 2.274
Support levels: 1.75, 1.584, 1.359
The market is generally weak and altcoins are reacting aggressively to local bitcoin movements (the point of which is to gather liquidity before a further fall). BTC has not yet reached a key target, which together with the lack of a bullish driver in the market creates pressure for altcoins.
Regards R. Linda!
Fundamental Analysis

Gold Price Analysis March 13⭐️Fundamental Analysis
Gold prices maintained a positive trend in early European trading on Thursday and remained near the all-time high reached on February 24. The chaotic implementation of US President Donald Trump's trade tariffs and their impact on the global economy continued to drive safe-haven flows into bullion for the third consecutive day.
Meanwhile, fears of a US recession, coupled with signs of a cooling labour market and falling inflation, will allow the Federal Reserve (Fed) to resume its rate-cutting cycle sooner than expected. This, in turn, kept the US dollar (USD) near its lowest level since October 16 touched on Friday and turned out to be another factor supporting non-yielding gold prices.
⭐️Technical Analysis
Gold is correcting to the immediate support zone of 2930 if the support zone is broken 2922 is the next support point before gold price moves to 2910. The resistance zone of 2950 is considered as a barrier before reaching ATH and the daily sell plan is noticed around 2970

EURJPY 13.03.2025- Trump: "I'm not happy with EU"
~+ Trump: "period of transition" (recession fears)
~+ JP Labor union wage increase
- COT
~- Ukraine peace talks optimism

GBP/USD Channel Breakout (14.03.2025)The GBP/USD Pair on the M30 timeframe presents a Potential Selling Opportunity due to a recent Formation of a Channel Pattern. This suggests a shift in momentum towards the downside in the coming hours.
Possible Short Trade:
Entry: Consider Entering A Short Position around Trendline Of The Pattern.
Target Levels:
1st Support – 1.2890
2nd Support – 1.2862
🎁 Please hit the like button and
🎁 Leave a comment to support for My Post !
Your likes and comments are incredibly motivating and will encourage me to share more analysis with you.
Best Regards, KABHI_TA_TRADING
Thank you.

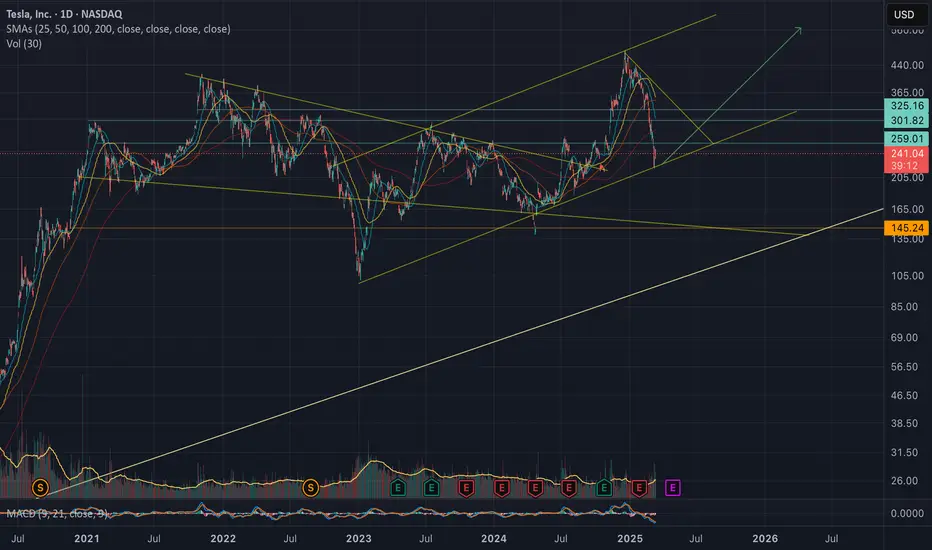
TSLA - Buy the Dip!Despite the political backlash ~ This is a great DIP for TSLA
TSLA broke ATH and has potential for $500 by EOY
Business fundamentals are still strong
and most importantly, they now have the president in their pocket
Bullish!
Gold closes in on $3K after fresh breakoutGold finally ended weeks of consolidation to break to new record highs today.
It is now looking increasingly likely to reach and potentially surpass the $3,000 level in the coming days. The US dollar continues to remain largely under pressure and with yields declining and stock markets volatile, it remains an overall positive environment for the safe-haven metal.
Traders will continue to monitor the ongoing trade war between the US, and basically the rest of the world, for clues. This week, we have had weaker US inflation data, adding to the recent weakness in data. If we continue to see weakness in US data, then this is something that could well keep gold prices supported.
Countering this, could be any major de-escalation in the trade war, or progress in peace talks between Russia and Ukraine. These factors could reduce the metal’s haven appeal in favour of the more risk-sensitive stock markets.
From a technical point of view, the path of least resistance will be to the upside unless the market structure of higher highs and higher lows break. Key support now comes in at $2929-$2956, an area which was previously resistance. The bullish trend line is the line in the sand for me. A break below it, especially beath the most recent low of $2880 would mark a shift in the trend.
By Fawad Razaqzada, market analyst with FOREX.com


XPD/USD "The Palladium" Metals Market Heist Plan🌟Hi! Hola! Ola! Bonjour! Hallo! Marhaba!🌟
Dear Money Makers & Robbers, 🤑 💰💸✈️
Based on 🔥Thief Trading style technical and fundamental analysis🔥, here is our master plan to heist the XPD/USD "The Palladium" Metals market. Please adhere to the strategy I've outlined in the chart, which emphasizes long entry. Our aim is the high-risk Red Zone. Risky level, overbought market, consolidation, trend reversal, trap at the level where traders and bearish robbers are stronger. 🏆💸Book Profits Be wealthy and safe trade.💪🏆🎉
Entry 📈 : "The heist is on! Buy above (960.00) then make your move - Bullish profits await!"
however I advise to placing the Buy Stop Orders above the breakout Level (or) placing the Buy limit orders within a 15 or 30 minute timeframe, Entry from the most Recent or Swing low or high level should be in retest.
Stop Loss 🛑:
Thief SL placed at the recent / nearest low level Using the 4H timeframe (930.00) swing trade basis.
SL is based on your risk of the trade, lot size and how many multiple orders you have to take.
Target 🎯: 1010.00 (or) Escape Before the Target
🧲Scalpers, take note 👀 : only scalp on the Long side. If you have a lot of money, you can go straight away; if not, you can join swing traders and carry out the robbery plan. Use trailing SL to safeguard your money 💰.
XPD/USD "The Palladium" Metals Market is currently experiencing a bullish trend,., driven by several key factors.
📰🗞️Read the Fundamental, Macro Economics, COT Report, Seasonal Factors, Intermarket Analysis, Sentimental Outlook, Future trend predict.
Before start the heist plan read it.👉👉👉
📌Keep in mind that these factors can change rapidly, and it's essential to stay up-to-date with market developments and adjust your analysis accordingly.
⚠️Trading Alert : News Releases and Position Management 📰 🗞️ 🚫🚏
As a reminder, news releases can have a significant impact on market prices and volatility. To minimize potential losses and protect your running positions,
we recommend the following:
Avoid taking new trades during news releases
Use trailing stop-loss orders to protect your running positions and lock in profits
💖Supporting our robbery plan 💥Hit the Boost Button💥 will enable us to effortlessly make and steal money 💰💵. Boost the strength of our robbery team. Every day in this market make money with ease by using the Thief Trading Style.🏆💪🤝❤️🎉🚀
I'll see you soon with another heist plan, so stay tuned 🤑🐱👤🤗🤩

GOLD Scenario 13/03/2025English : According to our analysis, we anticipate a BULLISH scenario.
Morocan Darija : kanchofo d'apres l'analyse dyalna antsanaw TLOO3
ATENTION : I only share my ideas, not signals.

The Next Leg nas100To me this is very bullish (break and retest on lower time frames and even the 6month chart is showing a retest to the last candle close) Im looking for a 50 percent push back up on the bearish candle on the 6month chart and if we continue i will continue to hold and close partials

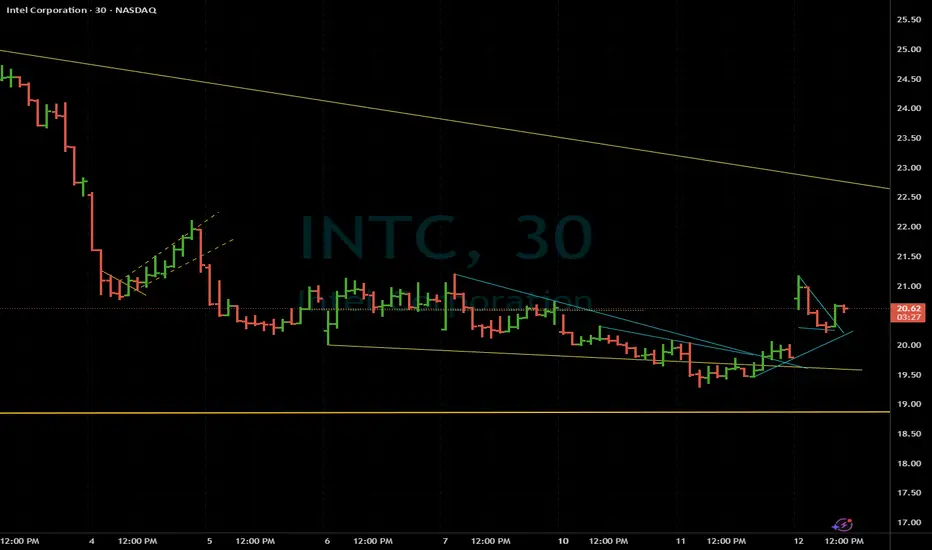
INTC | If Keeps This up it will get Past it's Technical IssuesINTC makes CNBC news as top mover today 3-12-25, it needs the attention, why... if Intel keeps this up it will get past it's technical issues which I think it will; buyout rumors are very real and possible and it's getting the attention it DOES deserve, I think it surprises the market with moves higher. Apple or Samsung could use all the patents and history on this mega-company, at this price I feel it's a steal absolutely. Someone must be eying taking it out outright IMO.
Strong technicals are forming right here and now.
XNG/USD "Natural Gas" Energy Market Robbery Plan🌟Hi! Hola! Ola! Bonjour! Hallo! Marhaba!🌟
Dear Money Makers & Thieves, 🤑 💰🐱👤🚀
Based on 🔥Thief Trading style technical and fundamental analysis🔥, here is our master plan to heist the XNG/USD "Natural Gas" Energy Market. Please adhere to the strategy I've outlined in the chart, which emphasizes short entry. Our aim is the high-risk Green Zone. Risky level, oversold market, consolidation, trend reversal, trap at the level where traders and bullish thieves are getting stronger. 🏆💸Book Profits Be wealthy and safe trade.💪🏆🎉
Entry 📈 : "The heist is on! Wait for the breakout (4.100) then make your move - Bearish profits await!" however I advise placing Sell Stop Orders below the breakout MA or Place Sell limit orders within a 15 or 30 minute timeframe. Entry from the most recent or Swing high or low level should be in retest.
📌I strongly advise you to set an alert on your chart so you can see when the breakout entry occurs.
Stop Loss 🛑: Thief SL placed at (4.400) swing Trade Basis Using the 2H period, the recent / swing high or low level.
SL is based on your risk of the trade, lot size and how many multiple orders you have to take.
Target 🎯:
🏴☠️Primary Target - 3.600 (or) Escape Before the Target
🏴☠️Secondary Target - 3.200 (or) Escape Before the Target
🧲Scalpers, take note 👀 : only scalp on the Short side. If you have a lot of money, you can go straight away; if not, you can join swing traders and carry out the robbery plan. Use trailing SL to safeguard your money 💰.
📰🗞️Read the Fundamental, Macro Economics, COT Report, Global Market Analysis, Sentimental Outlook, Intermarket Analysis, Additional Tools and Resources, Inventory and Storage Analysis, Next Trend Move:
⛽XNG/USD "Natural Gas" Energy Market is currently experiencing a Neutral trend., driven by several key factors.
⭐☀🌟Fundamental Analysis⭐☀🌟
Supply and Demand: The current supply and demand dynamics suggest a surplus in the market, leading to downward pressure on prices.
Production and Storage: US natural gas production remains high, while storage levels are above the 5-year average, contributing to the bearish trend.
Weather: Mild winter weather has reduced demand for natural gas, exacerbating the bearish trend.
⭐☀🌟Macroeconomic Factors⭐☀🌟
Economic Growth: Slowing economic growth can lead to reduced energy demand, negatively impacting natural gas prices.
Inflation: Low inflation can lead to lower energy prices, including natural gas.
Interest Rates: Changes in interest rates can impact the cost of production and transportation of natural gas.
⭐☀🌟COT Data⭐☀🌟
Commitment of Traders: As of March 5, 2025, the COT report shows:
Commercial: Net-short 120,000 contracts ( increased by 10,000 contracts from previous week)
Non-Commercial: Net-short 80,000 contracts (increased by 5,000 contracts from previous week)
Managed Money: Net-short 50,000 contracts (increased by 2,000 contracts from previous week)
⭐☀🌟Intermarket Analysis⭐☀🌟
Crude Oil: Natural gas prices often correlate with crude oil prices. A decline in crude oil prices can lead to lower natural gas prices.
US Dollar: A stronger US dollar can make natural gas more expensive for foreign buyers, potentially decreasing demand.
⭐☀🌟Sentiment Factors⭐☀🌟
Market Sentiment: The current market sentiment is bearish, with a majority of traders and analysts expecting lower prices.
Options Data: Options data suggests a bias towards put options, indicating a bearish sentiment.
⭐☀🌟Seasonal Factors⭐☀🌟
Seasonal Trends: Natural gas prices often follow a seasonal pattern, with prices tend to rise during the winter months (December to February) and fall during the summer months (June to August).
⭐☀🌟Additional Tools and Resources⭐☀🌟
Technical Indicators: RSI (14) is at 30, indicating an oversold condition.
Chart Patterns: A bearish flag pattern is forming on the daily chart.
⭐☀🌟Next Trend Move and Future Trend Prediction⭐☀🌟
Short-Term Targets
Primary Target: $3.80
Secondary Target: $3.50
Ultimate Target: $3.20
Medium-Term Targets
Primary Target: $3.00
Secondary Target: $2.80
Ultimate Target: $2.50
Long-Term Targets
Primary Target: $2.20
Secondary Target: $2.00
Ultimate Target: $1.80
⭐☀🌟Overall Summary and Outlook⭐☀🌟
The overall outlook for XNG/USD (Natural Gas) remains bearish, driven by a combination of fundamental, technical, and sentimental factors. While there are potential risks and uncertainties, the current trend and market sentiment suggest lower prices in the short to medium term.
📌Keep in mind that these factors can change rapidly, and it's essential to stay up-to-date with market developments and adjust your analysis accordingly.
⚠️Trading Alert : News Releases and Position Management 📰 🗞️ 🚫🚏
As a reminder, news releases can have a significant impact on market prices and volatility. To minimize potential losses and protect your running positions,
we recommend the following:
Avoid taking new trades during news releases
Use trailing stop-loss orders to protect your running positions and lock in profits
💖Supporting our robbery plan 💥Hit the Boost Button💥 will enable us to effortlessly make and steal money 💰💵. Boost the strength of our robbery team. Every day in this market make money with ease by using the Thief Trading Style.🏆💪🤝❤️🎉🚀
I'll see you soon with another heist plan, so stay tuned 🤑🐱👤🤗🤩

Falling wedge on the daily indicates relief is on the wayObvious falling wedge here gives us hope, however we could still see a bleed off to around 70k before we get a pump out of the formation.
Dumping out of this formation would indicate a bear market in my mind, and fundamentals of Trump/WW3/swine flu/climate catastrophe support that.
Exciting times lol!

GOLD hits Bullish targets, heading for all-time highAs tariff uncertainty pushed money into safe havens, cooling US inflation kept market expectations of a Fed rate cut intact and optimism over a ceasefire between Russia and Ukraine cooled, OANDA:XAUUSD surged and broke out of its recent sideways consolidation trading range.
OANDA:XAUUSD surged past the $2,942/oz target on safe-haven demand. Weaker US CPI data also supported expectations of a Federal Reserve rate cut, pushing gold higher.
The US consumer price index (CPI) rose 2.8% year-on-year in February, slightly below the 2.9% expected and down from January's 3.0%. The year-on-year increase in the core CPI, which excludes volatile food and energy prices, eased to 3.1% from January's 3.3%.
Recent news of a ceasefire between Russia and Ukraine also cooled earlier optimism.
British news agency Reuters reported on Wednesday that Russian officials were skeptical about the U.S. proposal for a 30-day ceasefire in Ukraine. Kremlin spokesman Dmitry Peskov said on Wednesday that the Kremlin was still waiting for the United States to announce its proposal for a ceasefire in Ukraine. The Kremlin needs to hear the results of the U.S.-Ukraine talks before commenting on whether Russia can accept the ceasefire.
Commenting on a ceasefire proposal that has been accepted by both U.S. and Ukrainian officials, an influential Russian lawmaker insisted on Wednesday that any deal must be reached on Russian terms, not U.S.
A senior Russian source said President Vladimir Putin would be unlikely to agree to a ceasefire proposal without finalizing the terms and receiving some guarantees.
Ukraine accepted a US proposal for a 30-day ceasefire with Russia on Tuesday in exchange for the Trump administration resuming suspended military aid and intelligence sharing. The deal was announced by US and Ukrainian officials after eight hours of talks in Saudi Arabia on Tuesday.
Trump said US officials would meet with their Russian counterparts on Wednesday and he could meet with Russian President Vladimir Putin this week.
The World Gold Council (WGC) revealed that central banks continued to buy gold. The People's Bank of China and the National Bank of Poland added 10 tonnes and 29 tonnes of gold, respectively, in the first two months of 2025.
Traders will next keep a close eye on the release of the US producer price index (PPI) for February, initial jobless claims and the University of Michigan consumer sentiment data.
OANDA:XAUUSD technical outlook analysis
On the daily chart, as of the time of writing, gold has achieved all the bullish targets noted by readers in the weekly publication, along with all the conditions for the possibility of a price increase when there is no more resistance ahead other than the all-time high.
The short-term price channel is noted as the trend at the moment, along with the Relative Strength Index RSI maintaining above 50, surpassing 61, showing that the bullish momentum dominates the market and there is still a lot of room for price increase ahead because it is still quite far from reaching the overbought area.
The most notable supports now are the $2,929 level in the short term, followed by the EMA21 area.
Overall, the uptrend is dominating on the daily chart, with notable price levels listed below.
Support: $2,929 – $2,915
Resistance: $2,956
SELL XAUUSD PRICE 2761 - 2974⚡️
↠↠ Stoploss 2980
→Take Profit 1 2968
↨
→Take Profit 2 2962
BUY XAUUSD PRICE 2904 - 2906⚡️
↠↠ Stoploss 2900
→Take Profit 1 2912
↨
→Take Profit 2 2918

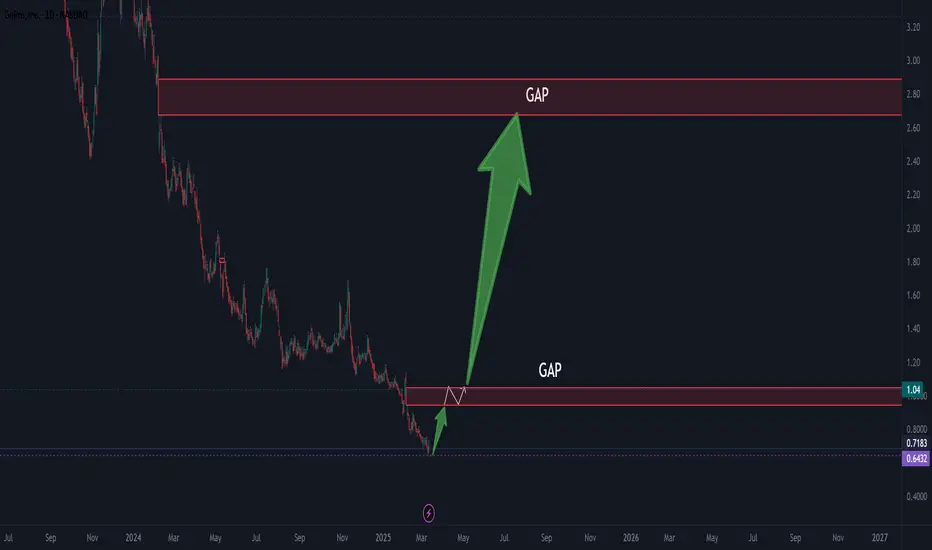
GOPRO faces a significant rise.GoPro Poised for a Strong 2025: Tariff Impact, Cost-Cutting Measures, and Market Dynamics
Summary:
GoPro (NASDAQ: GPRO) is set to emerge as the biggest beneficiary of the new U.S. tariffs on imported electronics. With key competitors such as DJI and Insta360 facing significant cost increases, GoPro’s pricing advantage could lead to market share gains. Additionally, the company's aggressive 30% cost reduction and 15% workforce reduction in late 2024 have positioned it for a return to profitability after a challenging year. With demand stabilizing and a more favorable competitive landscape, GoPro appears well-positioned for a strong 2025.
Tariffs Reshape the Action Camera Market
The U.S. government's new 20-25% import tariffs on Chinese electronics, including action cameras, are expected to have a profound impact on the market. Key GoPro rivals such as DJI, Insta360, and AKASO—who manufacture in China—will be forced to raise prices to offset higher import costs.
DJI's Osmo Action cameras, previously priced around $350, could see retail prices rise to $430 or more.
Insta360's flagship models, once positioned as a mid-tier alternative at $300, may now enter the $375-$400 range.
Budget brands like AKASO and Campark, which used to sell for $90-$100, could now be priced between $110-$125, significantly reducing their appeal to cost-conscious consumers.
Meanwhile, GoPro, despite relying on Asian manufacturing, will face a smaller 10-15% impact. This keeps its HERO lineup competitive, with an estimated post-tariff price increase from $400 to $460—still within reach of its target customer base.
With the pricing gap between GoPro and its competitors shrinking, the company is positioned to reclaim lost market share and drive revenue growth.
Cost-Cutting Measures Pave the Way for Profitability
2024 was a challenging year for GoPro, with declining sales leading to an annual net loss. The company responded with aggressive cost-cutting measures, including:
A 30% reduction in operating expenses, achieved through supply chain optimizations and streamlined marketing spend.
A 15% reduction in workforce, aimed at improving efficiency while maintaining innovation.
These measures are already yielding results, improving the company’s operating margins and reducing the breakeven threshold for profitability.
As a result, 2025 is expected to be the first profitable year for GoPro since 2022, reversing the losses incurred in 2024.
GoPro’s Competitive Edge Strengthens
With the action camera market becoming more favorable for GoPro, the company enjoys multiple tailwinds heading into 2025:
Tariff-Driven Market Share Gains – Competitors like DJI and Insta360 face steeper price hikes, making GoPro a more attractive choice for consumers.
Stabilized Demand – After a post-pandemic slowdown in 2023-2024, action camera demand is expected to rebound in 2025, fueled by travel, content creation, and extreme sports markets.
Subscription Growth – GoPro’s recurring revenue model, driven by its cloud storage and editing services, continues to provide a stable revenue stream.
Restructured Cost Base – The company’s leaner operating model ensures improved profitability, even if revenue growth remains modest.
Valuation and Outlook
GoPro’s stock has underperformed in recent years, but 2025 presents a turning point. With tariffs reshaping the competitive landscape in its favor and cost-cutting initiatives delivering tangible results, investors should expect improved financials and a potential stock price recovery.
Key Metrics to Watch in 2025:
Gross margin expansion as cost reductions take full effect.
Subscription revenue growth, providing a hedge against hardware sales volatility.
Potential market share gains as GoPro strengthens its position against tariff-impacted competitors.
Final Takeaway:
After a challenging 2024, GoPro is on track for a profitable 2025, benefiting from both external market changes and internal restructuring efforts. Investors looking for a turnaround story in consumer electronics should keep a close eye on GoPro as it reclaims its leadership position in the action camera space.
EU | Hourly Timeframe Analysis We are still bullish until we break the hourly swing low. Until that happens, I am still looking for buys. I would like to see price come down further into this hourly order block which also holds a 30M imbalance inside of it, fill that imbalance, get a shift in price on lower time frame, and then ride price back to the swing high. There is some daily resistance not too much higher above the swing high that I marked out so we could see some sell off from that point but we will see.
Trade Safe -Remzy

Litecoin Set to Break Below Support Point- $60 in Sight?Litecoin ( CRYPTOCAP:LTC ) a cryptocurrency that was designed to provide fast, secure and low-cost payments by leveraging the unique properties of blockchain technology is set to go bearish amidst dipping down to the support point should the market continue its bearish pattern, CRYPTOCAP:LTC is set to tanked finding support in the $60- 65 support.
With buying pressure decreasing and Relative Strength Index (RSI) at 31.92, CRYPTOCAP:LTC could be on the cusp of a selling spree.
Similarly, a breakout above the $140 resistance zone could liberate CRYPTOCAP:LTC from the bears thereby aiming new resistant points.
However, data from DefiLama shows about $2.23 million has been locked in Total Value lock (TVL) on the Litecoin ecosystem hinting on a development on the Litecoin chain in the long term. This value shows a level of trust placed on the Litecoin Blockchain.
About Litecoin
Litecoin was released via an open-source client on GitHub on Oct. 7, 2011, and the Litecoin Network went live five days later on Oct. 13, 2011. Since then, it has exploded in both usage and acceptance among merchants and has counted among the top ten cryptocurrencies by market capitalization for most of its existence.
The cryptocurrency was created by Charlie Lee, a former Google employee, who intended Litecoin to be a "lite version of Bitcoin," in that it features many of the same properties as Bitcoin—albeit lighter in weight.
Litecoin Price Live Data
The live Litecoin price today is $87.46 USD with a 24-hour trading volume of $508,275,483 USD. Litecoin is down 3.21% in the last 24 hours, with a live market cap of $6,608,334,524 USD. It has a circulating supply of 75,558,468 LTC coins and a max. supply of 84,000,000 LTC coins.

GOLD/XAUUSD Sell - Early Sell Call - Great RR, Many Short ScalpsGOLD/XAUUSD Dropping soon for next 1 week - I am giving Early Call - Wait for my confirmation.
GOLD/XAUUSD Short after Recent Successful long signal where all TP hits, now Gold is already nearly at high, it could drop forsure but with my back testing of this strategy, it will range here, then give good RED CANDLE ON 1 HOUR, 4 HOUR CANDLE RED, then it will drop big, manage your position accordingly.
Follow for my confirmation call, I will tell exact candle to enter.
Please note: I am taking this trade with my experience and risk management, beginner traders please wait for my confirmation to enter, this trade has great risk to reward and many scalp short enteries as well.
Hey, be careful, its GOLD not some easy instrument.
Use proper risk management
Looks like good trade.
Lets monitor.
Use proper risk management.
Disclaimer: only idea, not advice

Geopolitical and Trade Tensions Reignite Pressure on Wall StreetAfter a brief and limited reprieve observed in the previous session, negative pressures have returned to the U.S. stock market, renewing investor caution. During the current session, the Nasdaq 100 is down 0.6%, while the S&P 500 loses 0.4%, demonstrating the underlying fragility of the market despite recent positive signals on the inflation front.
Although both consumer and producer inflation moderated in February, generating optimistic expectations about potential relief in the Federal Reserve's rhetoric, investors remain skeptical amid persistent geopolitical and trade uncertainty. The recent U.S. protectionist measures, including 25% tariffs on steel and aluminum, have once again heightened global economic risks, exacerbating tensions particularly with key partners such as Canada, China, and the European Union, who have responded with a more confrontational stance, unlike Mexico, which has been more cautious in addressing these new episodes of trade wars.
The market's sensitivity to these risks was evident with the new U.S. threat to impose a 200% tariff on alcoholic beverages from the EU, suggesting that volatility will continue to dominate in the coming sessions.
This complex scenario is expected to be carefully evaluated at next week's FOMC meeting, where the Fed is expected to keep rates unchanged. However, recent inflation data could encourage a more dovish tone regarding future rate cuts. Markets are currently pricing in three rate cuts this year, a divergent expectation from the central bank's stance in December, when it signaled only one. The March meeting will be crucial in assessing whether the Fed aligns more closely with market expectations or maintains a more cautious stance.
Amid these circumstances, the sectors most exposed to uncertainty, such as discretionary consumption and technology, continue to be the most affected. In contrast, the materials sector is showing relatively strong performance.
Looking ahead, focus will remain on how trade and geopolitical tensions evolve, key factors that will determine whether U.S. markets can finally find a turning point to sustainably resume their upward trajectory.
Pepperstone doesn’t represent that the material provided here is accurate, current or complete, and therefore shouldn’t be relied upon as such. The information, whether from a third party or not, isn’t to be considered as a recommendation; or an offer to buy or sell; or the solicitation of an offer to buy or sell any security, financial product or instrument; or to participate in any particular trading strategy. It does not take into account readers’ financial situation or investment objectives. We advise any readers of this content to seek their own advice. Without the approval of Pepperstone, reproduction or redistribution of this information isn’t permitted.

OGDC - LongFrom a technical point of view, the first target should be Rs 237, and the long-term target is Rs 335.
On fundamental grounds, the current fair value of this share should be around Rs 228, but if the circular debt issue is resolved and the company starts giving dividends around Rs 40 - Rs 45 than the fair value will jump to around Rs 350, so it is a good bet both technically and fundamentally.
Do your own research(DYOR)

Trading live nasdaq 13/03/2025in this video we take a short position in nasdaq we hit Tp1 "100" than we move our stop loss to entry point.
we do everyday a Trading live with Edbullish community .

USDJPY 13.03.2025~+ Covering positions before the CPI release
~+ Trump: "period of transition" (recession fears)
~+ JP Labor union wage increase
- COT

BTCUSDT SHORT M15At the moment, the BTCUSDT trading pair is experiencing a distribution moment. Taking into account the liquidity collected at the top, I open a position in SHORT from the POI and FGV m15 I indicated with the target:
80,607.65$
79,058.00$
76,606.00$
Risk for stop order -1%
