Mexican Peso Shows Resilience Despite ChallengesThe Mexican peso advanced 0.35% during the session, demonstrating remarkable resilience amid negative signals from the Mexican industrial sector and economic uncertainties in the United States. However, the near-term outlook for the currency presents considerable challenges.
In Mexico, recent industrial data has raised concerns among investors. The Monthly Indicator of
Industrial Activity (IMAI) fell 0.4% in January, accumulating an annual decline of 2.8%. The most significant deterioration came from the mining and extraction sector, particularly oil and gas, which saw sharp contractions of 8.8% and 10.7%, respectively. Additionally, the construction sector remained weak with an annual drop of 6.7%, while manufacturing declined slightly by 0.8%, with textiles, machinery, and metal goods suffering the most pronounced losses.
On the international front, the recent moderation in U.S. inflation has provided some support to the Mexican peso. The Producer Price Index (PPI) remained unchanged in February, coming in below market expectations. Additionally, the recent slowdown in the U.S. Consumer Price Index (CPI), which fell to an annual rate of 2.8%, reinforces expectations of a potentially more dovish Federal Reserve. This scenario could benefit emerging market currencies, including the Mexican peso.
However, significant risks remain. Global trade tensions and concerns about a potential U.S. recession could drive an increase in risk aversion, negatively impacting the peso in the short term.
Market attention will be focused on the upcoming Federal Reserve monetary policy decision. A dovish stance would clearly favor the peso, while a more aggressive monetary approach would strengthen the U.S. dollar, putting additional pressure on the Mexican currency. For now, the peso has shown resilience, but it will navigate cautiously while awaiting clarity on these key fronts.
Pepperstone doesn’t represent that the material provided here is accurate, current or complete, and therefore shouldn’t be relied upon as such. The information, whether from a third party or not, isn’t to be considered as a recommendation; or an offer to buy or sell; or the solicitation of an offer to buy or sell any security, financial product or instrument; or to participate in any particular trading strategy. It does not take into account readers’ financial situation or investment objectives. We advise any readers of this content to seek their own advice. Without the approval of Pepperstone, reproduction or redistribution of this information isn’t permitted.
Fundamental Analysis

EURUSD technical analysis next move possible EURUSD technical analysis next move possible target 1.09300
Not financial advice

Breaking: $PIKACH Set for a Comeback Built on the Ethereum blockchain, while simply paying homage to an adorable creature we all love and parody- the Pokémon or its creation Pikachu, $PIKACH is set to soar amidst a bounced from the 38.2% Fibonacci retracement that is presently acting as a support point.
A breakout above the 1-month high could catalyse a bullish move with 30% gains in sight.
With the Relative Strength Index (RSI) at 56 this metric validates the bullish thesis on $PIKACH.
Pikaboss Price Live Data
The live Pikaboss price today is $5.40e-8 USD with a 24-hour trading volume of $24,671.20 USD. Pikaboss is down 2.77% in the last 24 hours, with a live market cap of $22,726,087 USD. It has a circulating supply of 420,690,000,000,000 PIKA coins and a max. supply of 420,690,000,000,000 PIKA coins.

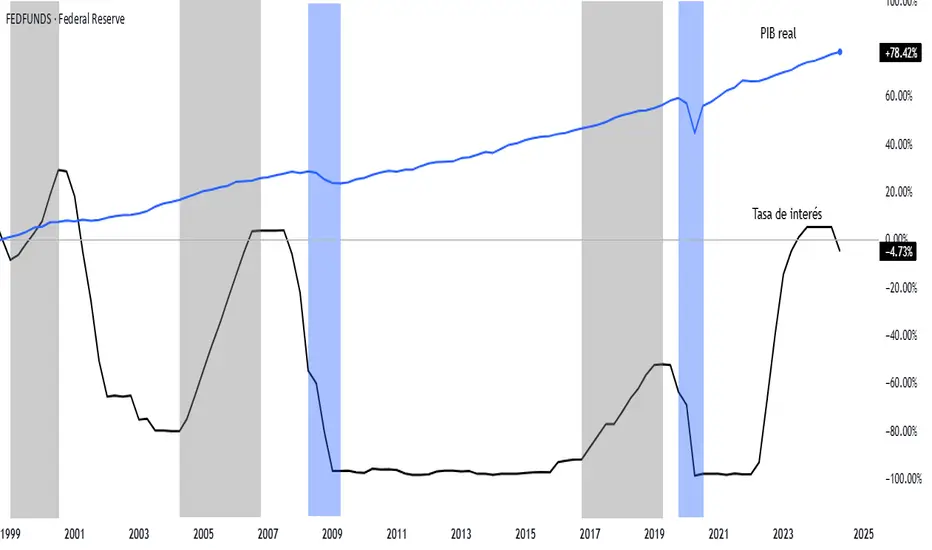
Real GDP vs FED FUNDS RATEReal GDP and the Federal Funds Rate are closely intertwined in the context of economic policy and performance. The Federal Funds Rate, set by the Federal Reserve, is a key tool used to influence economic activity. When the Fed raises the Federal Funds Rate, borrowing costs increase for consumers and businesses, which can slow down spending, investment, and overall economic growth, potentially leading to a moderation in Real GDP growth. Conversely, when the Fed lowers the Federal Funds Rate, it aims to stimulate the economy by making borrowing cheaper, encouraging spending and investment, which can boost Real GDP growth. However, this relationship is not always straightforward, as other factors like inflation, global economic conditions, and fiscal policy also play significant roles. For instance, during periods of economic recovery, low rates may support GDP growth, but if inflation rises too quickly, the Fed may raise rates to cool the economy, even if it risks slowing Real GDP expansion. Thus, the interplay between Real GDP and the Federal Funds Rate reflects the delicate balance the Fed seeks to maintain between fostering growth and controlling inflation.
SP500 vs fedfundsrateThe interest rate and the S&P 500 share a complex yet significant relationship in financial markets. When interest rates rise, the cost of borrowing typically increases for companies, which can reduce their profits and, in turn, put downward pressure on S&P 500 stock prices. Additionally, higher rates make bonds and other fixed-income assets more attractive compared to stocks, potentially leading to a shift of capital away from the equity market. Conversely, when interest rates are low, companies can borrow more cheaply, which tends to boost earnings and, consequently, the performance of the S&P 500. However, other factors such as economic growth, inflation, and market expectations also play a role in this dynamic, making the relationship neither linear nor entirely predictable.

The Hershey Company (NYSE:HSY) - Undervalued nowThe Hershey Company is an American multinational confectionery company, founded by Milton S. Hershey in 1894. The company initially focused on caramel and chocolate, eventually expanding into a wide range of confectionery products.
The company’s headquarters are located in Hershey, Pennsylvania, which is also home to Hersheypark and Hershey’s Chocolate World. ,
Business Model, Products, and Services
The Hershey Company is a leading confectionery manufacturer and marketer. Their core business revolves around producing and selling chocolate, sweets, mints, and other snacks.
Their key product lines include Hershey’s chocolate bars, Reese’s peanut butter cups, Kit Kat, Jolly Rancher, and Ice Breakers.
The company’s business model is centered on brand recognition, product quality, and extensive distribution networks.
Durable Competitive Advantage
Hershey possesses a strong durable competitive advantage primarily due to its iconic brand portfolio. Brands like Hershey’s and Reese’s have decades of consumer loyalty and strong brand recognition.
This aligns with the “unique product” business model, as these brands hold a distinctive place in the confectionery market.
Economic Moat
Hershey’s “economic moat” is built upon its powerful brand identity. The company’s brands have a long-standing history and strong emotional connection with consumers, creating a barrier to entry for competitors. Their distribution network also provides an economic moat.
Industry Outlook, Challenges, and Competitors
The confectionery industry is generally stable, but it faces challenges related to changing consumer preferences (e.g., healthier snacks), rising ingredient costs, and intense competition.
The company’s key competitors include Mondelez International (MDLZ), Kraft Heinz (KHC), Kellogg (K), and Campbell Soup Company (CPB). Additionally, increased competition from smaller, more innovative brands is also contributing to Hershey’s market share decline.
Health trends are a large challenge, sweet snacks have been under pressure as more consumers become aware of their calorie and sugar intake.
Supply chain risks are also a consistent threat for The Hershey Company, as disruptions in the procurement of key raw materials like cocoa, sugar, and dairy could impact production costs and margins. Additionally, geopolitical instability, trade restrictions, and transportation bottlenecks may further challenge the company’s ability to maintain steady inventory levels and meet consumer demand.
Comparative Analysis
The following is a comparative analysis of the company’s financial position and performance. The analysis evaluates eight key financial ratios to determine whether the company possesses a durable competitive advantage. The company’s financial ratios are compared with the median ratios of its main competitors.
Gross Margin %
Hershey maintains a consistent gross profit margin of 42%, which is significantly higher than the competitor average of 33.62%.
A high gross profit margin stems from the company’s durable competitive advantage, allowing it to price its products significantly higher than its competitors while maintaining strong profitability.
R&D to Revenue Ratio %
Hershey’s R&D expenditure is relatively low at 0.5% compared to its competitors’ 0.9%. This suggests that its competitive advantage relies more on brand strength and distribution than on product innovation.
Depreciation to Gross Profit Ratio %
Hershey’s depreciation-to-gross-profit ratio is a reasonable 9.48%, slightly lower than its competitors’ 9.65%, suggesting efficient asset utilization.
Interest Expense to Operating Income Ratio %
Hershey’s Interest Expense to Operating Income Ratio is 7.4%, significantly lower than its competitors’ 16.3%, indicating a strong financial position.
Operating Margin %
Hershey’s operating margin is strong, consistently above 20%. This suggests efficient operations and pricing power.
Free Cash Flow Margin %
Hershey’s free cash flow margin fluctuates, but it consistently remains higher than that of its competitors. This is a strong indicator that Hershey has a durable competitive advantage.
Basic Earnings Per Share (EPS)
Hershey’s EPS shows a generally upward trend, indicating consistent profitability.
Return on Equity (ROE)
Hershey’s ROE is strong and significantly higher than that of its competitors, indicating efficient utilization of shareholder equity.
Based on the analysis of key financial ratios, we have determined the following: The Hershey Company’s financial condition is stronger than that of its competitors. We believe the company holds a competitive advantage within its industry.
Intrinsic Value Valuation
Intrinsic Value: $236.80
Current Price: $171.16
Margin of Safety: 27.72%
Based on the provided data, Hershey’s stock appears to be undervalued, with a significant margin of safety.
The company’s strong brand portfolio, consistent profitability, and efficient operations are positive indicators.
The 27.72% margin of safety provides a good buffer against potential market fluctuations or valuation errors.
Recommendation: Given the current undervaluation and the company’s strong fundamentals, a “buy” recommendation is warranted. However, investors should carefully monitor industry trends, competitive pressures, and potential risks related to changing consumer preferences and ingredient costs.

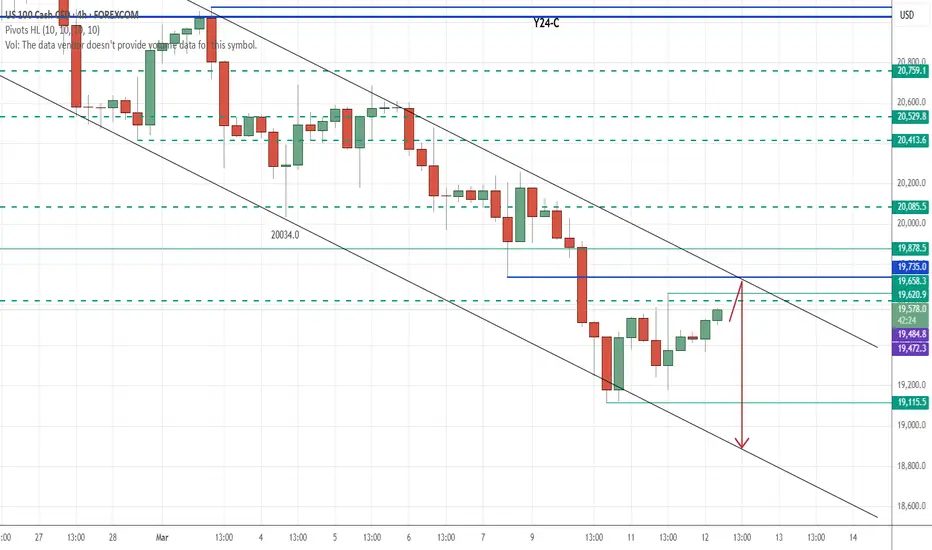
NQ: The gate to the south is still openGood day!
Price is still bearish and ready for going further down.
We've key data in a few with CPI.
1- Any overshoot (and it's expected) will send down NQ.
2- Inline and undershoot will provide a shy bounce and resume down.
The world is witnessing how USA is treating its closest ally and neighbor. In my view, BRICS countries and their allies will benefit from the self-inflicted destruction of USA and to lesser extend Europe.
Trump is making pressure on the FED for free money and rate cuts. March meeting will be extremely relevant.
We got positive news on the ceasefire in Ukraine. If Russia accepts (which is 100% expected), it will boost for ST NQ and equities.
X Empire Breakdown: 40% Drop Targeting 0.000025Hello and greetings to all the crypto enthusiasts, ✌
All previous targets were nailed ✅! Now, let’s dive into a full analysis of the upcoming price potential for X Empire 🔍📈.
The X Empire has exhausted all its key support levels, and I project an additional decline of at least 40% moving forward. The primary target for this downturn is 0.000025. Following this, I anticipate a phase of consolidation, characterized by range-bound price action and the potential establishment of a parallel channel.📚🙌
🧨 Our team's main opinion is: 🧨
X Empire has lost all support, with a 40% decline expected to 0.000025, followed by consolidation and a possible parallel channel.📚🎇
Give me some energy !!
✨We invest hours crafting valuable ideas, and your support means everything—feel free to ask questions in the comments! 😊💬
Cheers, Mad Whale. 🐋

US30 SCENARIO 13/03/2025English : According to our analysis, we anticipate a BEARISH scenario.
Morocan Darija : kanchofo d'apres l'analyse dyalna antsanaw lhboot
ATENTION : I only share my ideas, not signals.

FILUSDT - Buy now or regret later!FIL is literally one of the hidden gems in the market.
The probability of a strong rebound is increasing significantly in the coming days. The coin has reached its strongest support level, a key historical reversal point.
Investing in it now is a golden opportunity, with a target of $27.
The bottoms have already formed across many altcoins—now is the best time to buy
Best regards Ceciliones🎯

EURUSD scenario 13/03.2025We see two possible scenarios: bullish and bearish, and I'm waiting for the bearish scenario

Nasdaq Long-Term Elliott Wave AnalysisNasdaq Long-Term Elliott Wave Analysis
Hello, this time I’m looking at the long-term Elliott Wave for the Nasdaq.
On the weekly candle chart, it seems like the long-term Impulse 5 wave, which started in 2003, is coming to an end. Even when breaking it down into yellow sub-waves, everything aligns correctly, and all Elliott Wave rules are properly applied.
Beginners may not fully understand, but in Elliott Wave theory, Impulse 5 waves must also contain a 5-wave subdivision. Although I haven't marked all the counts to keep the chart clean, if you count them yourself, they should all be correct.
A strong piece of evidence supporting this view is that wave 4 of the blue wave 5 retraced to around the 0.382 level. The yellow wave 4 also retraced to around 0.382, which further confirms this analysis.
The issue here is that if this assumption is correct and wave 5 of the Elliott Wave has completed, then the Nasdaq could potentially drop to around 14,000. There is a possibility of it following a green ABC correction.
For this green ABC correction to be valid, it must be larger in both size and duration than wave 4 of the blue wave, because this correction belongs to a higher-degree wave. Based on this calculation, the decline could last until at least 2028. If we’re lucky, the green wave B retracement might push higher and form a flat correction, ideally ending at the 16,000 resistance level.
From a fundamental perspective, Trump continues to talk about tariffs, which is not a positive factor for the market.
However, if we consider the red circle as wave 1, then the green correction might end at the 0.382 (14,000) retracement level, and another 5-wave rally could follow. If that happens, good times will return.
For some hope, we could also consider that the blue wave 5 has not yet finished, and there might be another push higher, as indicated by the orange wave 5 scenario. To confirm this, we should monitor the price action around the 18,000 level—if a 5-wave upward structure appears, then an extended rally might still be possible.
If 18,000 is broken easily, then there is little hope left. Given the current global situation, the only bullish scenario would be Trump partially rolling back his tariff policies.
It might not be the best news, but as traders, whether we go short or take other strategies, the goal is to make money—so there's no need to worry too much.
May luck be on your side!

Gold Outlook: Potential Losses Ahead! VANTAGE:XAUUSD Gold is showing signs of weakness, and I anticipate further losses in the coming days.
At the last peak, we formed a clear bearish engulfing candle, signaling a potential trend shift. Following this, the price is now retesting the resistance zone at the previous high while also sweeping the remaining side liquidity.
🔸 Key Levels to Watch:
📍 If the price takes out Tuesday’s high (13.03), I will look for confirmation to enter a sell trade targeting the Equal Low—as highlighted in the chart.
⚠️ Potential Scenario: If resistance holds, we could see a strong downside move. However, if bulls regain control, a breakout above resistance might change the outlook.
📉 Do you agree with this setup, or do you see a different scenario? Let me know in the comments! Your thoughts are always welcome. 👇🔥

ETH BUYThe idea is - to collect as much ethereum as we can, cause there are upcoming bull run for eth with main 3 targets, with the latest may 2026. At least we can make 200%, or x3 on that altcoin. Here are three main goals for the price of ethereum:
Target 1 - 7000
Target 2 - 17000
Target 3 - 42000

TSLA Long IDEAOur strategy is a confidential mix of TA & FA. Refer to the links in bio for more information including access to premium ideas.

XCU/USD "The Copper" Metals Market Heist Plan🌟Hi! Hola! Ola! Bonjour! Hallo! Marhaba!🌟
Dear Money Makers & Robbers, 🤑 💰💸✈️
Based on 🔥Thief Trading style technical and fundamental analysis🔥, here is our master plan to heist the XCU/USD "The Copper" Metals market. Please adhere to the strategy I've outlined in the chart, which emphasizes long entry. Our aim is the high-risk Red Zone. Risky level, overbought market, consolidation, trend reversal, trap at the level where traders and bearish robbers are stronger. 🏆💸Book Profits Be wealthy and safe trade.💪🏆🎉
Entry 📈 : "The vault is wide open! Swipe the Bullish loot at any price - the heist is on!
however I advise to Place buy limit orders within a 15 or 30 minute timeframe most recent or swing, low or high level. I Highly recommended you to put alert in your chart.
Stop Loss 🛑:
Thief SL placed at the recent / nearest low level Using the 4H timeframe (9500) swing trade basis.
SL is based on your risk of the trade, lot size and how many multiple orders you have to take.
Target 🎯: 10050 (or) Escape Before the Target
🧲Scalpers, take note 👀 : only scalp on the Long side. If you have a lot of money, you can go straight away; if not, you can join swing traders and carry out the robbery plan. Use trailing SL to safeguard your money 💰.
📰🗞️Read the Fundamental, Macro Economics, COT Report, Seasonal Factors, Intermarket Analysis, Sentimental Outlook:
XCU/USD "The Copper" Metals Market is currently experiencing a bullish trend,., driven by several key factors.
⭐Fundamental Analysis⭐
Overview: Fundamental analysis of XCU/USD involves evaluating the intrinsic value of copper based on economic, industrial, and external influences. At $9.70/lb, copper is at an unusually high level, suggesting strong demand, supply constraints, or external pressures.
Economic Growth: Copper is a key industrial metal tied to global GDP growth, particularly in manufacturing, construction, and electrification (e.g., EVs, renewable energy). A price of $9.70 could reflect robust economic expansion, especially in emerging markets like China and India.
Inflation and Currency: High inflation in 2025 could weaken the USD, pushing commodity prices like copper higher. Alternatively, a strong USD might temper this rise unless offset by other factors.
Industrial Demand: Increased demand from green energy (e.g., solar, wind, EVs) and infrastructure projects could justify this price.
Supply Constraints: Disruptions in major copper-producing countries (e.g., Chile, Peru) or reduced mining output could tighten supply, driving prices up.
⭐Macroeconomic Factors⭐
Interest Rates: If the Federal Reserve maintains high rates in 2025 to combat lingering inflation, this could strengthen the USD, typically pressuring commodity prices downward. However, at $9.70, demand might outweigh this effect.
Global Growth: Strong GDP growth in China (a top copper consumer) or a global infrastructure boom (e.g., post-2024 recovery) could support high prices. Conversely, a recession would cap upside potential.
Inflation: Persistent inflation in 2025 could make copper a hedge, boosting prices. A cooling inflation trend might signal a peak.
USD Strength: A weaker USD (e.g., due to Fed rate cuts) would naturally lift XCU/USD, while a stronger USD could challenge the $9.70 level unless supply/demand dynamics dominate.
⭐Geopolitical Factors⭐
Trade Policies: Escalating U.S.-China tensions or tariffs in 2025 could disrupt copper flows, raising prices if China stockpiles or seeks alternative suppliers.
Regional Instability: Political unrest in copper-rich regions like Peru or Chile (e.g., protests, strikes) could reduce output, supporting high prices. For instance, Peru’s flat production trends (noted in prior data) might persist.
Sanctions/War: Geopolitical events, such as sanctions on Russia (a minor copper player) or conflicts affecting shipping routes (e.g., Red Sea disruptions), could increase costs and prices.
Energy Transition: Global commitments to net-zero (e.g., post-COP29 agreements) might amplify copper demand, reinforcing the $9.70 level.
⭐Supply and Demand Factors⭐
Demand: Copper’s role in electrification (EVs, grids) and construction suggests strong demand. At $9.70, industries might face cost pressures, potentially curbing consumption unless offset by growth.
Supply: Multi-month low inventories (e.g., Shanghai warehouses) and challenges in mining (e.g., declining ore grades, environmental regulations) could limit supply. A price this high implies significant tightness.
Substitution Risk: High prices might encourage substitution (e.g., aluminum in wiring), though copper’s conductivity makes this limited in key applications.
Stockpiles: LME warehouse data showing declining stocks would support $9.70; rising inventories could signal a reversal.
⭐Technical Factors⭐
Price Levels: At $9.70, XCU/USD might be testing a major resistance (e.g., a psychological $10.00 level). Historical highs (around $4.90 in 2022) suggest this is a breakout, potentially overextended.
Moving Averages: If the 50-day MA ($9.50) and 200-day MA ($9.00) are below the current price, this indicates bullish momentum. A drop below these could signal a correction.
RSI: An RSI above 70 (overbought) at $9.70 suggests a potential pullback; below 50 would indicate bearish momentum.
Support/Resistance: Support might lie at $9.00–$9.20 (former resistance turned support), with resistance at $10.00–$10.50.
⭐Sentiment Factors⭐
Market Sentiment: At $9.70, sentiment is likely bullish, driven by optimism about industrial demand and supply fears. However, over exuberance could lead to profit-taking.
X Trends: Discussions on X about unexpected commodity price spikes (akin to trending weather surprises) might reflect surprise at this level, hinting at speculative froth.
Media: Positive coverage of copper’s role in green tech could fuel bullish sentiment; negative economic outlooks might shift it bearish.
⭐Seasonal Factors⭐
Construction Cycles: Spring (March–May) typically sees higher copper demand due to construction in the Northern Hemisphere, supporting $9.70.
Chinese Demand: Post-Lunar New Year (Feb 2025) often boosts industrial activity in China, aligning with this price spike.
Historical Patterns: Copper prices can peak mid-year if supply lags seasonal demand, suggesting $9.70 might hold short-term but face pressure later.
⭐Intermarket Analysis⭐
USD Index: A declining DXY (e.g., below 100) would support higher XCU/USD; a rising DXY could cap gains.
Gold (XAU/USD): Copper often correlates with gold as an inflation hedge. If gold is also at highs (e.g., $2,900+), this reinforces bullish commodity trends.
Oil Prices: High oil prices (e.g., $90+/barrel) increase mining costs, supporting copper prices but potentially slowing industrial demand.
Equities: Strong industrial stocks (e.g., mining, EV firms) suggest copper demand; a broader market sell-off could drag prices down.
⭐Market Sentiment Analysis of All Types of Investors⭐
Retail Investors: Likely bullish at $9.70, chasing the trend via ETFs or futures, but prone to panic selling on dips.
Institutional Investors: Hedge funds and banks might be long copper, betting on supply shortages, though some could hedge if overbought signals emerge.
Industrial Users: Manufacturers (e.g., EV makers) might lock in prices via forwards, supporting the market, but high costs could prompt hedging or substitution.
Speculators: High volatility at $9.70 attracts traders; sentiment could turn bearish if momentum fades.
⭐Next Trend Move and Future Trend Prediction⭐
Short-Term: Likely a pullback to $9.20–$9.50 due to overbought conditions (RSI > 70) and profit-taking. Target: $9.30.
Medium-Term:
If supply remains tight and demand grows (e.g., China’s 5% growth goal), prices could test $10.00–$10.50. Target: $10.20.
Long-Term:
Sustained electrification trends might push prices to $11.00+, but economic slowdowns or substitution could cap at $9.00. Target: $10.50 (bullish) or $8.50 (bearish).
⭐Overall Summary Outlook⭐
Current Stance: At $9.70 on March 12, 2025, XCU/USD is in a Long/Bullish phase short-term, driven by strong demand, supply constraints, and a weaker USD. However, the extreme price suggests a Short/Bearish correction is imminent medium-term due to overbought signals and potential demand softening.
Bullish Case: Continued supply disruptions (e.g., Peru/Chile strikes), robust Chinese growth, and green tech demand could push prices toward $10.50–$11.00 long-term.
Bearish Case: Economic slowdown, USD strength, or inventory buildup could trigger a decline to $8.50–$9.00 within 6–12 months.
Recommendation: Hold long positions short-term but prepare for a correction. Watch $9.50 support and $10.00 resistance for trend confirmation.
📌Keep in mind that these factors can change rapidly, and it's essential to stay up-to-date with market developments and adjust your analysis accordingly.
⚠️Trading Alert : News Releases and Position Management 📰 🗞️ 🚫🚏
As a reminder, news releases can have a significant impact on market prices and volatility. To minimize potential losses and protect your running positions,
we recommend the following:
Avoid taking new trades during news releases
Use trailing stop-loss orders to protect your running positions and lock in profits
💖Supporting our robbery plan 💥Hit the Boost Button💥 will enable us to effortlessly make and steal money 💰💵. Boost the strength of our robbery team. Every day in this market make money with ease by using the Thief Trading Style.🏆💪🤝❤️🎉🚀
I'll see you soon with another heist plan, so stay tuned 🤑🐱👤🤗🤩

GOLD AND GOLD Gold is on fire! With rising demand, global uncertainties, and strong investor interest, this precious metal is set to surge. If you're looking for stability and long-term gains, gold remains the ultimate safe-haven asset. The rally is just beginning,don’t miss out!
2940? maybe yes maybe not

SOL/USD Short Trade ideaThe price hasnt made any new LL's and is showing possibility on a double top...the price is at a ridiculous price point and is a high possibility for a buy momentum to happen. Watch for fake breakouts, look for right confirmations and use logical thinking in crypto about the price movements. Yes we had a high reached, we had price rising slowly from a very low point back to the ressistance GWS and on smaller TF's we can see no new LLs made...lets see how it plays out and where we can find a trade.

A market reconsidering USD | FX ResearchFinancial markets can't get away from all things trade tariffs, and it's clear the unpredictability has been rattling sentiment. The unpredictability has also been behind a lot of the US dollar selling we've been seeing, particularly against the major currencies now viewed as alternative safe havens amidst the deterioration in confidence in the buck.
Meanwhile, the euro has been shining brightest as it also benefits from the new EU fiscal reform narrative. We have seen some weakness in the yen in recent sessions, presumably on worry over Japan's fate with respect to getting trade exemptions from the US.
Looking ahead, key standouts on Wednesday's calendar come from an ECB Lagarde speech, US inflation data, and the Bank of Canada policy decision.


DXY in 1 H timeframeDXY Analysis on RTM Style
Here’s an analysis of the **U.S. Dollar Index (DXY) on the 1H timeframe** based on the **RTM (Read The Market) style** and your drawn arrows:
Previous Trend & Break of Structure (BoS)**
- The market has been in a strong downtrend, forming **Lower Lows (LL) and Lower Highs (LH)**.
- After breaking the **105.485 level (0.5 Fibonacci retracement)**, the bearish momentum continued down to the **103.5 support zone**.
Liquidity Zones & Potential Reversal**
- The price is currently consolidating around **103.5**, indicating a possible reaction from buyers.
- A **Higher High (HH)** is marked, suggesting a potential shift in market structure.
Possible Scenario Based on the Arrows**
- A short-term **accumulation phase** is expected between **103.5 - 104**.
- If the price breaks above **103.998**, bullish momentum may drive it toward the **105.5 - 106.7 zone (Fibonacci 0.5 & 0.786 retracement levels)**.
- If this resistance is broken, the final target could be **107.27**, a strong resistance level.
- The market is at a **key support level** and may form a bullish structure.
- Confirmation of a **Higher High** and a break above **103.998** could trigger an upward move.
- **Re-Accumulation** is expected before a strong bullish continuation.
- **Bearish Alternative**: If the **103.5 support** fails, the price may drop further to **102.1**.
This analysis is suitable for publishing, but I recommend adding an alternative scenario in case the support fails, giving a more well-rounded outlook.

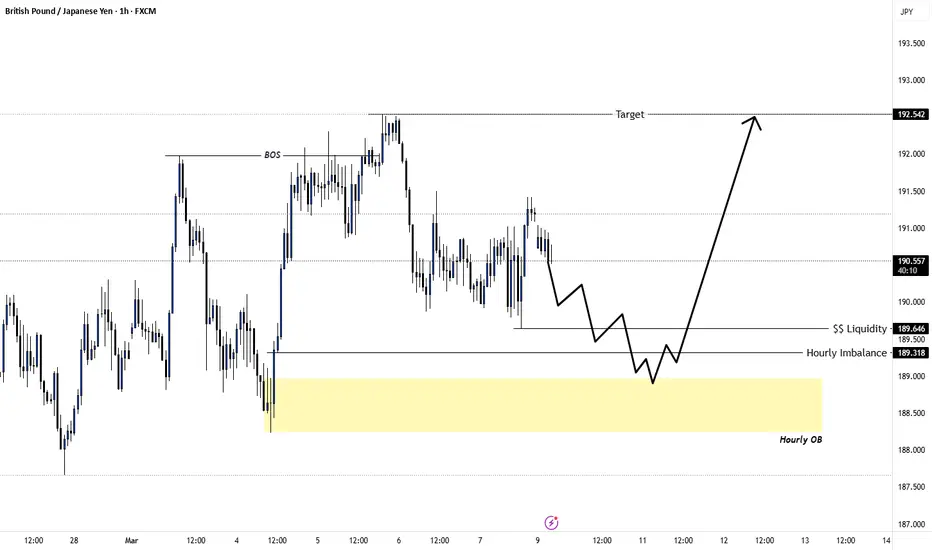
GJ | Hourly Timeframe Analysis Hourly time frame is currently bullish. I will want to see price take out that sellside liquidity and fill that imbalance before looking to buy back to the top of the range.
S&P500 Rebound: Glimpses of Stability in the Midst of a StormBy Ion Jauregui, Analyst ActivTrades
The S&P500 index has surprised everyone by rebounding after a historic day of declines. The volatility experienced last Monday, driven by uncertainty over new tariff measures, has begun to subside, giving a glimpse of a possible equilibrium in the US markets. Yesterday was a real hell for investors. Fears were triggered by the confirmation of plans to double tariffs on steel and aluminum, with particular stringency for imports from Canada. This announcement, part of a strategy of trade tightening, generated a domino effect that sent the S&P500 sharply lower, highlighting the market's sensitivity to economic policy decisions. Europe's response to the tariffs was swift with a subsequent statement from the European Commission with “swift and proportionate” countermeasures to U.S. imports.
However, yesterday's subsequent session saw an unexpected response. Activity on Wall Street showed a moderation in the initial panic, and several traders took the opportunity to buy back assets on attractive technical terms. This rebound not only suggests that the plunge may have been an overreaction, but also reflects the resilience inherent in one of the world's most closely watched markets. The White House, for its part, tried to calm the mood, insisting that the sharp drop was a “one-off” and not representative of the strength of the U.S. economy. Meanwhile, Trump himself, through his statements, continues to set the tone in the debate on the transition to a new economic paradigm, where the implementation of tariffs is only one of the edges of a broader strategy.
Looking ahead, the focus is on how trade measures will evolve and whether market responses will be able to sustain in the face of possible further turbulence. The partial recovery of the S&P500 is certainly an indication that traders are willing to ride out the uncertainty as long as signs of consistent, stability-oriented economic policy materialize.
Technical analysis
Looking at the trend of the index, the fall since February 21 has been extended. With a very pronounced fall this week of -4.05% being the fall since the beginning of the month of -7.33% and -9.34% since the beginning of the fall. Yesterday's bounces could change the game of bearish dynamics of the index indicating a possible brake to this rampant fall generating the entry of buyers into the market. The strongest triple bell zone is located in the area of 4,953 points, a range that tried to consolidate after the beginning of the fall. The most plausible zone for price recovery in case of a bulls' advance in the market. If we look at a long-term perspective, the stock has bounced off the September 11, 2024 price level and could have closed a bullish gap. But before moving to the third long term bell we have another prior range at the 5,755 area where the current checkpoint is located. The mid-range crosses have not given any kind of trend reversal signal, so it is very likely that this week will see a retest of the 5,548 price. There is no “two without three”. If this price does not hold it is possible that the price could pull back to 5,491.29 points as first resistance and second resistance at 5,378.48 points. RSI indicates a point of slight oversold at 44.30% so this could happen during this week of high volatility.
In short, the recent rebound is an encouraging sign in a context of high volatility, although the question remains as to whether this recovery will be sustained or simply a momentary respite in the midst of a still uncertain outlook.In the short term, the first year of the Republican administration looks highly volatile for the markets.
*******************************************************************************************
The information provided does not constitute investment research. The material has not been prepared in accordance with the legal requirements designed to promote the independence of investment research and such should be considered a marketing communication.
All information has been prepared by ActivTrades ("AT"). The information does not contain a record of AT's prices, or an offer of or solicitation for a transaction in any financial instrument. No representation or warranty is given as to the accuracy or completeness of this information.
Any material provided does not have regard to the specific investment objective and financial situation of any person who may receive it. Past performance is not reliable indicator of future performance. AT provides an execution-only service. Consequently, any person acing on the information provided does so at their own risk.
