Pfizer ($PFE): Undervalued Pharma Giant with Growth Potential?(1/9)
Good afternoon, everyone! 😊
Pfizer ( NYSE:PFE ): Undervalued Pharma Giant with Growth Potential?
With PFE at $25.90, is this the time to buy into this pharmaceutical powerhouse? Let’s dive in! 😎
(2/9) – PRICE PERFORMANCE
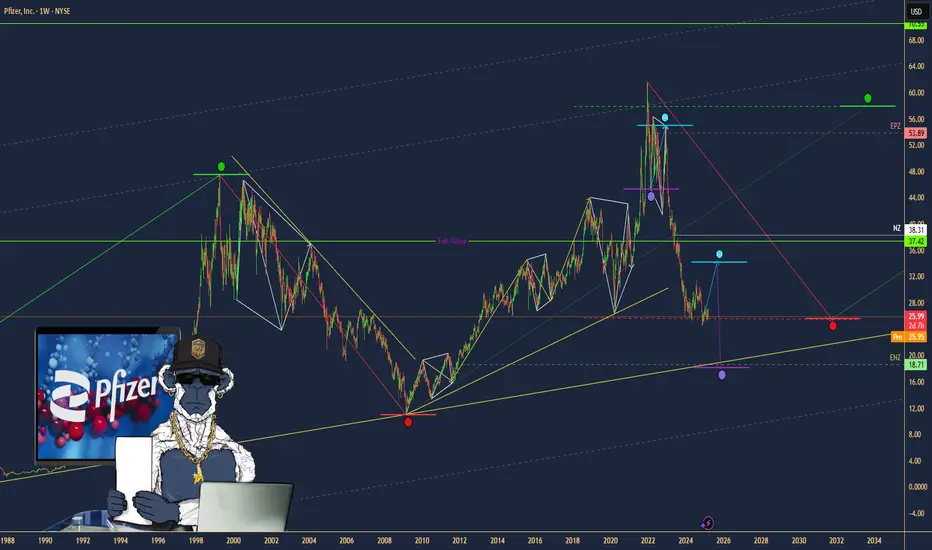
• Current Price: $25.90 as of March 12, 2025 😏
• Recent Moves: Trading within a range of $24 to $28, currently near the middle 😬
• Sector Vibe: Pharma sector remains stable, with new drug approvals driving growth 📈
Short commentary: The stock seems to be consolidating. Is this a good entry point? 🤔
(3/9) – MARKET POSITION
• Market Cap: Approximately $147.2 billion (assuming 5.67 billion shares outstanding) 💰
• Operations: Global pharmaceutical company with a diverse product portfolio 🛡️
• Trend: Strong Q4 2024 earnings and reaffirmed 2025 guidance 🚀
Short commentary: Pfizer’s fundamentals are solid, with consistent revenue and earnings projections. 😉
(4/9) – KEY DEVELOPMENTS
• Reaffirmed 2025 revenue guidance of $61-64 billion and EPS of $2.80-3.00 📈
• Continued focus on new drug developments and expanding into emerging markets 🌐
• Achieved cost savings goals and ongoing optimization programs for improved margins 💡
Short commentary: The company is managing its costs effectively and looking to future growth. Let’s watch closely. 👀
(5/9) – RISKS IN FOCUS
• Legal challenges related to past products ⚙️
• Competition from generic manufacturers and patent expirations 📉
• Economic conditions affecting healthcare spending ⚠️
Short commentary: These risks are known, but Pfizer’s diverse portfolio should help mitigate them. Stay vigilant! 🕵️
(6/9) – SWOT: STRENGTHS
• Diverse product portfolio across multiple therapeutic areas 🏆
• Strong R&D capabilities and pipeline of new drugs 🌈
• Global presence and distribution network 🌟
Short commentary: Pfizer’s strengths position it well for long-term growth. Keep up the good work! 👍
(7/9) – SWOT: WEAKNESSES & OPPORTUNITIES
• Weaknesses: Dependence on key products, legal issues ⚠️
• Opportunities: New drug approvals, expanding into emerging markets 🌐
Short commentary: Opportunities abound, but weaknesses need to be monitored. Let’s hope they nail it! 📈
(8/9) – PFE at $25.90 – what’s your call? 🗳️
• Bullish: Price could rise to $30+ if it breaks above $28 🚀
• Neutral: Price remains between $24 and $28 😐
• Bearish: Price could drop to $22 if it breaks below $24 📉
Drop your pick below! 💬
(9/9) – FINAL TAKEAWAY
Pfizer’s $25.90 stance shows a company with solid fundamentals and a fair valuation at a P/E of approximately 8.93. With a strong pipeline and cost management, it’s an attractive option for value investors. Keep an eye on resistance at $28 for potential upside movement. Snag low, hold long!
Fundamental Analysis
WTI, Double Bottom with Bullish DivergenceDouble Bottom Formation
Taking Support and Major Support Level
Bullish Divergence
Today US CPI data is IMP to trigger this Bullish Move
Entry @ CMP
SL Below Double Bottom
Tp at mentioned area


GDWA_A Deeply Underrated Asset Investment Decision Analysis for GDWA holding company has shares as following:
1) 72.3% of Electro Cables (ELEC) market Cap 9.15B
2) 47.9% of Arab Dairy (ADPC) Market Cap 1.58B,
3) 73.9% of Universal for Paper &Packaging Materials (UNIP) Market Cap 621.74M
4) 74.7% Egyptian Integrated for Food Industries (EIFI) Market Cap 101.74M
Minimum Market Cap Estimate: If GDWA's value is purely based on its investments, the minimum estimate is 7.91B.
value-based price of EGP 7.54/share, you would gain approximately +28.0 % profit from your investment at the current price (EGP 5.8/share).
The fair value of GDWA's share price can be determined based on the valuation data provided in the reports and financial metrics. Here’s a detailed calculation and analysis:
A) Historically, GDWA's financial performance tends to be stronger in the second half of the year due to operational seasonality and project completions.
Q4 Financial Performance
B) EBIT for Q4: EGP 1.15 billion, up by +185.81% compared to previous periods. This indicates strong operational growth.
C) Net Income for Q4: EGP 430.05 million, up by +203.65%, suggesting solid profitability improvements in the company.
Gadwa is a leading industrial development and investment company that boasts holdings in the industrial sector, particularly high growth-potential consumer-related businesses, and defensive business models.
1. Projected Price by End of 2025: EGP 10.4/share
2. Projected Price by End of 2026: Refer stockanalysis.com the company The enterprise value
is 16.37 billion. what shou be prices of share DWA would be approximately
EGP 15.59 per share.

Bitcoin's Natural Correction and the $141K Target Based on Fibonhello dear trader and investors
The cryptocurrency market is always accompanied by strong fluctuations and natural corrections. Bitcoin, as the market leader, requires corrections and liquidity accumulation after each significant rally to pave the way for higher price targets. In this article, we analyze Fibonacci structures and harmonic patterns to demonstrate that Bitcoin's next target could be $141K.
1. Bitcoin Corrections: A Natural Part of an Uptrend
Price corrections in bullish trends are a normal phenomenon that helps shake out weak hands and allows major players to accumulate liquidity. Historically, Bitcoin has experienced 20-30% corrections before resuming its upward trajectory. The current correction is no different and may serve as a base for the next strong move toward higher targets.
2. The $141K Target Based on Fibonacci
Fibonacci levels are among the most reliable tools for predicting price targets. Assuming Bitcoin's recent high was around FWB:73K and the ongoing pullback is a healthy retracement, we can use harmonic AB=CD pattern to project potential upside targets. Based on these levels, Bitcoin could reach $141K in the next bullish phase.
Confirmation Through Harmonic Patterns
Harmonic patterns like Butterfly and Gartley suggest that the current correction is forming a potential reversal structure. If this correction completes within the PRZ (Potential Reversal Zone), Bitcoin could see a strong continuation of its uptrend. The Fibonacci ratios in these harmonic structures indicate that the final price target for this bullish wave could be around $141K.
Volume and Liquidity: Key Drivers for the Rally
Bitcoin needs increased volume and liquidity inflows to reach higher levels. On-chain data shows that trading volumes are rising and large investors (whales) are accumulating rather than selling. This behavior typically precedes a strong bullish move.
Bitcoin's current correction is entirely natural, and technical structures suggest that it could be laying the foundation for a new bullish wave. Based on Fibonacci and harmonic pattern analysis, Bitcoin's next major target is around $141K. Traders and investors should consider these levels in their analysis and avoid emotional decisions during market corrections
good luck
mehdi

GOOGL upside potentialTechnicals
GOOGL has yet to close below a major trendline, indicating potential continuation of the uptrend.
Fair Value Gap (FVG) Target: There is an inefficiency in price that could act as a magnet for an upward move. If buyers step in at support, the next target will be filling this gap.
Fundamentals
Revenue Growth: Q4 2024 revenue came in at $96.5 billion (+12% YoY), driven by strength in Search, YouTube Ads, and Google Cloud.
AI Investments: Alphabet plans to invest $75 billion in AI infrastructure this year, boosting its competitive edge.
Profitability: Operating income rose 33% YoY, with improving margins (32%).
Market Rotation: Strong institutional interest in mega-cap tech stocks supports potential upside.

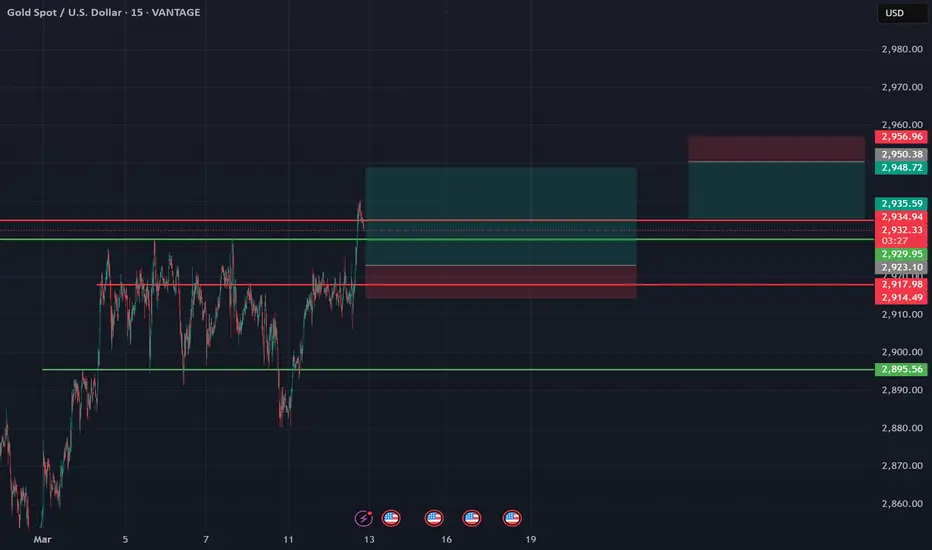
Gold (XAUUSD) – CPI Data Driven Breakout Setup | Target: 2960Technical & Fundamental Analysis
Gold (XAUUSD) is showing signs of a potential breakout ahead of key CPI (Consumer Price Index) data. On the 1-hour timeframe, price is consolidating near a breakout zone with bullish momentum building. A significant move is expected depending on inflation data results.
Technical Analysis:
1. Ichimoku Cloud & Structure:
Price is hovering just above the Ichimoku cloud, indicating bullish sentiment if it holds and breaks upward.
A tight consolidation zone suggests that a breakout is imminent, supported by low volatility and coiled price action.
2. Support & Resistance :
Buy Entry: Around 2,914-2,915, the breakout zone above minor resistance.
Resistance/Target: 2,960 is the next key level, marked by previous highs and potential reaction zone.
Support: Strong demand zone around 2,893, acting as a stop-loss reference level.
3. Chart Pattern:
Forming a bullish flag or accumulation zone before the potential breakout.
Price action indicates a likely surge if CPI data supports inflationary pressure.
Fundamental Analysis:
CPI Report (Inflation Data):
The upcoming CPI release is expected to bring volatility. A higher-than-expected CPI could push gold higher as investors hedge against inflation.
Conversely, a cooler CPI could limit upside, so risk management is key.
Market Sentiment:
Geopolitical uncertainty and mixed signals from the Fed are keeping gold in focus.
Investors are watching for clues on rate cuts, which would be bullish for go
Trade Plan:
Entry: Above 2,914.70 (confirmed breakout)
Stop Loss: Below 2,893
Target: 2,960
Risk Management: Wait for CPI data confirmation before aggressive entry.
Conclusion:
Gold is coiling up for a potential breakout supported by technical structure and a major upcoming CPI report. A bullish CPI surprise could trigger a rally toward 2960. Patience and risk control are crucial around news events.
Stay Sharp & Trade Smart!

TRANSPORTATION! CRACK!!The transportation average breaking the first time warned us that things were not right back in July 2024. Today we are getting yet another CRACK WARNING!
The TRUMP economy will be a disaster area if he doesn't change his ways quickly. Even then it may be too late. Trust in the government has eroded.
Democracy and markets rely on TRUST! Trust can not be bought, or taken, it may only be lost!
DANGER for bulls!
last month I started to warn about Airlines (JETS) since then the results speak for themselves.
Click like, follow subscribe for more!

Gold Price Analysis:Key Resistance Holds Potential Drop to 2,900Gold (XAU/USD) is facing strong resistance near $2,930, with multiple rejections signaling a potential bearish move. A previous uptrend broke down, leading to price fluctuations between key resistance and support zones. If resistance holds, gold could decline toward the $2,900 target or lower, testing major support at $2,880. Traders should watch for confirmation signals near resistance before entering positions. Will gold break higher or continue its downward move? Stay tuned for key market movements!
1. Trend Analysis
The chart initially shows a strong uptrend, represented by the ascending trendline (blue channel).
However, the price broke below the trendline, indicating a shift from a bullish to a sideways or bearish structure.
2. Key Resistance Level ($2,930 Zone - Red Box)
The price has tested this resistance zone multiple times (yellow circles) but failed to break above it.
Each rejection from this level suggests strong selling pressure.
3. Key Support Level ($2,880 Zone - Blue Box)
The price previously bounced off this support, confirming it as a demand zone.
A break below this level would indicate further downside potential.
4. Price Projection and Market Sentiment
The chart suggests a potential drop towards $2,900, as indicated by the blue arrow.
The price may first attempt a short-term retest of resistance, followed by a decline.
A confirmed breakdown below $2,900 could lead to further selling pressure towards $2,880.
5. Trading Considerations
Bullish case: A breakout above $2,930 could signal further upside.
Bearish case: A rejection at resistance followed by a break of $2,900 would confirm the downtrend.
Neutral stance: If the price consolidates between support and resistance, traders should wait for a clear breakout.
Conclusion
The chart indicates that gold is at a critical resistance zone. If sellers dominate, the price is likely to fall towards $2,900 or lower. However, a breakout above resistance could trigger further bullish momentum. Traders should watch price action closely and manage risk accordingly.

Time to Scoop up Small Caps?The Russell 2000 is down 17% from November highs. According to Bank of America, small caps are not pricing in a recession. Historical small-cap selloffs during recessions have been 35-40%, with forward P/Es dropping about 30%. Earnings are still 38% below their peak. Small caps trade at 14.2x earnings, slightly below the historical average, suggesting they reflect a mild manufacturing slowdown rather than a recession. P/E valuations suggest 9% annualized returns for the Russell 2000 over the next decade, compared to 5% for mid-caps and 1% for large caps.
IWM Technicals:
- Multi-year log trend support.
- Vastly under the yearly average (yellow).

Gold Price Analysis March 12⭐️Fundamental analysis
Gold prices are fluctuating in a narrow range due to cautious sentiment before the US inflation data is released. The USD has recovered thanks to investors selling positions after the recent decline.
If inflation is weaker than expected, the Fed may cut interest rates, weakening the USD and pushing gold prices up. Conversely, if inflation is higher than expected, the Fed may keep interest rates high, putting downward pressure on gold prices.
In addition, US-Canada trade tensions and US-Russia peace talks on Ukraine also affect the market, so the impact of inflation data on gold prices may not last long.
⭐️ Technical analysis
Gold is sideways in the Asian session with a small range from 2912-2920. Waiting for signs of breaking out of this range. When the price breaks 2912 to 2908, the US session's Buyer zone is very noticeable. By the end of the US session, the price was still trading above 2908, proving that the price wanted to increase and break 2920 to reach 2929 and 2943. Note that the support zone of 2880 will still be the boundary that gold will find difficult to break today.

"Gold Market Poised for Breakout: Key Levels and CPI Impact"hello traders hope your doing well today I'm sharing my idea about Gold today!
Technical Analysis:
Gold is currently trading around $2,920, showing strong bullish momentum.
Entry Point: $2,900
Target: $2,945
Resistance Levels: $2,920 (current), $2,945 (next target)
Support Levels: $2,895 (key support); a break below may lead to further downside.
Wyckoff Spring Phase suggests a potential reversal and bullish continuation.
Fundamental Analysis:
U.S. CPI Data Release – A key event that could influence gold prices based on inflation expectations and Fed policy.
Central Bank Buying – China and other banks continue accumulating gold, providing long-term support.
Market Sentiment – Increased volatility expected ahead of macroeconomic data.
Outlook:
Gold remains bullish, but traders should watch CPI data and key resistance levels for confirmation of a breakout.
📢 Like and comment on this idea for support! Let me know your thoughts and targets in the comments. 🚀

GOLD SELL NOWGOLD SELL AT 2940/2945
Gold Bearish Outlook – Target: $2895
Gold is moving within a parallel channel and facing strong resistance, indicating a potential drop. Key reasons:
📉 Technical Factors:
Rejection from channel resistance.
Bearish RSI & MACD signals.
Fibonacci resistance confirms downside pressure.
🌍 Fundamental Factors:
Stronger USD (DXY) & rising bond yields.
Fed’s hawkish stance on interest rates.
Institutional profit-taking adding selling pressure.
If gold stays below resistance, $2895 is likely. Trade wisely with risk management! 🔥📊

AUDUSD Analysis Today: Technical and Order Flow Analysis !In this video I will be sharing my AUDUSD analysis today, by providing my complete technical and order flow analysis, so you can watch it to possibly improve your forex trading skillset. The video is structured in 3 parts, first I will be performing my complete technical analysis, then I will be moving to the COT data analysis, so how the big payers in market are moving their orders, and to do this I will be using my customized proprietary software and then I will be putting together these two different types of analysis.

GOLD for tomorrow (Follow me for more signals )I Believe Gold will fill the 4HR FVG and bonce back and then end it off with a drop then bounce to HIGH height's . Trade with correct lot size and risk management is advised.
Tencent Music (TME) – Streaming Growth & Fan Engagement Company Overview:
Tencent Music Entertainment NYSE:TME is a leading digital music streaming platform with a 35.7% stock return over the past year, signaling strong market confidence.
Key Catalysts:
Q4 2024 Earnings on March 18 📊
Analysts anticipate positive results, which could boost investor sentiment.
Bubble Service Expansion on QQ Music 🚀
The new partnership with SM Entertainment’s Dear U enhances artist-fan engagement, increasing user retention and monetization.
Diverse Platform Ecosystem 🎧
Platforms like QQ Music, Kugou, Kuwo, and WeSing provide stable revenue while reducing reliance on any single platform.
Strategic Entertainment Partnerships 🤝
Collaborations with major entertainment entities expand TME’s content library and user engagement, solidifying its industry position.
Investment Outlook:
Bullish Case: We remain bullish on TME above $11.00-$12.00, driven by user growth, service expansion, and industry alliances.
Upside Potential: Our price target is $19.00-$20.00, backed by earnings growth, new services, and a strong content strategy.
🔥 Tencent Music – The Future of Digital Streaming & Fan Engagement. #TME #MusicTech #StreamingStocks

BTC/USDT Breakdown & Reversal Area Insight🛠 Technical Overview
🔸 Asset: Bitcoin (BTC/USDT Perpetual Futures)
🔸 Exchange: Binance
🔸 Timeframe: 30-Minute Chart
🔸 Key Structure: Parabolic Curve Breakdown
📉 Bearish Breakdown & Potential Support
Bitcoin has broken below a curved trendline, indicating that the bullish momentum is cooling off. The current price action suggests a pullback to a major liquidity zone around $78,000 - $79,000, where buyers may step in.
🚀 Reversal Area & Buying Opportunity
The marked Reversal Area (gray box) is a high-probability demand zone.
A reaction here (wick rejections, bullish engulfing candles) could signal a long opportunity.
Invalidation: If BTC breaks below $77,500, more downside is likely.
🎯 Trading Strategy
📌 Bearish Setup: Short-term pullback until Reversal Area ($78K-$79K)
📌 Bullish Setup: Wait for confirmation of demand absorption at Reversal Area
📊 Key Levels to Watch
🔹 Support: $78,000 - $79,000
🔹 Resistance: $82,500 - $83,000
📈 Conclusion
Bitcoin is at a critical juncture! A successful bounce at the Reversal Area could trigger another bullish leg, but if support fails, further downside is possible. Traders should remain cautious and watch volume trends closely.
🔔 Like & Follow for More BTC Analysis! 🚀

uh owell we've so far passed all my support points and are like in super duper oversold territory. Traders want to bounce but I'm going to finally change my 6 month outlook. BEARISH. Short term it depends on how the chips fall -- if we get some straws to grasp at on the economic data side of things, we could bounce easily to $580.
But people are not liking the current field, even after all the panic selling, there aren't many management firms snatching up the deals. Except for NVDA, people really fell on that knife these past 2 days, hoping its profits remain magnificent and its costs don't increase. Maybe TSLA will be a buy soon -- Musk owns less than 50% of the company right? They can vote him out in June? I mean I was expecting a bounce and extra profits from the CEO being so close to the POTUS but maybe people are sensing he's too MIA, off playing video games or something.
Worst of all, the administration isn't even giving people platitudes. There's no, 'we're doing everything we can to prevent a full Biden recession'. There's almost a calm acceptance that it might happen and we'll be better off for it. At first it was just uncertainty around rate cuts but its blossomed into caution around CapEx and MA (because somehow the outlook on tariffs is even murkier now than in December) and dent in employment activity due to mass layoffs at the federal level. Like this year just cannot get any worse -- and any bullish reversals will be due to that sentiment; that we're impervious to further drops in the stock market because the bad news is already priced in. But we haven't accounted for all the people who will have to cash out of their 401k's this fall and therefore cannot discount the possibility of a 25% market correction or more. Like, I'll change my mind when the administration starts acting like recessions are bad and we should work our hardest to avoid them rather than just making sure Biden gets some of the blame (no way Trump escapes all the blame anymore, he'll be lucky if he can avoid a government shutdown Friday).
Like usually treasuries move inverse to stock market action, but what if the pause in business activity is because of unpredictability at the federal government? How long before we float the idea of reneging on our debts and we get downgraded to a B+? Like we talk about protectionist policies and fiscal conservativism; what could be more of an America first policy than just defaulting on our owed debt? I just hope we can default in tranches so that not all $36 trillion becomes worthless all at once. Maybe the Fed can look into that -- stop selling short term notes for example and commit to honoring our immediate debts...

BTC/USDT Price Analysis: Reversal or More Downside?:
📊 BTC/USDT 2-Hour Chart Analysis
🔻 Current Trend:
BTC is in a downtrend 📉, trading below the 30 EMA (🔴 84,270 USDT) and 200 EMA (🔵 88,644 USDT).
The price is currently 82,406 USDT and approaching a key support zone (🟣 ~80,000 USDT).
Support & Resistance Levels
🟣 Support Zone (~80,000 USDT) – Possible bounce area ⬆️
🟣 Mid-Resistance (~86,000–88,000 USDT) – First hurdle 🚧
🟣 Major Resistance (~96,000 USDT) – Final target 🎯
Possible Price Movement (🔵 Blue Line Projection)
✅ Bullish Case:
If BTC bounces off support 🏋️, it could move towards 88,000 USDT 🚀 and then 96,000 USDT 🎯.
❌ Bearish Case:
If BTC breaks below 80,000 USDT, we might see more downside ⚠️.
💡 Trading Tip:
Watch price action 📊 at support & resistance.
Look for confirmation signals ✅ before entering trades.
🚀 Are you bullish or bearish on BTC? 🔥

NQ: End of day analysis!We got an irrelevant daily close .
Tomorrow, we have PPI data. NQ will behave in the same manner of CPI:
1- Overshoot: NQ down;
2- Inline or Undershoot: A bounce and down (zigzag).
What I want to highlight is that the current area 19100-19600 seems to become ST/MT Support or Resistance. Hence price might continue to be around it until the end of the week and the next few days.
When price will break it, it will give the sign of next direction. To this end, what do we have:
1- Recession, inflation and tariffs are all negative factors. NQ should continue down;
2- FED next week: free money; rate cut. These are positive factors. NQ downtrend ends and we move back up.
3- Tax cut and deregulation are also positive factors.
So as you can see, we have many opposite forces happening or markets expect them to happen. Any delay of the positive factors, markets will move down to make pressure.
Have a good evening/night!

XAU USD LONG RESULT Gold took and followed my Green Path prediction from yesterday, meaning we're very much bullish in Gold and confirming the uptrend to $2950 zone

ETH/USD "Ethereum vs U.S Dollar" Crypto Market Heist Plan🌟Hi! Hola! Ola! Bonjour! Hallo! Marhaba!🌟
Dear Money Makers & Thieves, 🤑 💰🐱👤
Based on 🔥Thief Trading style technical and fundamental analysis🔥, here is our master plan to heist the ETH/USD "Ethereum vs U.S Dollar" Crypto market. Please adhere to the strategy I've outlined in the chart, which emphasizes long entry. Our aim is the high-risk Red Zone. Risky level, overbought market, consolidation, trend reversal, trap at the level where traders and bearish robbers are stronger. 🏆💸Book Profits wealthy and safe trade.💪🏆🎉
Entry 📈 : "The vault is wide open! Swipe the Bullish loot at any price - the heist is on!
however I advise to Place Buy stop orders above the Moving average (or) Place buy limit orders within a 15 or 30 minute timeframe most recent or swing, low or high level.
Stop Loss 🛑:
Thief SL placed at the recent / swing low level Using the 1H timeframe (2250) swing trade basis.
SL is based on your risk of the trade, lot size and how many multiple orders you have to take.
Target 🎯: 3000 (or) Escape Before the Target
🧲Scalpers, take note 👀 : only scalp on the Long side. If you have a lot of money, you can go straight away; if not, you can join swing traders and carry out the robbery plan. Use trailing SL to safeguard your money 💰.
📰🗞️Fundamental, Macro, COT, Sentimental Outlook:
ETH/USD "Ethereum vs U.S Dollar" Crypto Market is currently experiencing a bullish trend,., driven by several key factors.
Fundamental Analysis
Network Congestion: Ethereum's network congestion has decreased, with an average block time of 12 seconds.
Transaction Volume: The transaction volume for Ethereum has increased by 15% in the last 24 hours.
Mining Difficulty: The mining difficulty for Ethereum has decreased by 2% in the last adjustment.
Macro Economics
Inflation Rate: The global inflation rate is expected to decrease to 3.2% in 2025, which could lead to increased demand for cryptocurrencies like Ethereum.
Interest Rates: The US Federal Reserve has maintained its hawkish stance, keeping interest rates at 5.25% to combat inflation.
Global Trade: The ongoing trade tensions between the US and China are expected to have a minimal impact on the cryptocurrency market.
Global Market Analysis
Cryptocurrency Market: The global cryptocurrency market capitalization has increased by 2% in the last 24 hours.
Bitcoin Dominance: Bitcoin's dominance has decreased to 40.2%, which could lead to increased demand for altcoins like Ethereum.
Altcoin Market: The altcoin market has increased by 3% in the last 24 hours.
On-Chain Analysis
Transaction Count: The transaction count for Ethereum has increased by 10% in the last 24 hours.
Active Addresses: The number of active addresses for Ethereum has increased by 5% in the last 24 hours.
Hash Rate: The hash rate for Ethereum has increased by 1% in the last 24 hours.
Market Sentiment Analysis
The overall sentiment for ETH/USD is bullish, with a mix of positive and neutral predictions.
58% of client accounts are long on this market, indicating a bullish sentiment.
Positioning
The long/short ratio for ETH/USD is currently 1.4.
The open interest for ETH/USD is approximately 2.5 million contracts.
Next Trend Move
Bullish Prediction: Some analysts predict a potential bullish move, targeting $2,600 and $2,800, due to the increased demand for cryptocurrencies and the decreased mining difficulty.
Bearish Prediction: Others predict a potential bearish move, targeting $2,200 and $2,000, due to the increased competition from other altcoins and the potential decrease in global cryptocurrency demand.
Overall Summary Outlook
The overall outlook for ETH/USD is bullish, with a mix of positive and neutral predictions.
The market is expected to experience a moderate increase, with some analysts predicting a potential bullish move targeting $2,600 and $2,800.
Real-Time Market Feed
As of the current time, ETH/USD is trading at $2,400, with a 2.0% increase in the last 24 hours.
Future Prediction
Short-Term: Bullish: $2,500-$2,600, Bearish: $2,300-$2,200
Medium-Term: Bullish: $2,800-$3,000, Bearish: $2,000-$1,800
Long-Term: Bullish: $3,200-$3,500, Bearish: $1,800-$1,600
⚠️Trading Alert : News Releases and Position Management 📰 🗞️ 🚫🚏
As a reminder, news releases can have a significant impact on market prices and volatility. To minimize potential losses and protect your running positions,
we recommend the following:
Avoid taking new trades during news releases
Use trailing stop-loss orders to protect your running positions and lock in profits
💖Supporting our robbery plan will enable us to effortlessly make and steal money 💰💵 Tell your friends, Colleagues and family to follow, like, and share. Boost the strength of our robbery team. Every day in this market make money with ease by using the Thief Trading Style.🏆💪🤝❤️🎉🚀
I'll see you soon with another heist plan, so stay tuned 🤑🐱👤🤗🤩

Don't Miss Out We Predicted S&P 500 Drop to 5740 It Happened📉 Don't Miss Out – We Predicted S&P 500 Drop to 5740 , and It Happened! 🔥
In our previous recommendation, we clearly stated that S&P 500 would drop to 5740 , and it happened exactly as predicted, reaching the 61% Fibonacci level! ✅
🚨 Will You Wait Until You Fall with Losing Stocks? 🚨
The market doesn’t wait, and opportunities don’t last forever! If you’ve been following our recommendations, you’ve avoided the collapsing stocks we warned about.
⚠️ Don’t let the market get ahead of you – Follow our recommendations to stay on the winning side! 🔥💰
#SPX500 #Trading #TechnicalAnalysis #InvestmentOpportunities
