MARUTI KEY LEVELS FOR 27/01/2025**Explanation:**
This trading system helps you avoid blind trades by providing confirmation for better entries and exits.
**Entry/Exit Points:**
- **Entry/Exit Lines:** Use the BLACK line for long trades and the RED line for short trades, based on confirmation from your trading plan.
- **Stop Loss:** For long trades, set the stop loss at the RED line below. For short trades, set it at the BLACK line above.
- **Take Profit:** For long trades, target the next RED line above. For short trades, target the next BLACK line below.
**Timeframe:**
Use a 5 timeframe for trading.
**Risk Disclaimer:**
This setup is for educational purposes. I'm not responsible for your gains or losses. Check the chart for more details.
Gann

NAUKRI KEY LEVELS FOR 27/01/2025**Explanation:**
This trading system helps you avoid blind trades by providing confirmation for better entries and exits.
**Entry/Exit Points:**
- **Entry/Exit Lines:** Use the BLACK line for long trades and the RED line for short trades, based on confirmation from your trading plan.
- **Stop Loss:** For long trades, set the stop loss at the RED line below. For short trades, set it at the BLACK line above.
- **Take Profit:** For long trades, target the next RED line above. For short trades, target the next BLACK line below.
**Timeframe:**
Use a 5 timeframe for trading.
**Risk Disclaimer:**
This setup is for educational purposes. I'm not responsible for your gains or losses. Check the chart for more details.

ADANIENT KEY LEVELS FOR 27/01/2025**Explanation:**
This trading system helps you avoid blind trades by providing confirmation for better entries and exits.
**Entry/Exit Points:**
- **Entry/Exit Lines:** Use the BLACK line for long trades and the RED line for short trades, based on confirmation from your trading plan.
- **Stop Loss:** For long trades, set the stop loss at the RED line below. For short trades, set it at the BLACK line above.
- **Take Profit:** For long trades, target the next RED line above. For short trades, target the next BLACK line below.
**Timeframe:**
Use a 5 timeframe for trading.
**Risk Disclaimer:**
This setup is for educational purposes. I'm not responsible for your gains or losses. Check the chart for more details.

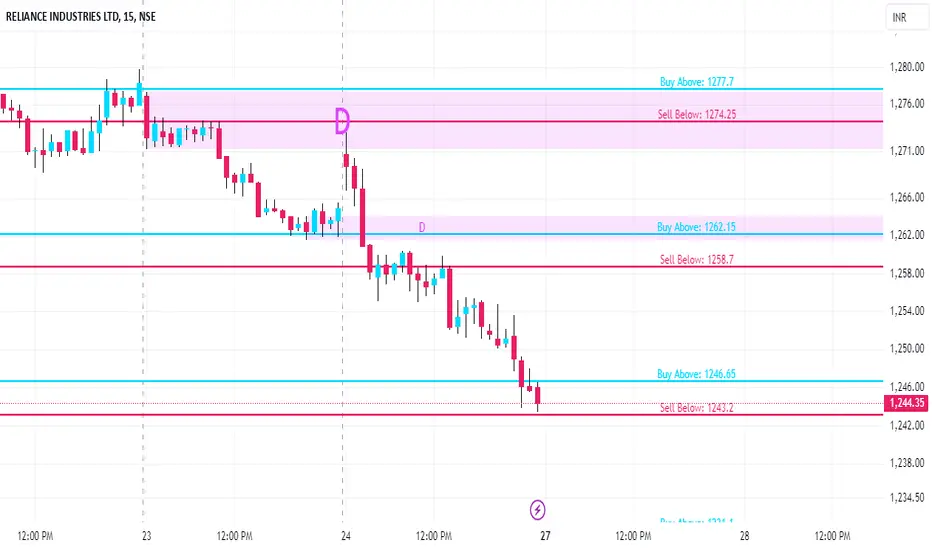
RELIANCE KEY LEVELS FOR 27/01/2025**Explanation:**
This trading system helps you avoid blind trades by providing confirmation for better entries and exits.
**Entry/Exit Points:**
- **Entry/Exit Lines:** Use the BLACK line for long trades and the RED line for short trades, based on confirmation from your trading plan.
- **Stop Loss:** For long trades, set the stop loss at the RED line below. For short trades, set it at the BLACK line above.
- **Take Profit:** For long trades, target the next RED line above. For short trades, target the next BLACK line below.
**Timeframe:**
Use a 5 timeframe for trading.
**Risk Disclaimer:**
This setup is for educational purposes. I'm not responsible for your gains or losses. Check the chart for more details.
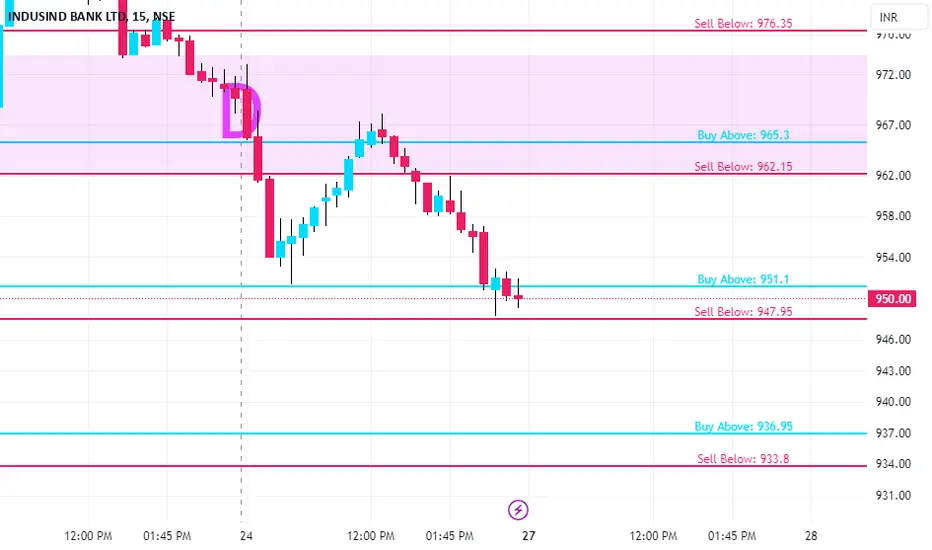
INDUSINDBK KEY LEVELS FOR 27/01/2025**Explanation:**
This trading system helps you avoid blind trades by providing confirmation for better entries and exits.
**Entry/Exit Points:**
- **Entry/Exit Lines:** Use the BLACK line for long trades and the RED line for short trades, based on confirmation from your trading plan.
- **Stop Loss:** For long trades, set the stop loss at the RED line below. For short trades, set it at the BLACK line above.
- **Take Profit:** For long trades, target the next RED line above. For short trades, target the next BLACK line below.
**Timeframe:**
Use a 5 timeframe for trading.
**Risk Disclaimer:**
This setup is for educational purposes. I'm not responsible for your gains or losses. Check the chart for more details.
SBIN KEY LEVELS FOR 27/01/2025**Explanation:**
This trading system helps you avoid blind trades by providing confirmation for better entries and exits.
**Entry/Exit Points:**
- **Entry/Exit Lines:** Use the BLACK line for long trades and the RED line for short trades, based on confirmation from your trading plan.
- **Stop Loss:** For long trades, set the stop loss at the RED line below. For short trades, set it at the BLACK line above.
- **Take Profit:** For long trades, target the next RED line above. For short trades, target the next BLACK line below.
**Timeframe:**
Use a 5 timeframe for trading.
**Risk Disclaimer:**
This setup is for educational purposes. I'm not responsible for your gains or losses. Check the chart for more details.

AXISBANK KEY LEVELS FOR 27/01/2025**Explanation:**
This trading system helps you avoid blind trades by providing confirmation for better entries and exits.
**Entry/Exit Points:**
- **Entry/Exit Lines:** Use the BLACK line for long trades and the RED line for short trades, based on confirmation from your trading plan.
- **Stop Loss:** For long trades, set the stop loss at the RED line below. For short trades, set it at the BLACK line above.
- **Take Profit:** For long trades, target the next RED line above. For short trades, target the next BLACK line below.
**Timeframe:**
Use a 5 timeframe for trading.
**Risk Disclaimer:**
This setup is for educational purposes. I'm not responsible for your gains or losses. Check the chart for more details.

RBLBANK KEY LEVELS FOR 27/01/2025**Explanation:**
This trading system helps you avoid blind trades by providing confirmation for better entries and exits.
**Entry/Exit Points:**
- **Entry/Exit Lines:** Use the BLACK line for long trades and the RED line for short trades, based on confirmation from your trading plan.
- **Stop Loss:** For long trades, set the stop loss at the RED line below. For short trades, set it at the BLACK line above.
- **Take Profit:** For long trades, target the next RED line above. For short trades, target the next BLACK line below.
**Timeframe:**
Use a 5 timeframe for trading.
**Risk Disclaimer:**
This setup is for educational purposes. I'm not responsible for your gains or losses. Check the chart for more details.

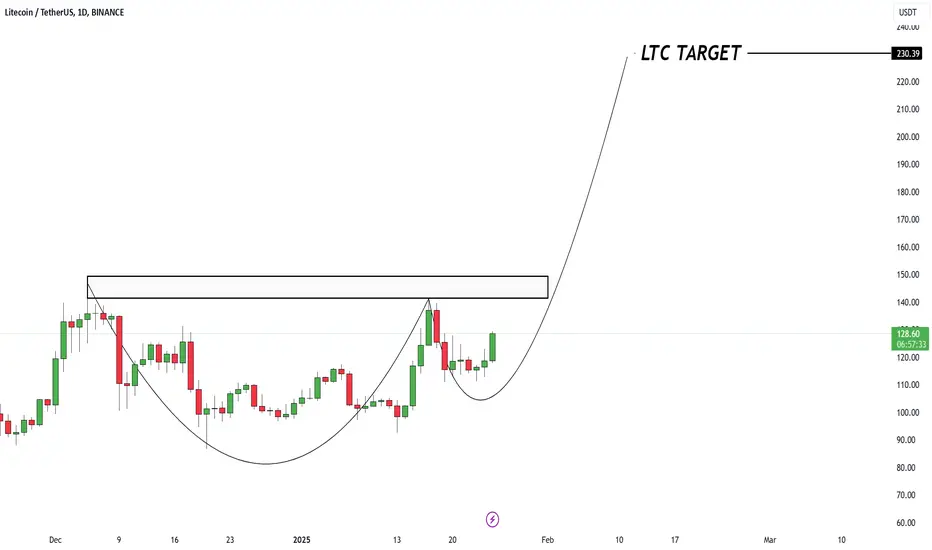
LTC USDT💰 CRYPTOCAP:LTC USDT
# LTC The Cup & Handle formation on the daily chart is signaling a powerful breakout 🐃
Strong resistance around $150 is the key level to watch before heading toward the target zone.
🎯 Target: $230.39
Dent LongNot the prices we wanted from alts, but this is crypto, she does whatever she wants.
Trying to catch a long from 0.00098$ to 0.001$.
I will use 5x leverage .
Risk-reward is more than decent.
I think dent can pull a 2 cents at least in this cycle even though this cycle has been rubbish so far for most of the altcoins.

Whale Moves: $20M $OM Leaves Binance! NASDAQ:OM whales are sending signals! 🚨
$20M left Binance in 24 hours, and the average buy price was $3.71.
#MANTRA pump is loading—are you paying attention anon?
@MANTRA_Chain NASDAQ:OM .

PNUTUSDT: Near Its Critical Pivot – Will the Market Make Its MovPNUTUSDT is sitting on the edge of a key threshold at $0.3188, just a breath away from its absolute low of $0.3044, set today. With an 87% plunge from its all-time high of $2.5084, the asset is signaling a potential turning point. RSI at 41.17 indicates a mildly oversold condition, setting the stage for either a rebound or a deeper dive.
Recent patterns, including VSA Buy signals and volume surges, suggest that bullish energy might be brewing just under the surface. Yet, the heavy resistance levels above at $0.3668 and $0.4176 could act as significant tests for any upward momentum. With macroeconomic factors steady but market sentiment edgy, PNUTUSDT traders face the pressing question: is this the bottom, or could another leg down be imminent?
This is a critical moment for both short-term traders eyeing quick reversals and long-term investors evaluating the larger picture. Will you seize the potential rebound or wait for clearer confirmation? Stay tuned – the next move could define the trend for weeks to come!
PNUTUSDT Roadmap: Patterns That Defined the Price Action
PNUTUSDT has been a rollercoaster for traders recently, with distinct patterns revealing the market’s intentions. Let’s dive into the key candle patterns and how they played out, separating the noise from actionable moves.
1. The "Increased Sell Volumes" Pattern (January 25, 2025)
Direction: Sell
Price opened at $0.3182 and closed at $0.3051. This bearish setup pushed the price near the asset's absolute low of $0.3044. The sell-off was decisive, as subsequent price action confirmed the direction with a continuation towards the $0.3044 low, validating the main direction of the pattern.
2. "VSA Buy Pattern Extra 1st" (January 24, 2025)
Direction: Buy
Opening at $0.3239, the price moved higher briefly but closed at $0.3182. While the main direction indicated a buy opportunity, the following sell-off undermined its potential, indicating this pattern failed to confirm its trigger.
3. "Increased Sell Volumes" (January 23, 2025)
Direction: Sell
Opening at $0.3561 and closing at $0.3527, the pattern confirmed its sell bias as the price dipped further in subsequent candles, aligning with the bearish sentiment. This gave traders an ideal short entry opportunity.
4. "Buy Volumes Takeover" (January 23, 2025)
Direction: Buy
Despite the bullish direction, this pattern struggled for validation as sell-side pressure dominated immediately afterward. This pattern underperformed, marking a skip in actionable moves.
5. "VSA Manipulation Buy Pattern 4th" (January 22, 2025)
Direction: Buy
This was the turning point. The price moved higher, confirming its trigger by closing above the previous resistance level and aligning with the predicted bullish move. Traders who caught this shift enjoyed a strong recovery rally.
Key Takeaways from the Roadmap:
"Increased Sell Volumes" patterns have consistently delivered, highlighting a reliable bearish trigger.
"Buy Volumes Takeover" patterns often need clearer confirmation to provide actionable trades.
"VSA Manipulation Buy Patterns" showed strength in directional accuracy, offering robust opportunities when validated.
This roadmap emphasizes how selective trading, focused on validated patterns, helps cut through the market's noise and capture meaningful moves. For traders, knowing when to act—and when to stay out—is the game changer.
Technical & Price Action Analysis: Key Levels to Watch
The PNUTUSDT market is heating up, and every trader knows that nailing the key levels can make or break your strategy. Here’s a breakdown of the most critical support and resistance zones on the radar right now. If these levels don’t hold, expect them to flip and act as barriers for price action—classic support-turns-resistance and vice versa.
Support Levels
First Support: $0.3044 — The absolute low and a key battleground. If buyers fail to defend this level, the bears might take full control. Second Support: $0.3668 — A short-term cushion for buyers to regroup. Losing this zone signals trouble for the bulls.
Resistance Levels
First Resistance: $0.3668 — If price fails to reclaim this level, it’ll act as a headwind for bullish momentum.
Second Resistance: $0.4176 — A crucial ceiling for bulls. Breakout above could open doors to new highs. Third Resistance: $0.4513 — A make-or-break zone for major trend shifts. Fourth Resistance: $0.5165 — Only serious bullish strength can push past this level. Fifth Resistance: $0.6692 — The long-term target for any meaningful upside.
Powerful Support Levels
Critical Zone: $0.6521 — This level must hold if the bulls want to regain control of the narrative. If breached, expect a deeper pullback.
Powerful Resistance Levels
Currently Undefined — Keep an eye on momentum and price reaction at the aforementioned resistance zones.
As always, respect these levels and watch for confirmations—breakouts need follow-through, and false moves can wreck your game. Trade smart, manage risk, and don’t chase—let the market come to you!
Trading Strategies Using Fibonacci Rays
Understanding the "Rays from the Beginning of Movement" concept allows traders to harness the natural dynamics of Fibonacci proportions and geometric levels. These rays provide a dynamic framework to identify key zones for price interactions, predicting possible reversals or continuations with precision. Let’s explore how to use these rays for your trading strategy.
Concept of Rays
Rays are constructed from the beginning of a movement pattern, providing dynamic levels that adapt as the market evolves. They rely on Fibonacci angles to establish critical zones where price interaction is likely to occur. Key insights include:
Price Interaction: Signals either reversal or continuation but requires confirmation from dynamic factors, such as patterns or volume shifts.
Adaptability: Rays adjust as new patterns emerge, creating a flexible approach to identifying key movement boundaries.
Complementary Analysis: Crossing points with moving averages (MA50, MA100, MA200, etc.) strengthen the significance of ray zones.
Two Scenarios: Optimistic and Pessimistic
Optimistic Scenario
Interaction with $0.3668 (Resistance Level): If price breaks this ray and confirms with volume and pattern, we could see a continuation to $0.4176 (next ray).
Interaction with MA100 at $0.3557: A confirmed close above this moving average signals a bullish trend with the potential to aim for $0.4513.
Final Target: $0.5165 as a long-term ray and Fibonacci convergence zone.
Pessimistic Scenario
Failure at $0.3668 Resistance: Price interaction signals rejection and a probable pullback to $0.3044 (Support Level).
Interaction with MA200 at $0.4328: A failure to break above could lead to a deeper sell-off to retest $0.3044.
Break Below $0.3044: A move below this level indicates strong bearish momentum, with $0.6521 becoming the next significant resistance as the price reverses.
Suggested Trades
Trade 1: Buy Breakout at $0.3668
Target 1: $0.4176
Target 2: $0.4513
Comment: Wait for a confirmed breakout with volume above the ray.
Trade 2: Short at Rejection Near $0.4176
Target 1: $0.3668
Target 2: $0.3044
Comment: Watch for bearish patterns or volume declines to confirm entry.
Trade 3: Buy Near $0.3044 Support Zone
Target 1: $0.3668
Target 2: $0.4176
Comment: Confirm with interaction at the ray and a bullish reversal pattern.
Trade 4: Short After MA200 Failure at $0.4328
Target 1: $0.3668
Target 2: $0.3044
Comment: Momentum loss and price rejection confirm bearish continuation.
Key Takeaway:
Trade between rays like stepping stones, moving from one target to the next. Confirm entries after interaction with rays and dynamic factors like volume or MA crossings. Each ray represents not just a technical level but a gateway to the next movement zone. Use this framework to navigate the market with confidence and precision!
Let’s Stay Connected and Trade Smarter Together!
Got questions or thoughts about the analysis? Drop them in the comments below—I’m always happy to chat and help clarify anything! Your feedback and discussions are what keep this trading journey exciting and collaborative.
If you found this idea useful, don’t forget to hit Boost and save it to track how the price moves along these mapped-out levels. Understanding the points where trades make sense is key to growing as a trader, so let’s watch the market evolve together.
By the way, the rays and levels in this strategy are drawn automatically using my custom indicator—it’s available privately. If you’re interested in using it, feel free to message me directly for details. I also offer analysis on any asset you’d like, whether it’s a free post here or a personal, private breakdown for your unique ideas.
The beauty of this strategy is its versatility—it works across all assets, and price always respects these dynamic rays. If you have a specific asset you’d like analyzed, hit Boost, leave a comment, and I’ll do my best to prioritize it.
Make sure to follow me here on TradingView to stay updated with my latest ideas and strategies. This is where I post regularly, so don’t miss out on the tools and insights that can give your trading the edge it deserves. Let’s grow and trade together! 🚀

Will CVCUSDT Rebound or Continue to Decline?Can the Bulls Revive Momentum, or Will the Bears Rule?
With the current price of $0.14603, CVCUSDT has deviated nearly -54% from its all-time high of $0.31737, set back in March 2024. The market has been hovering in a zone of indecision, with its RSI at 52.7, signaling a neutral stance—neither overbought nor oversold.
Recent patterns, such as the "VSA Buy Pattern Extra 1st," suggest potential upside, supported by the MA50 of $0.14429 acting as dynamic support. However, resistance looms at $0.15543, testing the resolve of buyers. Meanwhile, macroeconomic headwinds and a cooling momentum in MFI at 45.57 underscore a challenging road ahead.
The question remains: Will the bulls manage to overcome resistance, or is this the setup for a further leg downward?
In this pivotal moment, traders must assess whether the recent upward flickers signal a recovery or merely a pause in the ongoing decline. Stay tuned for further insights!
Let me know if you'd like me to expand or adjust the tone.
Roadmap of Recent Patterns: CVCUSDT’s Price Movements Decoded
This roadmap dives deep into the chain of verified patterns shaping CVCUSDT’s recent price movements. Only the patterns with confirmed trigger points and validated main directions are included, ensuring we focus on actionable insights for traders.
January 23, 21:00 UTC – Buy Volumes Takeover (Sell Direction)
At this point, the price closed at $0.14092, signaling a potential sell-off. The next pattern confirmed this direction as the subsequent bars pushed the price down further, reaffirming the sell bias.
January 24, 04:00 UTC – Increased Buy Volumes (Buy Direction)
Here, the market showed a rebound with a close at $0.14366, above the key low of $0.14080. This directional shift was validated by the subsequent upward momentum, demonstrating the effectiveness of this buy setup.
January 24, 06:00 UTC – VSA Sell Pattern 2 (Sell Direction)
Price action confirmed this sell direction as the next few bars pushed the price downward, with a close at $0.14566, validating the pattern’s prediction. The previous buy trigger point around $0.14366 acted as temporary resistance.
January 24, 13:00 UTC – VSA Sell Pattern 4 (Sell Direction)
This was a textbook example of follow-through. The price closed lower at $0.14765, maintaining the bearish momentum. Trigger zones from earlier patterns remained untested as the market adhered to the bearish outlook.
January 25, 00:00 UTC – VSA Buy Pattern Extra 1st (Buy Direction)
Closing at $0.14281, this pattern marked a shift to bullish momentum. The price moved upward in the next sessions, confirming the buy direction and establishing support around the $0.14268 zone.
January 25, 12:00 UTC – Current Status
The most recent patterns suggest a tug-of-war between buyers and sellers, with $0.15543 resistance as the critical level to watch. Future confirmation of buy or sell zones will depend on whether the market respects the established supports and resistances.
This sequence highlights a dynamic interplay between bullish and bearish setups, with actionable confirmation points aligning with broader market movements. Traders should remain vigilant, especially around the resistance zones, to capitalize on potential breakout opportunities.
Technical & Price Action Analysis: Key Levels in Focus
In this section, we break down the major support and resistance levels currently shaping CVCUSDT. These levels are not just markers—they’re the battlegrounds where buyers and sellers duke it out. If these levels don’t hold, they will flip roles and become strong resistance zones to watch for potential pullbacks.
Support Levels
0.14009 – A critical level where buyers have stepped in before. If it doesn’t hold, expect it to act as resistance on the next push upward.
0.13301 – The last line of defense before the bears take full control.
Resistance Levels
0.15543 – First big hurdle for the bulls. A clean break here could open the door to higher highs.
0.16423 – Momentum needs to stay strong to clear this zone.
0.17641 – A key level that could act as a magnet if momentum continues.
0.18664 – Breaking this will be a significant milestone for bulls, confirming mid-term strength.
0.18997 – The final major resistance before potential new highs. Watch for exhaustion here.
Powerful Support Levels
Currently absent—suggesting the market may lack the deep buyer conviction needed for a solid base.
Powerful Resistance Levels
0.11096 – A fortress of resistance; if tested and rejected, it could send the price spiraling downward.
0.08804 – A distant, but highly significant, ceiling that could come into play in a bear-dominated market.
These levels will define the next moves. Bulls need to lock and hold support levels, while bears are waiting for resistance to falter. Stay sharp—levels that break could flip roles and become the next hotspots for action.
Concept of Rays: A Precise Framework for CVCUSDT Trading Strategies
The "Rays from the Beginning of Movement" concept relies on Fibonacci-based principles to create dynamic levels that predict potential price movements. These rays adapt to new trends and corrective phases, offering a unique advantage in forecasting interaction zones. Combined with Moving Averages (MA) and VSA rays visible on the user’s chart, they provide actionable insights for both bullish and bearish scenarios.
How Rays Work in Practice
Fibonacci Rays : Built from the inception of a price movement, these rays define the potential movement boundaries and key zones of interaction.
Dynamic Support and Resistance : Moving Averages such as MA50 ($0.14429), MA100 ($0.14601), and MA200 ($0.15353) act as dynamic factors, confirming trend direction and interaction points with the rays.
Adaptive Levels : Rays adjust with new patterns, ensuring relevance even as trends evolve. Price movement from one ray to the next defines key trade targets.
Entry Points : Enter trades only after price interaction with a ray and confirmation of a move’s direction. This reduces noise and increases precision.
Trading Scenarios
Optimistic Scenario
In this scenario, bullish momentum dominates after price interacts with ascending rays and key Moving Averages.
Entry: On a breakout above $0.14601 (MA100).
First Target: $0.15543 (first ray-resistance interaction).
Second Target: $0.16423 (next ray level).
Third Target: $0.17641 (extension target).
Rationale: Ascending rays combined with bullish MA crossovers indicate strength, and the price is likely to travel from one ray to the next before pausing.
Pessimistic Scenario
If bearish factors take over, the price is expected to interact with descending rays, forming resistance and initiating a move downward.
Entry: On a breakdown below $0.14429 (MA50).
First Target: $0.14009 (first ray-support interaction).
Second Target: $0.13301 (deeper ray support).
Third Target: $0.11096 (extension to powerful ray resistance).
Rationale: Interaction with descending rays and Moving Averages confirms the bearish continuation, with prices likely moving systematically through descending ray levels.
Proposed Trades
Breakout Trade: Enter above $0.14601 with targets $0.15543, $0.16423, and $0.17641.
Comment: Watch for a strong bullish MA cross and ray interaction for confirmation.
Pullback Trade: Enter on rejection near $0.14429 with targets $0.14009 and $0.13301.
Comment: Ensure interaction with descending rays to validate bearish momentum.
Trend Continuation: Enter on sustained movement within ray boundaries, aiming for the next ray level in sequence.
Comment: Use VSA and price-volume signals for additional confirmation.
In both scenarios, patience and adherence to ray interactions are crucial. These dynamic zones act as guides, helping traders navigate from ray to ray with calculated precision.
Let’s Keep the Conversation Going!
Hey, traders! If you’ve got any questions or thoughts, drop them right in the comments—I’d love to hear from you. Whether it’s about this analysis or another asset you’d like to see marked up, I’m here to help. Your feedback and ideas keep the trading community sharp!
If you found this roadmap useful, don’t forget to hit that Boost button and save this post. Come back later to see how the price respects the levels and rays in the markup. This isn’t just a forecast; it’s an opportunity to learn how key zones define trading opportunities.
By the way, the rays and levels you see here are drawn automatically using my private indicator-strategy. If you’re interested in exploring it for your own trades, feel free to reach out via direct message—I’ll share the details on how it works.
Need analysis for a specific asset? I’ve got you covered. Let me know in the comments or DMs. Some ideas I can publish publicly for everyone to benefit, and if you prefer a personal breakdown, we can arrange that too. Rays work on any asset, and I can tailor them to your needs.
Make sure to follow me here on TradingView to stay updated. This is where I post all my articles, ideas, and insights to keep you ahead in the market. Let’s build better trades together!

btc update on 4 hourplease be aware of a possible correction incoming banana top formation is a very bad sign

SHPING 6h Chart Long for 270%?Figured i would publish this idea on SHPING since i just got done working on it. Not Financial Advice, Im not a Financial Advisor.
That being said I personally am loading up in discount orange, scalping carefulling in yellow, and offloading in green while preparing for the big move.. if it ever happens of course.
Have Fun and Trade Safe!

dogegov is donethe hype is over.. this is another memecoin that wont see ath again. the false hope was elon promoting this coin but it never happened.. now that dogegov is here what the cause for this price to go higher?

QNX Everywhere.”Every movement in the market is the result of a natural law and of a cause which exists long before the effect takes place and can be determined years in advance. The future is but a repetition of the past, as the Bible plainly states…” -- W.D. Gann
youtube.com
"Down just means, not up yet" -- Bathsalt


BANKNIFTY KEY LEVELS FOR 27/01/2025**Explanation:**
This trading system helps you avoid blind trades by providing confirmation for better entries and exits.
**Entry/Exit Points:**
- **Entry/Exit Lines:** Use the BLACK line for long trades and the RED line for short trades, based on confirmation from your trading plan.
- **Stop Loss:** For long trades, set the stop loss at the RED line below. For short trades, set it at the BLACK line above.
- **Take Profit:** For long trades, target the next RED line above. For short trades, target the next BLACK line below.
**Timeframe:**
Use a 5 timeframe for trading.
**Risk Disclaimer:**
This setup is for educational purposes. I'm not responsible for your gains or losses. Check the chart for more details.

NIFTY 50 KEY LEVELS FOR 27/01/2025**Explanation:**
This trading system helps you avoid blind trades by providing confirmation for better entries and exits.
**Entry/Exit Points:**
- **Entry/Exit Lines:** Use the BLACK line for long trades and the RED line for short trades, based on confirmation from your trading plan.
- **Stop Loss:** For long trades, set the stop loss at the RED line below. For short trades, set it at the BLACK line above.
- **Take Profit:** For long trades, target the next RED line above. For short trades, target the next BLACK line below.
**Timeframe:**
Use a 5 timeframe for trading.
**Risk Disclaimer:**
This setup is for educational purposes. I'm not responsible for your gains or losses. Check the chart for more details.

SOL USDT🚨 CRYPTOCAP:SOL on Fire! 🔥
💰 #Solana is consolidating near the top of a bullish structure on the weekly chart 👀
With strong support at $258.41, it feels like a breakout is imminent…
Ready for liftoff in 3… 2… 1… 🚀
🎯 Target 1: $424.66
🎯 Target 2: $513.83

Revolutionizing RWA with Real-World ImpactWhy NASDAQ:OM will hit $10+ soon?
1⃣ Only blockchain with real deal pipeline
2⃣ DAMAC chose @MANTRA_Chain for SEED_TVCODER77_ETHBTCDATA:1B tokenization
3⃣ DAMAC's FWB:20B US expansion needs blockchain infrastructure
4⃣ First-mover in regulated #RWA space
5⃣ Google Cloud backing
Institutional money flowing in. Top 20 incoming.
#Layer1 #MANTRA #DeFi
