nas to 37000k retracement then higher. If Nas drops no further than 21200 and 21500 please buy buy buy. If it holds still , the Feb monthly candle may deep briefly then shoot up. BUY the deep. ...Next take profit 25900 next take profit 37000..then higher take profit in the 40's.
king;s ideas
Gann

ARCUSDT: Trade Plan.ARC is moving in side ways and currently we have 2 plans of trade long and short.
1st Trade: BUY/LONG
We can buy on CMP, which is the 0.618 level of the FIB and this is the Gold Zone for the Entry and we will take trade on the double top.
2nd Trade: SELL/SHORT
We can short the trade after the double top confirmation. and wait for the any bearish candle appear on the chart.

Oriental KOPI Day 2 - RM1.000+Lets see if this plays out. On 5 minute TF, looks like Wave 1 to 5 and ABC have been completed. On a bigger TF, the next move from here could be Primary Wave 3.. could TP at around 1.100+ at Fibo 1.618 area

ETH/USDTETHEREUM looks ready for another leg up in the monthly chart
WE MAY LIKELY SEE ETH BREAK ITS ALL TIME HIGH THIS YEAR

Gold To Touch 2720Gold (XAU/USD) fails to extend its weekly rally on Thursday, coming under some renewed selling pressure following three consecutive days of gains.
Indeed, the precious metal surged past $2,760 per troy ounce for the first time since early November on Wednesday, driven by persistent uncertainty surrounding announcements from former President Trump, particularly his stance on tariffs

MANTRA & DAMAC: A $1B RWA Revolution
With a FWB:20B investment for data centers in US with Trump, DAMAC’s SEED_TVCODER77_ETHBTCDATA:1B tokenization deal with @MANTRA_Chain marks a turning point for RWAs.
NASDAQ:OM Price target: $8 → $10 → $12
The top Layer-1 for RWAs is just getting started.
#MANTRA #DeFi #RWA

$OM: Poised for a $100B Breakout!🚨 NASDAQ:OM is looking to break out! 🚨
Why @MANTRA_Chain?
✅ First RWA-focused Layer-1
✅ Backed by DAMAC’s SEED_TVCODER77_ETHBTCDATA:1B tokenization deal + FWB:20B U.S. investments
✅ 10K TPS + IBC integration
✅ Real utility: Real estate, private equity, aviation, green assets, hospitality, datacenters
#MANTRA's vision of $100B onchain TVL by 2026 sounds about right. Wdyt?
#Altcoins #Binance #CryptoNews

SIEMENS KEY LEVELS FOR 24/01/2025**Explanation:**
This trading system helps you avoid blind trades by providing confirmation for better entries and exits.
**Entry/Exit Points:**
- **Entry/Exit Lines:** Use the BLACK line for long trades and the RED line for short trades, based on confirmation from your trading plan.
- **Stop Loss:** For long trades, set the stop loss at the RED line below. For short trades, set it at the BLACK line above.
- **Take Profit:** For long trades, target the next RED line above. For short trades, target the next BLACK line below.
**Timeframe:**
Use a 5 timeframe for trading.
**Risk Disclaimer:**
This setup is for educational purposes. I'm not responsible for your gains or losses. Check the chart for more details.

DIVISLAB KEY LEVELS FOR 24/01/2025**Explanation:**
This trading system helps you avoid blind trades by providing confirmation for better entries and exits.
**Entry/Exit Points:**
- **Entry/Exit Lines:** Use the BLACK line for long trades and the RED line for short trades, based on confirmation from your trading plan.
- **Stop Loss:** For long trades, set the stop loss at the RED line below. For short trades, set it at the BLACK line above.
- **Take Profit:** For long trades, target the next RED line above. For short trades, target the next BLACK line below.
**Timeframe:**
Use a 5 timeframe for trading.
**Risk Disclaimer:**
This setup is for educational purposes. I'm not responsible for your gains or losses. Check the chart for more details.

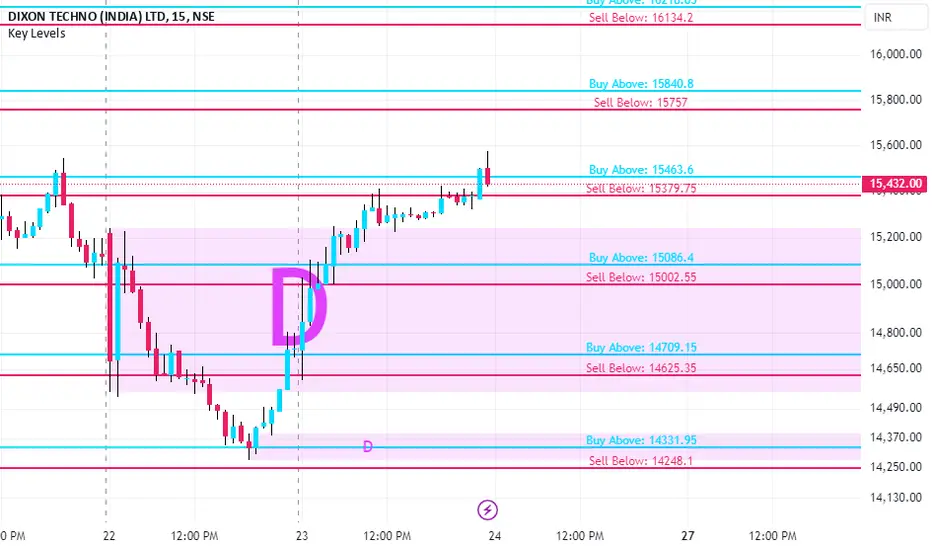
DIXON KEY LEVELS FOR 24/01/2025**Explanation:**
This trading system helps you avoid blind trades by providing confirmation for better entries and exits.
**Entry/Exit Points:**
- **Entry/Exit Lines:** Use the BLACK line for long trades and the RED line for short trades, based on confirmation from your trading plan.
- **Stop Loss:** For long trades, set the stop loss at the RED line below. For short trades, set it at the BLACK line above.
- **Take Profit:** For long trades, target the next RED line above. For short trades, target the next BLACK line below.
**Timeframe:**
Use a 5 timeframe for trading.
**Risk Disclaimer:**
This setup is for educational purposes. I'm not responsible for your gains or losses. Check the chart for more details.
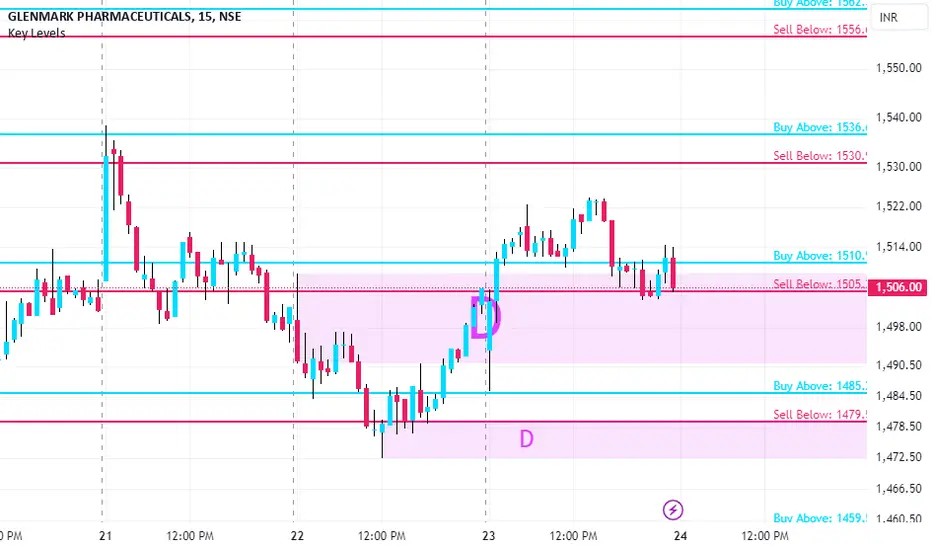
GLENMARK KEY LEVELS FOR 24/01/2025**Explanation:**
This trading system helps you avoid blind trades by providing confirmation for better entries and exits.
**Entry/Exit Points:**
- **Entry/Exit Lines:** Use the BLACK line for long trades and the RED line for short trades, based on confirmation from your trading plan.
- **Stop Loss:** For long trades, set the stop loss at the RED line below. For short trades, set it at the BLACK line above.
- **Take Profit:** For long trades, target the next RED line above. For short trades, target the next BLACK line below.
**Timeframe:**
Use a 5 timeframe for trading.
**Risk Disclaimer:**
This setup is for educational purposes. I'm not responsible for your gains or losses. Check the chart for more details.
ADANIENT KEY LEVELS FOR 24/01/2025**Explanation:**
This trading system helps you avoid blind trades by providing confirmation for better entries and exits.
**Entry/Exit Points:**
- **Entry/Exit Lines:** Use the BLACK line for long trades and the RED line for short trades, based on confirmation from your trading plan.
- **Stop Loss:** For long trades, set the stop loss at the RED line below. For short trades, set it at the BLACK line above.
- **Take Profit:** For long trades, target the next RED line above. For short trades, target the next BLACK line below.
**Timeframe:**
Use a 5 timeframe for trading.
**Risk Disclaimer:**
This setup is for educational purposes. I'm not responsible for your gains or losses. Check the chart for more details.

RELIANCE KEY LEVEL FOR 24/01/2025**Explanation:**
This trading system helps you avoid blind trades by providing confirmation for better entries and exits.
**Entry/Exit Points:**
- **Entry/Exit Lines:** Use the BLACK line for long trades and the RED line for short trades, based on confirmation from your trading plan.
- **Stop Loss:** For long trades, set the stop loss at the RED line below. For short trades, set it at the BLACK line above.
- **Take Profit:** For long trades, target the next RED line above. For short trades, target the next BLACK line below.
**Timeframe:**
Use a 5 timeframe for trading.
**Risk Disclaimer:**
This setup is for educational purposes. I'm not responsible for your gains or losses. Check the chart for more details.

BANKNIFTY KEY LEVELS FOR 24/01/2025**Explanation:**
This trading system helps you avoid blind trades by providing confirmation for better entries and exits.
**Entry/Exit Points:**
- **Entry/Exit Lines:** Use the BLACK line for long trades and the RED line for short trades, based on confirmation from your trading plan.
- **Stop Loss:** For long trades, set the stop loss at the RED line below. For short trades, set it at the BLACK line above.
- **Take Profit:** For long trades, target the next RED line above. For short trades, target the next BLACK line below.
**Timeframe:**
Use a 5 timeframe for trading.
**Risk Disclaimer:**
This setup is for educational purposes. I'm not responsible for your gains or losses. Check the chart for more details.

NIFTY 50 KEY LEVELS FOR 24/01/2025**Explanation:**
This trading system helps you avoid blind trades by providing confirmation for better entries and exits.
**Entry/Exit Points:**
- **Entry/Exit Lines:** Use the BLACK line for long trades and the RED line for short trades, based on confirmation from your trading plan.
- **Stop Loss:** For long trades, set the stop loss at the RED line below. For short trades, set it at the BLACK line above.
- **Take Profit:** For long trades, target the next RED line above. For short trades, target the next BLACK line below.
**Timeframe:**
Use a 5 timeframe for trading.
**Risk Disclaimer:**
This setup is for educational purposes. I'm not responsible for your gains or losses. Check the chart for more details.

SeiUsdt Detailed Gann AnalysisHello dear friends,
chart provides a clear grid of Gann levels plotted against price and time. Here's a detailed interpretation based on the chart provided....
---Overview---
The current price is at 0.3403 USDT, slightly above the 108° (0.4094 USDT) level but below 144° (0.4943 USDT), suggesting the price is within a bearish zone and struggling to break upward resistance.
Time and Price Intersection:
Vertical green grid lines indicate key time cycles where price action may align with Gann levels for a significant move.
The next major cycle aligns around mid-2025, signaling a potential trend change or acceleration.
Diagonal Lines:
The diagonal grid acts as trend guidance. If the price follows the upward diagonals, it reflects bullish momentum. Breaking downward diagonals suggests a bearish trend.
---Trading Insights---
A. Bullish Scenario:
If the price breaks above 0.4943 USDT (144°), it is likely to target 0.5877 USDT (180°).
Sustained buying pressure beyond 0.5877 USDT could push the price toward 0.6882 USDT (216°) and higher.
B. Bearish Scenario:
Failure to hold 0.3324 USDT (current support) could drive the price lower, targeting 0.2635 USDT (36°).
A break below 0.2635 USDT signals stronger bearish sentiment, potentially revisiting 0.2026 USDT (base level).
Practical Tricks for Using This Chart
Set Alerts on Key Levels:
Use TradingView alerts for price nearing levels like 180° (0.5877) or 144° (0.4943).
Combine Indicators:
Pair Gann levels with RSI or MACD to confirm reversals or trend continuations near key zones.
Monitor Time Cycles:
Watch for price movement near vertical green lines. Combine this with volume spikes to validate potential breakouts or breakdowns.
Use Diagonal Guidance:
Trade in the direction of the diagonal trendlines. For instance, if the price is above an upward diagonal, prioritize long positions.
Wish you best of luck Trading!

Bulls and Bears zone for 01-23-2025Yesterday SPX had gap up opening, narrow range bar accompanied by high volume and closed in bottom half. Just an observation.
Level to watch: 6112 --- 6114

Here is #LCID vibrations and target price for your referenceHere is #LCID vibrations and target price for your reference

#GOAT #shitcoinPay attention to this chart, every time it goes up, it drops three times.
The meme coin is worth investing in if the pump and dumps must standard, not pump for the empty the coins and exit the market.
These increases are because a number of traders are reducing volume and exiting from this shitcoin.
So every pump is an opportunity to exit this shitcoin.
It is a big mistake to think that the price has reached the lowest level and has the possibility of another pump and can make you a billion.
If one day this shitcoin grows by 200%, rest assured that other coins will grow by 1000%.
#GOAT #shitcoin
Pay attention to the social media and community of this shitcoin. It is completely closed and they are just watching the destruction of those who sold the coin to them at the highest price and are enjoying themselves with their money.

Is It Right Time To Buy Alts??**Bitcoin Dominance Update**
BTC.D is attempting to break the yellow resistance zone but has yet to succeed. This indicates that **altcoins still lack the momentum** for a strong buy opportunity.
Currently, BTC.D remains **below 58.72%**, which suggests the market is **not yet in a bullish phase**. However, there’s **no clear reversal confirmation** either.
**Key Takeaways:**
- **No buy signal for alts yet** – wait for BTC.D to show clearer movement.
- **Not bearish, but not bullish** – the market remains in a neutral zone.
- **Patience is key** – wait for a confirmed breakout or reversal before making moves.
Stay tuned for updates! 🚀

nifty coming toward 22677.75 till 3 feb 2025 on gann fan 1/2 Nifty heading toward 22677.75 till 3 feb 2025 on gann fan 1/2 level from high of 1/1 gann fan high level recorded on 27 sep 2024. 1/2 gann level is final support level if nifty breaks 1/2 gann fan level on 3 feb 2025 recession will be confirmed and market will head downwards otherwise it will reverse and make new high within a year.

Strategic Trading for Consistent GrowthWhen analyzing a trading opportunity, it is essential to consider the overall market conditions, technical indicators, and fundamental factors to create a well-rounded trading plan. Here’s a detailed walkthrough of my process for analysis and prediction:

Is This the Turning Point for BYBIT-SPECUSDT.P?Current Market Dynamics: A Pivot Moment for BYBIT-SPECUSDT.P
The cryptocurrency market often surprises, and BYBIT-SPECUSDT.P is no exception. Trading at $6.223, the asset finds itself 66.78% below its historical high of $18.735 from November 30, 2024, but also an impressive 46% above its absolute low of $4.262 in July 2024. Are we witnessing a buildup for the next major move?
The technical picture reveals key insights. The RSI14 on the hourly chart is deeply oversold at 26.15, indicating potential upward momentum brewing. Meanwhile, the MFI also signals undervaluation at 29.92. These indicators align with a possible bounce from the current consolidation zone.
A series of VSA Buy Patterns highlights a steady buying interest, with a recent 0.6% upward movement confirming bullish pressure. Yet, powerful resistance looms overhead at $7.055 and $7.452, which will need to break for a sustained rally.
The Intriguing Question: What's Next?
With prices hovering near critical levels, the stage is set for decisive action. Will bulls seize this as a launchpad for recovery, or are bears poised to press their advantage? The convergence of oversold signals and strong resistance tests could herald significant volatility.
Stay tuned for updates on this thrilling setup—your opportunity might just be around the corner.
Roadmap of BYBIT-SPECUSDT.P: A Playbook of Price Action
Understanding the market through its historical patterns is the key to staying ahead. Here’s a detailed breakdown of the major events shaping BYBIT-SPECUSDT.P, tracing each significant pattern and its price implications.
1. VSA Buy Pattern Extra 1st: January 23, 2025, 02:00 UTC
This bullish setup hinted at a potential upward movement. Price opened at $6.225, closed slightly lower at $6.216, and formed a low of $6.118. The main direction was Buy, signaling an impending bullish pressure.
Validation: The next pattern maintained a buying trajectory, closing higher in subsequent moves, confirming the accuracy of the bullish call.
2. VSA Buy Pattern Extra 1st: January 23, 2025, 01:00 UTC
A reinforcing bullish signal emerged, with an opening at $6.321 and a closing dip to $6.225, but this set the stage for a rebound. Low and high levels ($6.162 to $6.733) indicated market hesitation before the trend firmed up.
Validation: The direction remained consistent, as subsequent candles edged higher, confirming the trigger point's reliability.
3. VSA Buy Pattern Extra 1st: January 23, 2025, 00:00 UTC
This pattern marked an uptick in bullish confidence. The price action fluctuated between $6.277 and $6.912, with a clear move aligning with the Buy main direction.
Validation: A steady upward movement followed, further strengthening the bullish narrative.
4. Increased Sell Volumes: January 22, 2025, 20:00 UTC
A stark contrast emerged as the sell volumes peaked. Prices opened at $6.704 and plummeted to close at $6.456, setting a bearish undertone.
Validation: This pattern effectively predicted the selloff that extended into subsequent bars, proving its worth as a reversal indicator.
5. VSA Buy Pattern Extra 1st: January 22, 2025, 00:00 UTC
The market flipped bullish again, with the price moving from $6.905 to $6.628. A decisive direction shift was signaled.
Validation: True to its bullish call, this pattern initiated a recovery, validated by later price movement above the $6.7 zone.
Key Insights for Traders
Patterns that align with subsequent price action (e.g., VSA Buy Pattern Extra 1st) consistently deliver actionable signals. Increased Sell Volumes can provide crucial early warnings of reversals, enabling traders to hedge effectively. Adhering to trigger points ensures higher accuracy and confidence in trading decisions.
This roadmap not only reflects historical accuracy but also provides a guide for spotting actionable opportunities in real time.
Technical & Price Action Analysis: Key Support and Resistance Levels
Trading is all about catching the bounce or riding the breakout. Here’s the rundown of the key levels for BYBIT-SPECUSDT.P that traders should keep their eyes on. Remember, if these levels don’t hold, they’ll flip into resistance and become roadblocks for price action.
Support Levels:
First up, we’re looking at a soft landing zone that could provide a decent bounce opportunity. Monitor how the price reacts to this area to gauge momentum.
Resistance Levels:
The immediate barriers lie at $7.055, $7.452, and $7.968. These are the lines in the sand where bulls will face heavy fire. If the price can't break through, expect reversals back to support.
Powerful Support Levels:
Not much firepower here, meaning the price may lack strong buying interest on the downside.
Powerful Resistance Levels:
Eyes are on $5.539—this is the rock where many moves may stall. If this level flips into support, it’ll be a key confirmation of bullish dominance.
Pro Tip:
Keep an eye on how the price interacts with these levels. If a support doesn’t hold, it’s not just a miss—it’s a new ceiling traders will have to deal with. Always be prepared to pivot and adapt.
Trading isn’t about guessing—it’s about reacting. These levels are your roadmap to staying ahead of the pack.
Concept of Rays: Trading Strategies Based on Fibonacci Rays
The "Rays from the Beginning of Movement" concept provides a structured yet flexible system for analyzing and trading market movements. It combines Fibonacci principles with dynamic price behavior and technical analysis, creating a unique tool for identifying opportunities. Let’s dive into how to use this method effectively.
Core Idea
Fibonacci Rays form dynamic boundaries that guide price movements, signaling potential reversals or continuations. These rays interact with key levels and Moving Averages (MA50, MA100, MA200) to highlight zones where significant price action occurs.
The principle is simple: trade after price interaction with a ray and the appearance of a clear directional movement. This ensures higher confidence and allows riding the trend between rays.
Optimistic Scenario: Targets for Bulls
If the price interacts with ascending rays and shows strength, we target the next resistance levels.
First Target: $7.055 – A move above MA50 aligns with this zone, signaling continuation to $7.452.
Second Target: $7.968 – As price confirms momentum, this level becomes the next checkpoint.
Third Target: $10.057 – A breakout here could unlock higher levels, supported by interaction with MA200.
Pessimistic Scenario: Targets for Bears
Should price react to descending rays or fail to hold support levels, bearish setups become actionable.
First Target: $5.539 – Breakdown through MA50 and interaction with descending rays suggests further downside.
Second Target: $4.800 – A continuation of bearish momentum will likely test this zone.
Third Target: $4.262 – Retesting the absolute low completes this scenario.
Dynamic Price Interaction and Moving Averages
When price interacts with key Moving Averages, it strengthens the ray’s significance. For example:
Price holding above MA50 and interacting with an ascending ray indicates bullish continuation to the next ray.
Rejection at MA200, coupled with descending ray interaction, confirms bearish potential.
Suggested Trade Setups
Long Trade: Enter after price bounces off an ascending ray and moves above $7.055. First target: $7.452, then $7.968.
Short Trade: Enter after rejection at $6.800 (near MA100), targeting $5.539. Keep stops above MA100 to manage risk.
Swing Trade: If price consolidates near MA200 and interacts with rays, look for breakout or breakdown to capture the move toward the next ray level.
Scalping Trade: Use minor ray interactions for quick entries and exits, targeting the immediate next ray for profits.
Final Thoughts
The interplay of Fibonacci Rays, key levels, and Moving Averages provides a structured yet adaptive trading framework. By aligning trades with these dynamics, traders can capture movements with high confidence, knowing each step is guided by natural market principles.
Current Market Dynamics: A Pivot Moment for BYBIT-SPECUSDT.P
The cryptocurrency market often surprises, and BYBIT-SPECUSDT.P is no exception. Trading at $6.223, the asset finds itself 66.78% below its historical high of $18.735 from November 30, 2024, but also an impressive 46% above its absolute low of $4.262 in July 2024. Are we witnessing a buildup for the next major move?
The technical picture reveals key insights. The RSI14 on the hourly chart is deeply oversold at 26.15, indicating potential upward momentum brewing. Meanwhile, the MFI also signals undervaluation at 29.92. These indicators align with a possible bounce from the current consolidation zone.
A series of VSA Buy Patterns highlights a steady buying interest, with a recent 0.6% upward movement confirming bullish pressure. Yet, powerful resistance looms overhead at $7.055 and $7.452, which will need to break for a sustained rally.
The Intriguing Question: What's Next?
With prices hovering near critical levels, the stage is set for decisive action. Will bulls seize this as a launchpad for recovery, or are bears poised to press their advantage? The convergence of oversold signals and strong resistance tests could herald significant volatility.
Stay tuned for updates on this thrilling setup—your opportunity might just be around the corner.
Roadmap of BYBIT-SPECUSDT.P: A Playbook of Price Action
Understanding the market through its historical patterns is the key to staying ahead. Here’s a detailed breakdown of the major events shaping BYBIT-SPECUSDT.P, tracing each significant pattern and its price implications.
1. VSA Buy Pattern Extra 1st: January 23, 2025, 02:00 UTC
This bullish setup hinted at a potential upward movement. Price opened at $6.225, closed slightly lower at $6.216, and formed a low of $6.118. The main direction was Buy, signaling an impending bullish pressure.
Validation: The next pattern maintained a buying trajectory, closing higher in subsequent moves, confirming the accuracy of the bullish call.
2. VSA Buy Pattern Extra 1st: January 23, 2025, 01:00 UTC
A reinforcing bullish signal emerged, with an opening at $6.321 and a closing dip to $6.225, but this set the stage for a rebound. Low and high levels ($6.162 to $6.733) indicated market hesitation before the trend firmed up.
Validation: The direction remained consistent, as subsequent candles edged higher, confirming the trigger point's reliability.
3. VSA Buy Pattern Extra 1st: January 23, 2025, 00:00 UTC
This pattern marked an uptick in bullish confidence. The price action fluctuated between $6.277 and $6.912, with a clear move aligning with the Buy main direction.
Validation: A steady upward movement followed, further strengthening the bullish narrative.
4. Increased Sell Volumes: January 22, 2025, 20:00 UTC
A stark contrast emerged as the sell volumes peaked. Prices opened at $6.704 and plummeted to close at $6.456, setting a bearish undertone.
Validation: This pattern effectively predicted the selloff that extended into subsequent bars, proving its worth as a reversal indicator.
5. VSA Buy Pattern Extra 1st: January 22, 2025, 00:00 UTC
The market flipped bullish again, with the price moving from $6.905 to $6.628. A decisive direction shift was signaled.
Validation: True to its bullish call, this pattern initiated a recovery, validated by later price movement above the $6.7 zone.
Key Insights for Traders
Patterns that align with subsequent price action (e.g., VSA Buy Pattern Extra 1st) consistently deliver actionable signals. Increased Sell Volumes can provide crucial early warnings of reversals, enabling traders to hedge effectively. Adhering to trigger points ensures higher accuracy and confidence in trading decisions.
This roadmap not only reflects historical accuracy but also provides a guide for spotting actionable opportunities in real time.
Technical & Price Action Analysis: Key Support and Resistance Levels
Trading is all about catching the bounce or riding the breakout. Here’s the rundown of the key levels for BYBIT-SPECUSDT.P that traders should keep their eyes on. Remember, if these levels don’t hold, they’ll flip into resistance and become roadblocks for price action.
Support Levels:
First up, we’re looking at a soft landing zone that could provide a decent bounce opportunity. Monitor how the price reacts to this area to gauge momentum.
Resistance Levels:
The immediate barriers lie at $7.055, $7.452, and $7.968. These are the lines in the sand where bulls will face heavy fire. If the price can't break through, expect reversals back to support.
Powerful Support Levels:
Not much firepower here, meaning the price may lack strong buying interest on the downside.
Powerful Resistance Levels:
Eyes are on $5.539—this is the rock where many moves may stall. If this level flips into support, it’ll be a key confirmation of bullish dominance.
Pro Tip:
Keep an eye on how the price interacts with these levels. If a support doesn’t hold, it’s not just a miss—it’s a new ceiling traders will have to deal with. Always be prepared to pivot and adapt.
Trading isn’t about guessing—it’s about reacting. These levels are your roadmap to staying ahead of the pack.
Concept of Rays: Trading Strategies Based on Fibonacci Rays
The "Rays from the Beginning of Movement" concept provides a structured yet flexible system for analyzing and trading market movements. It combines Fibonacci principles with dynamic price behavior and technical analysis, creating a unique tool for identifying opportunities. Let’s dive into how to use this method effectively.
Core Idea
Fibonacci Rays form dynamic boundaries that guide price movements, signaling potential reversals or continuations. These rays interact with key levels and Moving Averages (MA50, MA100, MA200) to highlight zones where significant price action occurs.
The principle is simple: trade after price interaction with a ray and the appearance of a clear directional movement. This ensures higher confidence and allows riding the trend between rays.
Optimistic Scenario: Targets for Bulls
If the price interacts with ascending rays and shows strength, we target the next resistance levels.
First Target: $7.055 – A move above MA50 aligns with this zone, signaling continuation to $7.452.
Second Target: $7.968 – As price confirms momentum, this level becomes the next checkpoint.
Third Target: $10.057 – A breakout here could unlock higher levels, supported by interaction with MA200.
Pessimistic Scenario: Targets for Bears
Should price react to descending rays or fail to hold support levels, bearish setups become actionable.
First Target: $5.539 – Breakdown through MA50 and interaction with descending rays suggests further downside.
Second Target: $4.800 – A continuation of bearish momentum will likely test this zone.
Third Target: $4.262 – Retesting the absolute low completes this scenario.
Dynamic Price Interaction and Moving Averages
When price interacts with key Moving Averages, it strengthens the ray’s significance. For example:
Price holding above MA50 and interacting with an ascending ray indicates bullish continuation to the next ray.
Rejection at MA200, coupled with descending ray interaction, confirms bearish potential.
Suggested Trade Setups
Long Trade: Enter after price bounces off an ascending ray and moves above $7.055. First target: $7.452, then $7.968.
Short Trade: Enter after rejection at $6.800 (near MA100), targeting $5.539. Keep stops above MA100 to manage risk.
Swing Trade: If price consolidates near MA200 and interacts with rays, look for breakout or breakdown to capture the move toward the next ray level.
Scalping Trade: Use minor ray interactions for quick entries and exits, targeting the immediate next ray for profits.
Final Thoughts
The interplay of Fibonacci Rays, key levels, and Moving Averages provides a structured yet adaptive trading framework. By aligning trades with these dynamics, traders can capture movements with high confidence, knowing each step is guided by natural market principles.
Let’s Keep the Conversation Going!
Got questions about the analysis or want to dive deeper into the strategy? Drop your thoughts in the comments—I’m here to discuss, clarify, and explore new ideas with you.
If you found this post helpful, don’t forget to hit Boost and save it for later. This way, you can revisit it as the price action unfolds and see how it aligns with my ray-based levels. Trust me, understanding these key interaction points is a game-changer for your trading.
For those curious about the ray system: my indicator automatically maps out all the levels and rays, simplifying your analysis. It’s a private tool, but if you’re interested, send me a message—I’ll explain how you can access it.
Want a custom analysis for your favorite asset? Let’s make it happen! I’m open to creating free public insights or discussing private, tailored breakdowns for your strategy. My ray system works across all assets, and I can provide precise setups just for you.
If there’s an asset you’d like me to chart, simply comment below and hit Boost to show your interest. I’ll do my best to prioritize it.
Finally, don’t miss out—follow me here on TradingView for more insights, strategies, and unique ideas. Your feedback, questions, and engagement fuel this community, and I can’t wait to connect with all of you. Happy trading!
