Nifty 50 Key Levels for 21/01/2025**Explanation:**
This trading system helps you avoid blind trades by providing confirmation for better entries and exits.
**Entry/Exit Points:**
- **Entry/Exit Lines:** Use the BLACK line for long trades and the RED line for short trades, based on confirmation from your trading plan.
- **Stop Loss:** For long trades, set the stop loss at the RED line below. For short trades, set it at the BLACK line above.
- **Take Profit:** For long trades, target the next RED line above. For short trades, target the next BLACK line below.
**Timeframe:**
Use a 5 timeframe for trading.
**Risk Disclaimer:**
This setup is for educational purposes. I'm not responsible for your gains or losses. Check the chart for more details.
Gann

BANKNIFTY KEY LEVELS FOR 21/01/2025**Explanation:**
This trading system helps you avoid blind trades by providing confirmation for better entries and exits.
**Entry/Exit Points:**
- **Entry/Exit Lines:** Use the BLACK line for long trades and the RED line for short trades, based on confirmation from your trading plan.
- **Stop Loss:** For long trades, set the stop loss at the RED line below. For short trades, set it at the BLACK line above.
- **Take Profit:** For long trades, target the next RED line above. For short trades, target the next BLACK line below.
**Timeframe:**
Use a 5 timeframe for trading.
**Risk Disclaimer:**
This setup is for educational purposes. I'm not responsible for your gains or losses. Check the chart for more details.

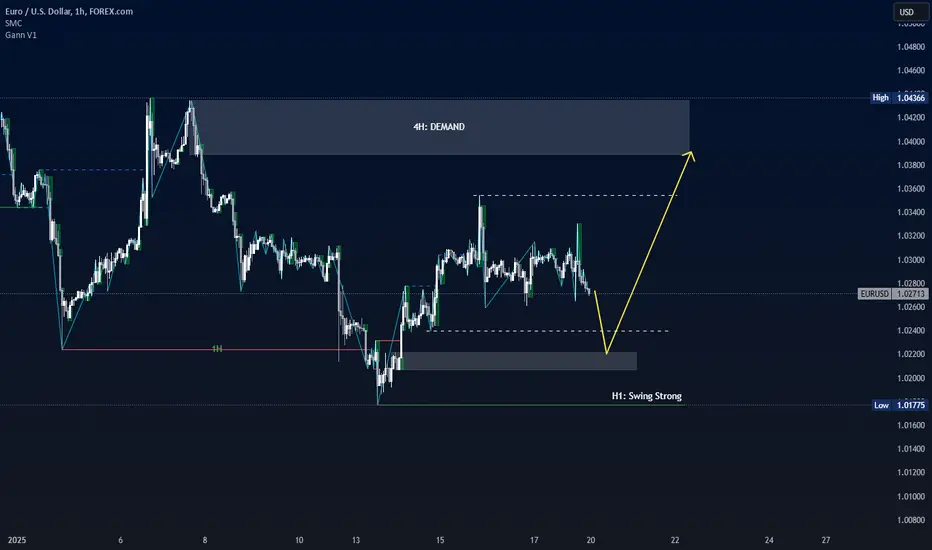
EURSD wave structure analysis on 1H timeframeH4 swing is bearish.
H1 swing is bearish => Currently is pullback.
We can look for buying opportunities in the demand zone of the 1H timeframe.
Silver scalling opportunity Last month, I shared a setup on TradingView, suggesting a long position on silver. Today, I’m presenting another scaling opportunity as our trade is progressing well. Both the fundamentals and technicals support us, and I’ll be going long from the identified demand zone

Inauguration Day! Beware of cowboy swings. Trade responsibly Inauguration Day brings a mix of excitement and uncertainty to the markets, so if you're trading today, be extra cautious. Expect some wild price swings—those "cowboy swings"—as investors react to the political shifts and news. It's easy to get swept up in the action, but remember, it's always best to keep your cool.
While the day might bring opportunities, it also has its risks. Make sure you're staying level-headed, sticking to your strategy, and trading responsibly. And, as always, if things feel too chaotic, there's no shame in sitting this one out. Safe trading!

Gold Scalping Opportunity: Potential Short SetupGold shows potential for a short-term Downward move, presenting a scalping opportunity. Confirmation is essential as the price approaches the identified zone.
Disclaimer: This analysis is for informational purposes only and does not constitute financial advice. Scalping and trading carry substantial risks, including the possibility of significant losses. Trade cautiously and responsibly.

#BOMEThere are new changes in the market and you need to adapt to them.
Despite the meme coins of famous and well-known personalities, no one is willing to invest in other meme coins, and meme coins that do not have a strong community are doomed to disappear.
People who are looking for meme coins are not looking for useful and purposeful tokens, so their priority is meme coins that are for famous people, and soon all meme coins for famous personalities will flow to the market. This is the beginning, so no one else is willing to invest in meme coins like this or same like this.
#BOMEUSDT

EUR/JPY Analysis:Bearish Insights Using MMXMIn this analysis, I explain why I'm bearish on EUR/JPY, marking my key levels with the MMXM strategy. I've also outlined the reasons for a possible bullish perspective, but my short-term stance remains bearish. Please note, this is not financial advice—it's my personal view based on my chart analysis. If you're interested, trade responsibly and always do your own research!

Careful Up Here TrumpProbably goes higher, but on the long timeline this is destined to grind down to $20 or less
Always have a plan

Constellation DAG Token - Gann SquareDAG appears to be breaking out. Current resistances are the Ichimoku Cloud, 5x0 and 5x1 Gann arcs, 4th Gann level, and the 200 week SMA. This is not even in the top 300 market caps, so an explosive move could be in order.
The price increase from the low to the first impulse high was 0.0214, so I used 214 days duration to size the Gann square. Note that the 1x8 is very close to the first impulse high and the first pivot high. The 4 and 5 arcs are acting as support and resistance during consolidation. Based on the accumulation cylinder breakout and retest in a bull flag, I suspect this is heading way higher. I also suspect that the 1x1 or top level will be retested before 4/16/2025.

EURGBP Sell Setup #Currently Trading At 0.84404 , Sell Rise Till 0.84750 For The target 0.83605---0.82703
Strong HURDLE AHEAD

ETH Long to $6666Entry: $3,215.36
Target: $6666
Stop Loss: $2899
Trade Plan:
This trade is based on a liquidity grab.
The stop loss is set below the previous low.
Reasoning:
The price has shown a pattern of accumulation after taking liquidity with the possibility of further bullish movement as it nears the next resistance level. Watch for price action confirmation around the entry level before committing to the trade.

GOLD LONG Gold Analysis: Bullish Bias with Key Levels Identified
Our analysis indicates a bullish bias for gold, with the market currently forming a higher-high, higher-low structure. Key observations and setups are as follows:
1. Order Block and Confluence:
• A significant order block is identified at the 2687 region, aligning with the 38.2% Fibonacci retracement level and the trendline of the ascending channel.
• We anticipate prices to dip to the bottom of the channel, sweep below the liquidity zone, and then rebound towards the upper boundary of the channel as volatility increases.
2. Downside Scenario:
• If the channel breaks to the downside, a retest is likely to occur. Upon confirmation of the retest, the next liquidity level is estimated around 2671, which aligns with the broader channel structure.
• Additionally, the 2658 region serves as horizontal support and aligns with a potential stop-loss placement in this scenario. This level represents a critical point for assessing further bearish momentum.
3. Upside Opportunity and Symmetry:
• On the long side, the setup aligns with a symmetrical triangle pattern, indicating the possibility of a retest before resuming the upward trajectory.
• With this setup, our take-profit target is significantly higher, yielding an attractive risk-to-reward ratio of 3.53:1.

Vibrations of #TrumpUSDTIn this chart you can find the vibration of #trumpusdt coin and the target price is 107$ then 212$....

I would like to tell friends that the dollar will fly in the skyI would like to tell friends that the dollar will fly in the sky in the penultimate wave.

BITCION GOING TO GIVE MOVEhello everyone !
its my own analysis
in this i use backward supply and Demand and take levels
Estimate Move Can Capture

ENA/USDT
MIL:ENA is showing bullish potential as it bounces from a strong Fibonacci 0.618 retracement zone within an ascending channel 🧐. This structure sets the stage for a significant rally 🚀.
Targets:
🎯 Mid-Term Target 1: $1.6373
🎯 Mid-Term Target 2: $2.1521
🎯 Long-Term Target: $2.6178
I remain bullish on MIL:ENA as it forms a higher low and prepares for the next move upward.

NAUKRI KEY LEVEL FOR 20/01/2025**Explanation:**
This trading system helps you avoid blind trades by providing confirmation for better entries and exits.
**Entry/Exit Points:**
- **Entry/Exit Lines:** Use the BLACK line for long trades and the RED line for short trades, based on confirmation from your trading plan.
- **Stop Loss:** For long trades, set the stop loss at the RED line below. For short trades, set it at the BLACK line above.
- **Take Profit:** For long trades, target the next RED line above. For short trades, target the next BLACK line below.
**Timeframe:**
Use a 5 timeframe for trading.
**Risk Disclaimer:**
This setup is for educational purposes. I'm not responsible for your gains or losses. Check the chart for more details.

RELIANCE KEY LEVELS FOR 20/01/2025//@description
// All credit goes to Tony for the concept of this indicator. His Trading View link: www.tradingview.com
// Note: The calculation method in this indicator differs from Tony's, but the concept is derived from his work.
**Explanation:**
This trading system helps you avoid blind trades by providing confirmation for better entries and exits. It considers volume, past prices, price range and indiavix.
**Entry/Exit Points:**
- **Entry/Exit Lines:** Use the BLACK line for long trades and the RED line for short trades, based on confirmation from your trading plan.
- **Stop Loss:** For long trades, set the stop loss at the RED line below. For short trades, set it at the BLACK line above.
- **Take Profit:** For long trades, target the next RED line above. For short trades, target the next BLACK line below.
**Timeframe:**
Use a 5 timeframe for trading.
**Risk Disclaimer:**
This setup is for educational purposes. I'm not responsible for your gains or losses. Check the chart for more details.

NIFTY 50 KEY LEVELS FOR 20/01/2024//@description
// All credit goes to Tony for the concept of this indicator. His Trading View link: www.tradingview.com
// Note: The calculation method in this indicator differs from Tony's, but the concept is derived from his work.
**Explanation:**
This trading system helps you avoid blind trades by providing confirmation for better entries and exits. It considers volume, past prices, price range and indiavix.
**Entry/Exit Points:**
- **Entry/Exit Lines:** Use the BLACK line for long trades and the RED line for short trades, based on confirmation from your trading plan.
- **Stop Loss:** For long trades, set the stop loss at the RED line below. For short trades, set it at the BLACK line above.
- **Take Profit:** For long trades, target the next RED line above. For short trades, target the next BLACK line below.
**Timeframe:**
Use a 5 timeframe for trading.
**Risk Disclaimer:**
This setup is for educational purposes. I'm not responsible for your gains or losses. Check the chart for more details.

2025.e3e471c972cd4e98bfaf43dab57eb4c7c5eea1641a89e53f{"ClientId":"FZ06764","TransactionType":"B","OrderType":"MKT","ProductType":"I","Price":"0","Exchange":"{{exchange}}","Symbol":"{{ticker}}","Code":"6ad13ef5d6f545ebba1e69b6c6a6d3a6","Quantity":"0"}

btcusdtAnalysis of Bitcoin against the dollar..The aforementioned scenario will be achieved provided that the last historical peak that was formed is not broken

Is AIDOGEUSDT Ready to Bark Back? Key SignalsAIDOGEUSDT is sitting at a critical juncture with the current price at $0.002035, reflecting a steep decline of 78.08% from its all-time high of $0.009286, set just under a year ago. After bouncing 25.07% off its absolute low, the asset finds itself on a knife’s edge—oversold according to the RSI14 at 19.2. This could indicate a brewing shift in momentum.
Recent patterns in sell volumes and VSA buy signals are fighting for dominance, with key resistance levels like $0.002174 looming ahead. Coupled with macroeconomic uncertainty and rising speculative interest, the question remains: is this a trap or the start of a reversal?
For traders and investors, the urgency is palpable. With long-term averages slumping below key supports, and a convergence of powerful resistance near $0.0024, today’s setup demands attention. Will AIDOGEUSDT claw its way back, or is the worst yet to come?
Stay tuned—this could be your defining moment in this unpredictable crypto saga.
Roadmap: Tracing the Momentum of AIDOGEUSDT through Recent Patterns
Dive deep into the pulse of AIDOGEUSDT as we dissect the most recent series of patterns using a roadmap that tracks not just their presence but their actual impact on price action. Here's how the action played out:
1. VSA Buy Pattern Extra 1st (2025-01-19 09:00 UTC)
Direction: Buy
Analysis: The "VSA Buy Pattern Extra 1st" signaled potential upward momentum after the close at $0.002174. Despite this signal, the next pattern saw a "Sell Volumes" direction take control, showing no upward breakout from the previous trigger. This invalidated the buy setup, making it a "watch-and-wait" moment for traders.
2. Increased Sell Volumes (2025-01-19 11:00 UTC)
Direction: Sell
Analysis: Here comes the game-changer. With a close at $0.002035, the sell direction hit hard, accurately reflecting the downward momentum predicted by the pattern. The next movement confirmed the strength of the selling wave, solidifying this as a reliable bearish signal.
3. VSA Buy Pattern Extra 1st (2025-01-19 08:00 UTC)
Direction: Buy
Analysis: The earlier "Buy Pattern" appeared again, but the rally was short-lived as subsequent sell volumes dampened enthusiasm. This reiteration failed to confirm a buy breakthrough, showcasing the dominance of bearish pressure.
4. VSA Sell Pattern 3rd (2025-01-18 15:00 UTC)
Direction: Sell
Analysis: True to its nature, this sell pattern accurately set up a bearish swing, with the next candles reflecting a consistent downward drift. A textbook example of pattern precision that delivered what it promised.
5. Increased Buy Volumes (2025-01-18 00:00 UTC)
Direction: Buy
Analysis: Bulls finally showed some teeth here, pushing the price from $0.002649 to $0.002776. This pattern proved spot-on, as it marked the beginning of a brief recovery before sellers regained control.
6. VSA Manipulation Sell Pattern 3rd (2025-01-17 17:00 UTC)
Direction: Sell
Analysis: Bears ruled the show again, with the price tracking downward in line with the signal. The movement reinforced the bearish bias and gave traders a clear shorting opportunity.
7. Buy Volumes Max (2025-01-17 02:00 UTC)
Direction: Buy
Analysis: This buy signal didn’t disappoint, as the price pushed upward momentarily. While it didn’t lead to a long-term trend change, it offered short-term traders a golden scalp opportunity.
8. VSA Buy Pattern 3 (2025-01-14 21:00 UTC)
Direction: Buy
Analysis: The buy pattern highlighted an early rally, but its short lifespan reflected the broader market weakness. The directional signal worked in the moment, although macro bears soon overwhelmed the momentum.
Conclusion
Patterns don't just tell a story—they set the stage for actionable insights. For AIDOGEUSDT, the roadmap reveals a fascinating interplay of bullish and bearish pressures, with sell patterns delivering some of the most reliable setups. Keep this roadmap in mind as we watch the next moves, and remember: in the crypto game, patterns are your allies, but confirmation is king.
Technical & Price Action Analysis: Key Support and Resistance Levels
Here's the breakdown of the most critical levels for AIDOGEUSDT that every trader should have on their radar. These zones will act as battlefields between bulls and bears. If they fail to hold, expect these same levels to flip and become stubborn resistance on the way back up.
Support Levels:
These are the lifelines for the bulls. Watch for bounces here:
0.002174 – The immediate support zone that needs to hold to maintain any bullish vibe.
0.002392 – A deeper dip could see buyers stepping in here to defend.
0.002806 – A solid mid-range level that can act as a springboard for recovery.
Resistance Levels:
These levels are where the bulls will face heavy resistance if the price moves upward:
0.003052 – A critical line in the sand. A break and hold above this could ignite bullish momentum.
0.003158 – The upper limit where sellers might hit back hard.
Powerful Support Levels:
Stronger zones that bulls must guard fiercely:
0.004612 – A major inflection point. If price reaches this, it’s a do-or-die level.
0.005384 – Bulls would need to regroup here if the sell-off gets intense.
0.00743 – A key long-term zone that may decide the trend direction.
Powerful Resistance Levels:
Big money might step in here to cap upward moves:
0.001873 – Immediate resistance that’s been a thorn for bulls.
The Takeaway
Respect these levels like they’re your trading roadmap. If a support fails, it’s not the end of the story—it’s the beginning of a new resistance. Keep your eyes sharp, manage your stops tight, and let the price action guide your decisions.
Trading Strategies with Rays: A Systematic Approach to Market Movements
Concept of Rays
The "Rays from the Beginning of Movement" methodology leverages Fibonacci-based dynamic levels that align with natural proportions. Unlike traditional analysis focused on static extremum points, these rays adapt to new patterns and highlight interaction zones where price either reverses or continues its trend. By incorporating moving averages (MAs) as dynamic factors, this system offers a robust approach to identifying trade setups.
How It Works
Fibonacci Rays: Define key movement boundaries based on the initial movement pattern.
Dynamic Interaction: Price reactions at ray intersections with MAs confirm trade opportunities.
Action Zones: Use VSA rays and MAs for confirmation before entering positions.
Scenarios: Price moves from one ray to the next, creating clear targets for trades.
Two Scenarios: Optimistic and Pessimistic
Optimistic Scenario: Price interacts with ascending rays and finds support at dynamic MA levels, signaling a bullish continuation.
Entry Zone: $0.002174 (immediate support and ray interaction).
Target 1: $0.002392 (first ascending ray).
Target 2: $0.002806 (next ray with strong resistance potential).
Moving Averages: A price break above MA50 and MA100 strengthens bullish confidence.
Pessimistic Scenario: Price fails to hold critical support and interacts with descending rays, leading to bearish continuation.
Entry Zone: $0.002035 (near powerful resistance, now acting as support).
Target 1: $0.001873 (next descending ray).
Target 2: $0.001627 (powerful historical support ray).
Moving Averages: A breakdown below MA233 confirms further downside pressure.
Suggested Trade Setups
Buy Setup (Bullish Scenario): Enter long at $0.002174 if the price interacts positively with ascending rays and MA50. Exit partially at $0.002392 and hold for $0.002806.
Sell Setup (Bearish Scenario): Short at $0.002035 if the price breaks below descending rays and MA233. Partial profits at $0.001873, and hold for a possible test of $0.001627.
Scalp Strategy: Use ray-to-ray movements for quick trades, focusing on dynamic resistance and support zones, such as $0.002174 to $0.002392.
Swing Trade: Aim for extended movements, aligning with ray trajectories and MA trends, such as $0.002035 to $0.001627 in a bearish scenario.
Key Notes
Every trade begins with interaction at the rays and requires confirmation from volume analysis (VSA) or price patterns. Whether bullish or bearish, the journey from one ray to the next provides traders with clear, actionable targets while minimizing guesswork.
Trading is all about precision, understanding, and growth—and I’m here to help you navigate the market with confidence. If you’ve got questions about this analysis or want to share your thoughts, drop them in the comments below. Let’s discuss, learn, and grow as a community.
If you found this roadmap useful, don’t forget to hit that Boost button and save the idea to revisit later. Track how the price reacts to the levels and rays I’ve outlined—because mastering those key points is the foundation of successful trading.
My custom indicator draws all the rays and levels automatically, making analysis faster and more accurate. It’s currently available privately, so if you’re interested in trying it out, feel free to send me a private message for details.
Need analysis on another asset? Let me know in the comments! I can create setups for any instrument, and while some will be free for public access, I’m open to creating personalized setups for private use as well. My rays work on any asset, so whether it’s crypto, forex, stocks, or commodities, I’ve got you covered.
If you enjoy this kind of content, make sure to follow me here on TradingView. It’s where I share all my ideas and strategies to help traders like you make informed decisions.
Let’s build something amazing together—one trade at a time. 🚀
