Gann

Avax long big movement commingAvax same case with ETH my indicators that I developed based on Gann's theory. The time indicator predicts that tomorrow, February 1, the price will have a big movement. In my opinion, from here we could climb seeking liquidity

ETH long or shortI share this analysis where I used my indicators that I developed based on Gann's theory. The time indicator predicts that tomorrow, February 1, the price will have a big movement. In my opinion, from here we could climb towards the 3500 area and later higher.
what do u think? long or short?

AUDUSDBearish market but we get a break of 4H to switch bullish on the 4H. I will be looking to buy to the 50% of the daily internal range if we are going to continue bearish. Waiting for the break and retest to buy, if no break then we keep selling

Fill your bags with $OMGot a strong feeling that NASDAQ:OM will hit multiple ATHs this coming days.
Double digits loading..


WIPRO- for investment WIPRO- for investment potential 2X stock in an year.
IT stocks will show some good moment in coming year, this could be one of them !!
Buy zone Buy Zone 390 to 440
Investment Targets :- 855, 976 ,1105 may be 1242
Please do your due diligence before trading or investment.
Disclaimer -
I am not a SEBI registered analyst or advisor. I does not represent or endorse the accuracy or reliability of any information, conversation, or content. Stock trading is inherently risky and the users agree to assume complete and full responsibility for the outcomes of all trading decisions that they make, including but not limited to loss of capital. None of these communications should be construed as an offer to buy or sell securities, nor advice to do so. The users understands and acknowledges that there is a very high risk involved in trading securities. By using this information, the user agrees that use of this information is entirely at their own risk.
Thank you.

FLUXUSD wave structure analysis on daily time frameDay swing is bullish => currently is pullback.
Internal structure of daily time frame gives bullish reversal signal.
We can look for investment opportunities in this same bridge

ATOM may pump 65 % - short-termhi traders,
ATOMUSDT chart looks interesting .
Bullish divergences on the daily time frame.
The price is still in the low-risk area.
If the bullish momentum continues, we expect even 65 % pump within the next few weeks.
Stop loss can be placed below 5,50$
Good luck

UKOIL may come down still📊 Analyzing **UKOIL (Brent Crude Oil)** across multiple timeframes:
**22-day time frame**, **Weekly time frame**, **Daily time frame**, and **4-hour time frame**.
📉 UKOIL has risen to $75, but a pullback is expected, presenting a better entry opportunity around $72.
This zone aligns with key support, making it an ideal level to consider a position.
🔒 Stop Loss can be placed below the support zone for risk management.
🔍 We are using trend analysis and support/resistance levels to identify this setup.
Brent Crude Oil price action suggests a retracement before resuming momentum.
**Bullish View:** Entering near $72 could provide a better risk-reward ratio.
**Bearish View:** A break below $72 could lead to further downside pressure.
🌟 A strong formation is developing! Watch for confirmation before entering. 📉🔥
⚠️ **Note:** If UKOIL fails to hold $72, we may see further declines. Wait for a proper setup! ⚠️
🔔 **Be sure to follow the updated ideas for real-time insights!** 🔔
⏰ **Analysis Time:** Brent Crude Oil (UKOIL) across multiple timeframes.
⚖️ **Do not forget to set a Stop Loss** for risk management! Protect your capital! 🔒
💡 **Follow your trading plan; this is just my analysis. I’d love to see your thoughts in the comments!**
✅ **Don't forget to hit the 'Like' button** ✅ 🙏😊 & share it with your friends; thanks, and happy trading! 📉🔥

(Lunar New Year Special) january 24 Bitcoin Bybit chart analysisHello
It's a Bitcoinguide.
If you have a "follower"
You can receive comment notifications on real-time travel routes and major sections.
If my analysis is helpful,
Please would like one booster button at the bottom.
Bitcoin 4-hour chart
This is the main drawing section.
It seems to have taken about 2 and a half hours just to draw it.
The section where the flag is marked is the section where the daily chart is created,
and the last flag is January 31st, when the holiday ends.
This week, there has been absurd and bizarre repetition of
unasked rises and unasked falls.
The reason is that after the report was updated,
as I explained in detail in the last video,
it is right before the bitcoin price skyrockets.
Based on the Bollinger Band weekly chart, it is important to see whether the resistance line is touched first
(a major rise)
and whether the MACD dead cross on the weekly chart
will occur first,
and adjustments and sideways movements will occur.
Based on that, if you look at the high and low points on the right,
I have indicated the prices.
At the very top, 117,182 dollars touches the weekly chart resistance line,
moving towards a mid-term upward trend
If 99,703 dollars at the bottom is broken first,
it will be the place where the weekly candle low is broken.
It would be bad if the two light-colored sky-blue support lines I drew were broken.
Because it is the place where the sideways movement and support line are broken,
I calculated the main section, so
I think it would be good to refer to it.
This is a 30-minute chart of Tether Dominance moving in the opposite direction of the beat.
Today, in terms of the pattern,
it touched the 5-minute and 15-minute resistance lines,
and the 30-minute chart resistance line section order.
I carried out a short position strategy in the sky blue finger section/strong downward section.
In the case of Tether Dominance,
the 6-hour chart and 12-hour chart MACD dead cross are currently in progress.
I applied it to Bitcoin as is.
Here is the Bitcoin 30-minute chart.
There is a Nasdaq indicator announcement at 12 o'clock tonight.
The Nasdaq is in the process of a 6-hour MACD dead cross,
and I judged that this section is not very dangerous.
The short-term pattern is still alive,
and the MACD golden cross is imprinted on the weekly chart,
and even if there is a strong adjustment in Nasdaq,
since the 1+4 rising pattern is waiting,
I focused on the rise and proceeded with the strategy.
*One-way long position strategy when the red finger moves
1. $104,740 long position entry section / stop loss price when the green support line is broken
2. $109,231.5 long position 1st target -> target price in order from the top
Based on the Tether dominance movement and the Bitcoin pattern,
I focused on the rebound from the 30+1 pattern.
Up to the first section, it is a sideways movement, and from the top section, it is a new record, and if it reaches this point, it will continue to rise significantly.
In preparation for a strong adjustment in Nasdaq,
I maintained the stop loss price for the 30-minute support + 1-hour support of the second section, which is marked as the final long position waiting section.
If it touches the bottom section today,
It is not good because the daily chart low is broken.
If it falls to 101.4K at the very bottom,
Pay attention to the 6+12 pattern that was not recovered yesterday.
Basically, if it comes down to this section,
It is not good because the center line of the 12-hour Bollinger Band chart has been touched several times,
and the support line of the 6-hour chart is also open.
Please refer to the final support line explained at the mid-term point at the top.
Today, I explained it in detail for the first time in a while,
and I did my best to analyze a week's worth,
I hope it was helpful for your actual trading.
Up to this point, I ask that you simply use my analysis for reference and use only
and I hope that you operate safely with principle trading and stop loss prices.
Since it's a long holiday,
don't just look at the charts,
and I hope all my followers have a good time with their families next week on Lunar New Year.
Happy New Year.
Thank you always.

USOIL buys Price has reached the discount level of this recent swing and tapped into a weekly FVG, and an OB inside the FVG giving desired reactions.
Looking to go long on this, already on the first position.
Trade safe🥂

XAUUSD #009 ( Be Careful, collecting liquidity Alert !!! ) Hello dear traders.
First of all thanks for your support and comments.
———————————————————————————
As I mentioned in last analysis Gold is trapped bellow 0.618 Gann square price zone and expecting to correct itself for next bull within 1-2 years .
With break last ATH market is collecting liquidity and then crash down .
With first reversal price zone we will plot Gann square and updated the targets .
Good luck and safe trades.

EUR/USD Analysis – January 30, 2025📉 EUR/USD Analysis – January 30, 2025
🔹 Expectation: Euro to decline against the US dollar
🔹 Entry Level: Break of 1.0384
🔹 Stop Loss: 1.0424
🔹 Target 1: 1.03094
🔹 Target 2: 1.02555
🔍 Reasons for Entering the Trade:
1️⃣ Technical Analysis: The price is approaching a key support level at 1.0384, and a break below could trigger further downside.
2️⃣ Monetary Policies: The ECB has cut interest rates to 2.75% to support the economy, weakening the euro.
3️⃣ Policy Divergence: The Federal Reserve maintains a tighter monetary stance compared to the ECB, strengthening the US dollar.
4️⃣ Trade Tensions: Potential new US tariffs on European imports could put additional pressure on the euro.
5️⃣ Weak Eurozone Economy: Recent PMI data indicates economic slowdown, reinforcing the bearish outlook.
⚠️ Disclaimer: This analysis is for educational purposes only and is not financial advice. Please manage risk wisely.

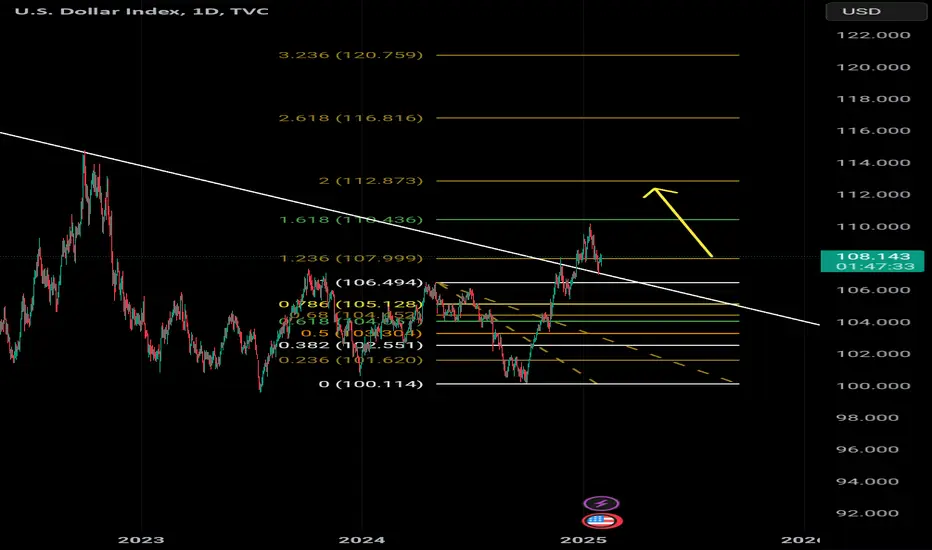
It is an idea, what about flying in the sky, the dollar, does thIt is an idea, what about flying in the sky, the dollar, does th
forecast S & P 500 / The peak will be soonMethods of building and temporary cycles, a forecast for SPY is built
The probability of correction is more than 75%

DOGE! time for new ATHHallo traders !!
After a long time of waiting, a new chance for profits arises :) according to the plan, we are a month ahead of growth. I wish you perseverance! and certainly, as in previous years, the portfolios are getting thicker!
I invite you to follow :) as you know, I only appear when something is happening.

COMPcompound
a legendary project which to me it is totally undervalued
when you will see this graphics with dates and lines, what would you say in the comments.
i want you to give me your opinions.
lets go

MANTRA’s Silent Takeover: Institutions Are HereInteresting what's happening with MANTRA lately.
Been tracking their partnerships and something's definitely brewing:
🔘Google Cloud quietly joined as infrastructure partner + validator
🔘Binance backing with juicy APRs
🔘ZAND (UAE's first digital bank) on board
🔘MAG signed $500M tokenization deal
🔘DAMAC locked SEED_TVCODER77_ETHBTCDATA:1B deal (same group working on FWB:20B Trump data centers)
Institutions are here. NASDAQ:OM is their blockchain. Yet most still sleeping on it 👀
#Binance #Google #MANTRA #DAMAC #TRUMP #Bullish

How $OM is Bringing Trillions On-ChainI just came across the $200B+ aviation market entering blockchain via NASDAQ:OM 's Novus Aviation partnership, and I'm honestly amazed.
This comes right after #MANTRA's SEED_TVCODER77_ETHBTCDATA:1B #DAMAC deal for real estate tokenization (who's working on FWB:20B Trump data centers).
While traditionalists might be skeptical, the implications are undeniable - we're seeing real-world trillion-dollar markets starting to move onchain, and this could pave the way for institutional adoption.
Regulated. Institutional. Unstoppable. $OM.
#OM #RWA #Binance #TRUMP #Whales

$OM: The Future of Institutional RWA AdoptionYou don’t hold enough NASDAQ:OM —soon, the biggest asset managers will want it.
BlackRock, Vanguard, Goldman Sachs oversee $50T+ in assets. As RWAs become a trillion-dollar market, they’ll need regulated, institutional-grade blockchain infrastructure.
That’s exactly what MANTRA delivers:
✅ First regulated L1 for RWAs
✅ FWB:16T + market opportunity
✅ Backed by major players in TradFi & Web3
And it’s already happening—#MANTRA is tokenizing SEED_TVCODER77_ETHBTCDATA:1B + in #DAMAC real estate, part of a FWB:20B #TRUMP-backed expansion into data centers.
Institutions bet on $OM. So am I.
NFA - DYOR

Is today really the day?After plenty of talk about the 2800 levels, today’s FOMC might finally push gold there.
The market seems primed for it, but this could also mark the top—silver is nearly overcooked, and the S&P 500 has been holding its ground at lower levels.
Good luck, friends! ✨🏆

XAUUSD KEY LEVELS WITH SHORT ENTRY**Explanation:**
This trading system helps you avoid blind trades by providing confirmation for better entries and exits.
**Entry/Exit Points:**
- **Entry/Exit Lines:** Use the BLACK line for long trades and the RED line for short trades, based on confirmation from your trading plan.
- **Stop Loss:** For long trades, set the stop loss at the RED line below. For short trades, set it at the BLACK line above.
- **Take Profit:** For long trades, target the next RED line above. For short trades, target the next BLACK line below.
**Timeframe:**
Use a 15 mins timeframe for trading.
**Risk Disclaimer:**
This setup is for educational purposes. I'm not responsible for your gains or losses. Check the chart for more details.
