LONG ISRG?The company has delivered solid numbers, and while their outlook for the year is somewhat cautious, analysts remain bullish. This aligns well with my trading style. I plan to enter with a tight risk setup, scaling out partially when the daily RSI reaches overbought levels, but holding the majority of the position to capture larger moves.
Gann

NZDUSD to drop for more than 100 pipsBased on my algorithms, data and statistics, NZDUSD is about to drop for more than 100 pips

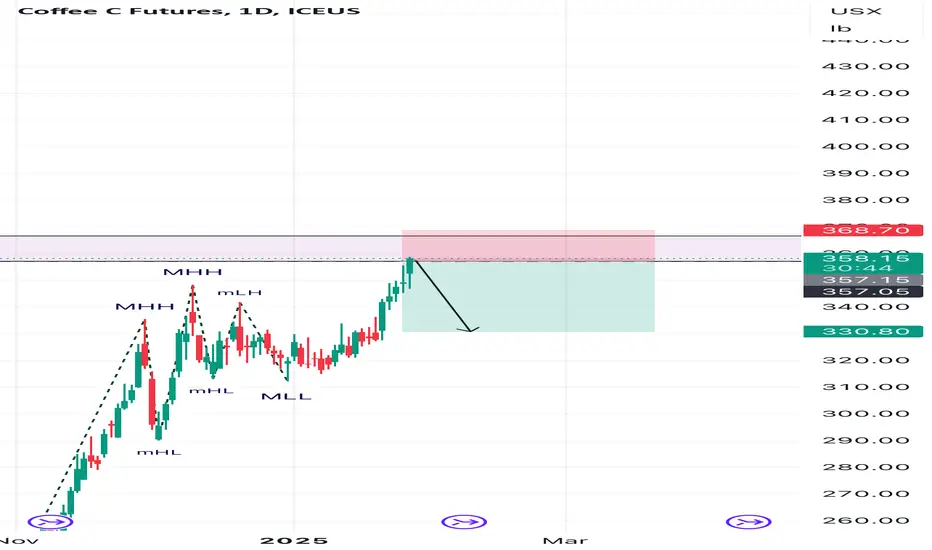
Coffee short Fundamentals showing that coffee going to go down
Will be shorting from that zone
Let’s go⬇️
Gann Trading Strategy | Harmonic Cycle & Vibration ModelGann Harmonic Cycle & Vibration Model Explained | Master Market Timing with Gann's Techniques.
In this video, we explore the Gann Harmonic Cycle-Vibration Model, a powerful trading approach inspired by W.D. Gann's timeless principles. This strategy revolves around the natural laws of market movement, where time and price operate in perfect harmony.
Key highlights:
1. End-to-End Cycles: Understand how markets repeat at consistent intervals, starting from significant highs or lows.
2. Square of 9: Learn how this mathematical tool predicts price movements and time cycles by identifying their natural connection.
3. Angles and Degrees: Discover how critical angles like 45°, 90°, and 135° reveal key support, resistance, and reversal points.
This structured system blends time-based cycles with actionable insights, enabling traders to forecast trends and pinpoint turning points effectively. Dive in to master this incredible trading strategy! Gann Astro works on all this major pairs and many more CAPITALCOM:GOLD CAPITALCOM:US100 BINANCE:BTCUSDT FX:EURUSD

EUR/GBP pair has broken a previous support zoneIt looks like the EUR/GBP pair has broken a previous support zone, turning it into a resistance zone. After this break, the price is now making a bullish correction to retest that area.
Trade Setup:
• Wait for the last low (marked by the red line) to be broken clearly by a strong bearish engulfing candle, confirming the continuation of the downtrend.
• Once this condition is met, enter a sell trade.
• The stop-loss should be placed above the new resistance zone (previous support) to avoid false breakouts.
• The target levels are based on the next key support zones, as shown in the chart.
This approach ensures a more precise entry, reducing risk and increasing the probability of a successful trade.

Dubai: $OM's Hub for RWA RevolutionMade it in crypto? Dubai is where success finds its home! 🌍🇦🇪
The last utopia for dreamers, innovators, and believers in the future. And now, the hub of the NASDAQ:OM | #MANTRA revolution—tokenizing RWAs, bridging TradFi and DeFi, and reshaping wealth in UAE and beyond.
$8–$10 soon? Fundamentals point to YES.
#Dubai #Blockchain #Crypto #RWA #Tokenization

EU buys loading Expecting price to balance the last swing that previously balanced and followed through with imbalances to the upside..
The equilibrium level will be a good place to start from.
Goodluck if you share this idea as well.🥂

DAMAC x $OM: The Next $SOL?DAMAC’s bold moves are rewriting the crypto playbook:
FWB:20B data centers w/ Trump ✅
SEED_TVCODER77_ETHBTCDATA:1B RWA tokenization w/ MANTRA Chain ✅
Real estate, hospitality, data centers—everything’s going onchain.
NASDAQ:OM under $5 today. $10+ soon? Feels like early CRYPTOCAP:SOL adoption.
#CryptoNews #MANTRA #Trump #Bullish #Binance

#BIOLook at the previous candles, every time it goes up, it drops 20 to 25 percent, and this trend has been going on for a month, and in my opinion, it is returning to the same price it started at. Because a shitcoin that does not have a proper comminution and its owners sell all their shitcoin at the highest price on the first day, they no longer care what happens to this shitcoin and are probably creating a new shitcoin with the money they have earned.

JUP USDT➡️ LSE:JUP is one of the top projects in the #DeFi & #Solana ecosystem, currently accumulating above key support and below ATH resistance 🧐
Overall, #JUP is forming a Cup & Handle pattern ☝️
Great opportunity to load up on LSE:JUP at these levels! Worst case, I’ll average my position below the key zone 🚀
🎯 Target 1: $1.8412🎯 Target 2: $2.6058

Silver: Bearish Outlook with Triple Top PatternSilver: Bearish Outlook with Triple Top Pattern
Silver is currently indicating a bearish outlook, driven by a triple top pattern.
The neckline was broken at 30.1, indicating a further price decline.
This bearish sentiment is reinforced by a strong volume zone near 30.3, increasing the likelihood of a continued downward movement.
The target levels to watch are 29.6 and 28.90.
You may find more details in the chart!
Thank you and Good Luck!
❤️PS: Please support with a like or comment if you find this analysis useful for your trading day❤️


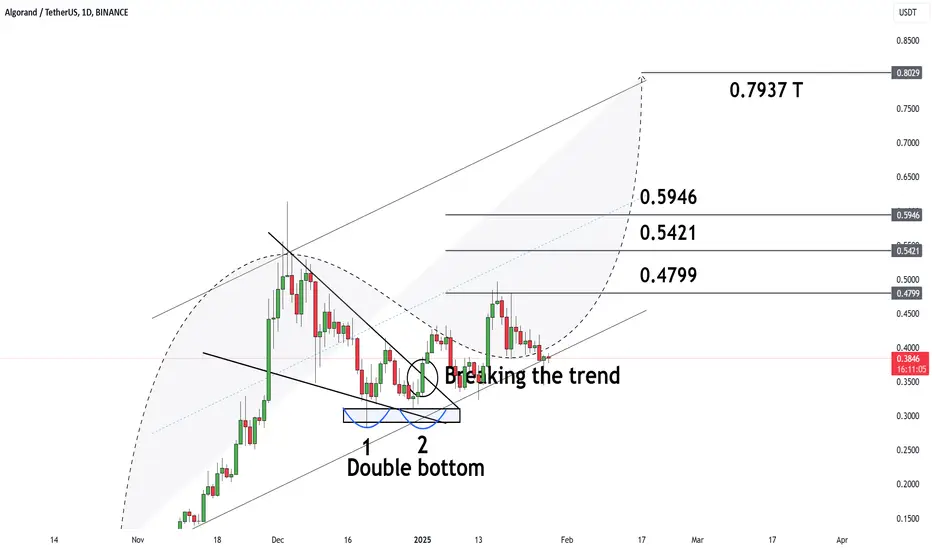
ALGO Watch for the next move
#ALGO Price is testing the 0.618 Fibonacci support, setting up for a potential bullish reversal 🐃
Accumulation in this zone could lead to a strong breakout toward key resistance levels 📈
🎯 Target 1: $0.5641
🎯 Target 2: $0.6697
🎯 Target 3: $0.7693
DOT Momentum buildin
#DOT Price is testing key long zones at $5.760 and $4.973, providing prime accumulation opportunities 🧐
A bullish reversal from these levels could push DOT toward higher targets 📈
🎯 Target 1: $8.454
🎯 Target 2: $9.621
🎯 Target 3: $10.849

BITCOIN Hello Traders 👋
What are your thoughts on BTC ?
:As we can see this BTC Market made on high 109600.
: After that, the BTC market has made a sell entry
: If BTC Market break (change of character) of 91000.
: Then BTC market down fall on next support.
Let's see guys

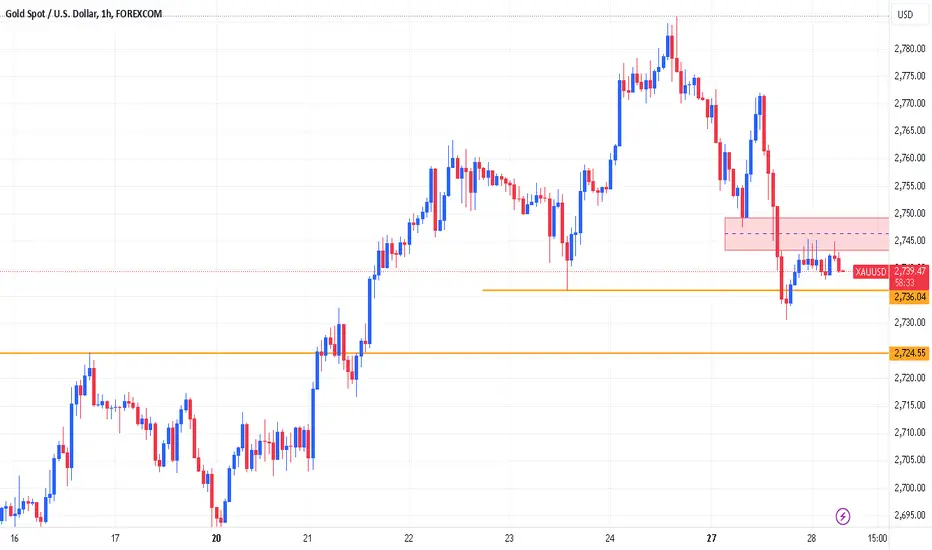
xauusd chart analysishello traders below are the chart analysis if price closed below the first support then price will go insha allah the next mentioned target 2724-26
BTC ... Bitcoin Gann box Stack linesMake sure to go through the lines slowly and enable or disable the log function in the bottom right of the scale to see how certain levels are supported or resisted even if there isn't a line anywhere near.
Not saying where it will go but use your own indicators to see if these lines make sense in terms of turning point or whatnot to refine your skills...

EURJPYWeekly is bullish and daily flipped bullish to confirm the continuation of the bullish move. I will be watching 1H to shift bullish at the external discount to buy.

Gold To Drop Again ? (Read Caption)Gold gathers bullish momentum and climbs to a fresh multi-month high above $2,780. The Fed will announce monetary policy decisions following the first meeting of 2025 next week. The near-term technical outlook suggests that Gold is about to turn overbought

Can MANTRA Chain's Innovations Propel It to $10 in 45 Days?@MANTRA_Chain has always been ahead of the curve when it comes to innovation.
🕉️ The focus on RWA tokenization and the strong backing from DAMAC gives me confidence that NASDAQ:OM can hit $10 in the next 45 days.

#GRASS The best trading range for scalping
In my opinion, this coin is worth investing in and is better than many meme coins.
I don't recommend holding because no coin is worth holding except btc, Sui and Sol.
Don't rush to buy, I think there is still room for it to fall.

DON'T MISS VELAS AT THIS DISCOUNT PRICES - STILL ACTIVE PROJECTTECHNICAL ANALYSIS AND TRADE PLAN FOR VELAS
Chart Overview
Timeframe: The analysis is conducted on a 4-hour chart, providing mid-term insights.
Pattern Identified: A falling wedge, a bullish reversal pattern, suggests an impending breakout to the upside.
Current Price: Approximately $0.0065564 at the time of analysis.
Volume Analysis: Declining volume indicates price compression, which typically precedes a breakout.
Key Levels
Support Zone (Discount Area): Around $0.0058–$0.0060.
Resistance Zone (Premium Area): First resistance at $0.0080 and a major zone at $0.0100–$0.0120.
Previous Highs (Targets): $0.0140, $0.0220.
Indicators:
RSI (Relative Strength Index): Showing oversold conditions, supporting a reversal.
Stochastic Oscillator: Near bottom levels, indicating a potential bullish crossover.
Volume Oscillator: Low activity with potential for volume surge on breakout.
Price Action:
A series of lower highs and lower lows confirms the falling wedge.
Breakout from the wedge is expected as the price nears the apex, combined with reduced bearish momentum.
Market Sentiment and Team Progress:
The Velas team, led by Alex Alexandrov, is working hard and smart to drive the project forward. Recent updates reveal positive developments and growing confidence in Velas 2.0, as highlighted on their official Twitter account.
According to Accumulated Finance, VLX has strong potential due to its innovative subchain technology and enhanced ecosystem.
Trading Plan
1. Entry Strategy:
Initial Entry (Aggressive): Enter around the current price ($0.0065) with a smaller position to catch the breakout early.
Confirmation Entry (Conservative): Wait for a confirmed breakout above $0.0070 with strong volume before entering a larger position.
2. Take-Profit Targets:
Short-Term Target: $0.0080 (Resistance Zone).
Medium-Term Target: $0.0100 (Major Resistance).
Long-Term Target: $0.0140 and $0.0220 (Key Fibonacci levels and previous swing highs).
3. Stop-Loss Placement:
Initial Stop-Loss: Below $0.0055 (below the wedge support).
Trailing Stop: Move the stop-loss to break-even after a breakout above $0.0080 and trail below each significant swing low.
4. Risk Management:
Allocate no more than 2% of total trading capital to the initial position.
Use position sizing to ensure the maximum loss (based on stop-loss placement) does not exceed predefined risk tolerance.
5. Monitoring Plan:
Volume: A breakout without increased volume may signal a false breakout. Wait for confirmation.
Momentum Indicators: RSI and stochastic should support the move; divergence against the price could invalidate the setup.
Market Conditions: Monitor Bitcoin and general market sentiment, as they can influence VLX price movements.
6. Scaling Strategy:
Add to Position: On a confirmed breakout with high volume above $0.0075, add to the position during retests of support.
Partial Profit-Taking: Secure 50% of profits at $0.0100 and let the rest ride towards higher targets with a trailing stop.
The falling wedge pattern and supporting indicators suggest a strong potential for bullish momentum in the short-to-medium term. The dedication and smart efforts of Alex Alexandrov and his team, combined with the positive momentum from Velas 2.0 and its latest announcements, align with a promising future for VLX.

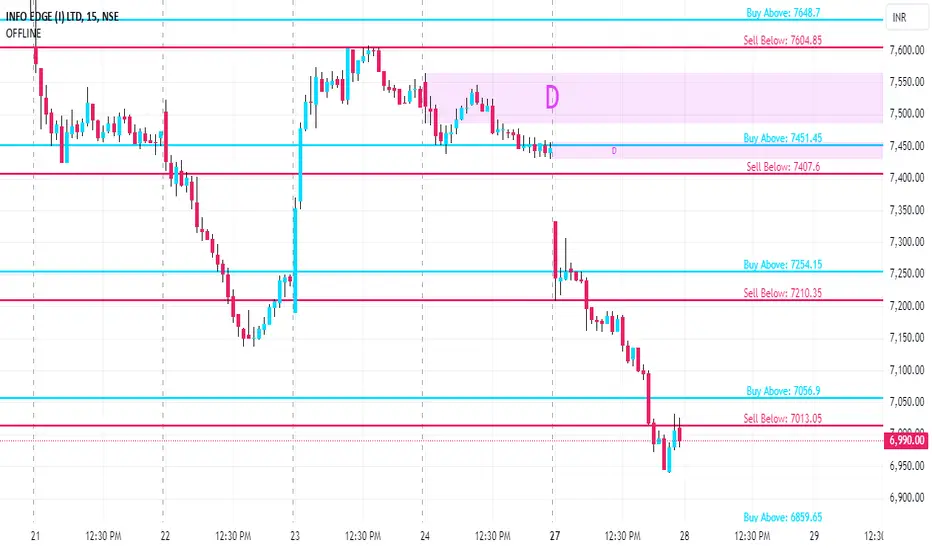
NAYKRI KEY LEVELS FOR 27/01/2025**Explanation:**
This trading system helps you avoid blind trades by providing confirmation for better entries and exits.
**Entry/Exit Points:**
- **Entry/Exit Lines:** Use the BLACK line for long trades and the RED line for short trades, based on confirmation from your trading plan.
- **Stop Loss:** For long trades, set the stop loss at the RED line below. For short trades, set it at the BLACK line above.
- **Take Profit:** For long trades, target the next RED line above. For short trades, target the next BLACK line below.
**Timeframe:**
Use a 5 timeframe for trading.
**Risk Disclaimer:**
This setup is for educational purposes. I'm not responsible for your gains or losses. Check the chart for more details.