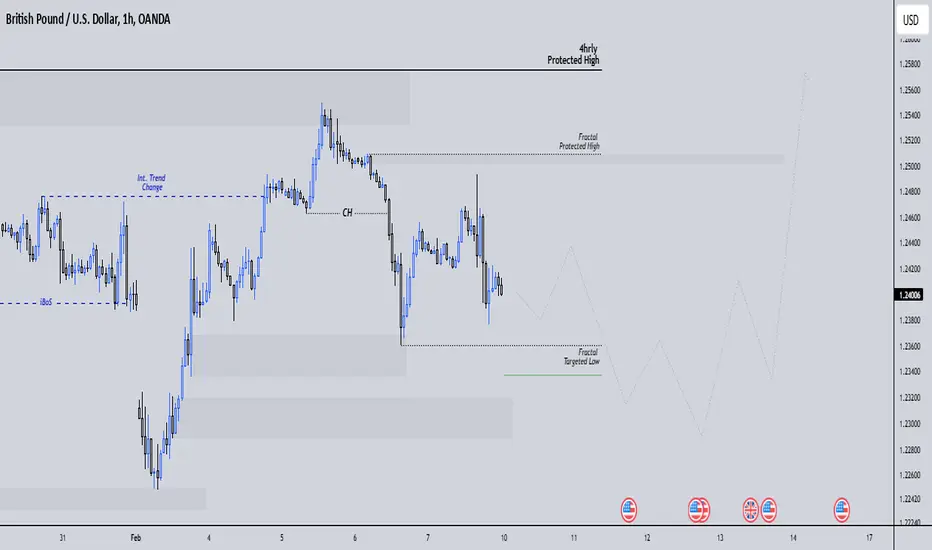
GBPUSD - Analysis and Potential Setups (Intraday- 10.02.25)Overall Trend & Context:
The OANDA:GBPUSD pair is in an overall downtrend on the higher time frames and lower time frames are in alignment.
Technical Findings:
Price broke below all EMA's - is now consolidating below.
Keep an eye on LTF supply levels between 1.24635 - 1.24530 (within 4h supply).
Bullish price action appears inherently weaker against the bears.
Potential Scenarios:
For now I will only be considering shorts.
Trade is active at 1.24150.
Gbpusdanalysis

GBPUSD Selling Opportunities Daily Swing Structure = Bullish
Daily INternal Structure = Bearish.
Narrative Based on Internal Structure.
We are Pro-trend.
But, we are coming from a strong demand zone.
From a daily perspective, GBPUsd is really not that clear.
It is possible that the demand zone could SPONSOR a move that breaks the Swing Protected High.
In short, this demand zone could be the genesis of phase C moves.
_______________________________________
4HRS
Swing structure = Bearish
Internal Structure = Bullish
We know that internal structure was bullish to facilitate the swing pullback.
We also know that internal trend changed from bullish to bearish hich signaled to us that the pullback phase was over.
The moment internal trend changed from bullish to bearish, the demand zones left behind were now reaction points.
However, Price tapped into demand zone created on Jan 21, and immediate reversed breaking internal change and causing an internal trend change from bearish to bullish.
We know that after every break of structure (iBoS, CHoCH or BoS) we should expect a pullback from the reaction points.
The moment internal trend changed from bearish to bullish, every demand zone left behind (STB Zones, Orderblocks Breakers etc etc) becomes reaction points.
That brings us to where we are.
The orderflow that we should follow is the fractal orderflow that we continue selling the currency until the fractal market structure changes from bearish to bulllish.
The moment fractal structure switches, that signals to us that the internal pullback is over.
GBPUSD DAILY CHARTSConcise but more likely its just a prediction. See it for yourself, I see an accumulation for almost 30 days, most likely it goes to test the 1.28 zone.
Or it will rip lower? what's your idea here! remember this is daily charts.
This might take a longer trades. I would rather trade this with 1:2 ratio. the stoploss would be 1.21500.
lets see the chart in the next few weeks.
are we all back here!?
This is not a financial advice, were back on posting.
see the other charts/pairs soon.
see our gold clear the previous highs!
pewpew...keep grinding on fellow traders.
still risking the trading for freedom. once you understand it, you don't panick anymore.

GBPUSD Buy 15Min chart!Hey Guys,
To keep it short, based on the analysis, a previous bearish trend line breaks and it would be possible to see an uptrend (for 15min chart) on the market.
This idea will be updated based on market movement.
Good Luck!
(Sorry about late publish, Preparing post content took sometime)😊

GbpUsdI found this Leve very interesting 🤔 couple with the fact that I have a Bias for short on GbpChf it seems appropriate.
Check my other insights on my page.
Boost if you find this insightful 🫴

DeGRAM | GBPUSD testing of the channelGBPUSD is under an ascending channel between the trend lines.
The price has reached the lower boundary of the channel and 62% retracement level.
Indicators on small timeframes indicate oversold.
We expect the growth to continue after the retest of the channel boundary is completed with a potential reaching of dynamic support.
-------------------
Share your opinion in the comments and support the idea with a like. Thanks for your support!

GBPUSD H4 | FOREX BEELooking at the GBP/USD H4 chart, I can identify the following key observations:
1. Trendline Resistance: The market is currently testing or approaching a key descending trendline, indicating potential resistance at higher levels.
2. Fibonacci Levels: The chart highlights the 0.5 Fibonacci retracement level near 1.2415, suggesting a possible bullish target zone if price breaks above the trendline resistance.
3. Support Zones: The red zones below, particularly near 1.2251 (0.236 Fibonacci), appear to act as important support levels where buying interest may reappear.
4. Market Scenario:
- If the price breaks above the trendline and sustains, it may move towards the next resistance at 1.2415 or higher.
- On the downside, a failure at the current level could push the market back to the support zones around 1.2250 or lower.
This setup suggests a cautious approach for now. A breakout confirmation above the descending trendline would provide a clearer signal for bullish continuation. Conversely, failure to break higher may lead to renewed bearish pressure.

GbpUsd- Strongly bullish on medium termAs you know from my previous TVC:DXY analyses, I anticipate a correction in the index, which should lead to a rise in major USD pairs.
Among all the USD pairs I've recently covered, FX:GBPUSD appears to be the most bullish.
Looking at the posted chart, after forming a bullish Pin Bar at its recent low in mid-January, GBP/USD began to reverse and climbed to 1.25, which was the initial target at that time.
A correction followed this first leg up. What stands out in this case is the strong bullish reversal candle that formed after Monday’s Asian open gap. Not only did it fill the gap (like in EUR/USD's case), but the pair also returned to the 1.25 resistance level.
This structure signals strong bullish momentum, and I expect GBP/USD to continue its ascent toward the next key resistance zone at 1.28.
In conclusion, my strategy remains to buy the dips.
Depending on the entry point, this setup offers a potential risk-to-reward ratio of over 1:3.

A Possible Sell for GBPUSDPlease refer to the video that I just published to better understand this idea.
But, my idea is, GBPUSD at the moment hasn't really given a clear directional bias.
We were previously following the bearish internal structure (4hrs and 1HR) but Yesterday we gapped tapping into a daily (4H and 1HR) demand zone. Then immediately shooting and causing an internal trend change as illustrated on the chart.
The reason why I support selling the GBPUSD at the moment (I actually think is the strongest outcome) is based on the simple fact that we expect a pullback after every break of structure. We have three zones to consider that may initiate the pullback as illustrated above.
As such, we keep our eyes open, but even as we sell, at the moment I wouldn't be too ambitious with the sell targets.

GBP/USD "The Cable" Forex Market Bullish Heist Plan🌟Hi! Hola! Ola! Bonjour! Hallo!🌟
Dear Money Makers & Robbers, 🤑 💰
Based on 🔥Thief Trading style technical and fundamental analysis🔥, here is our master plan to heist the GBP/USD "The Cable" Forex market. Please adhere to the strategy I've outlined in the chart, which emphasizes long entry. Our aim is the high-risk Red Zone. Risky level, overbought market, consolidation, trend reversal, trap at the level where traders and bearish robbers are stronger. 🏆💸Be wealthy and safe trade.💪🏆🎉
Entry 📈 : "The vault is wide open! Swipe the Bullish loot at any price - the heist is on!
however I advise placing Buy limit orders within a 15 or 30 minute timeframe. Entry from the most recent or closest low or high level should be in retest.
Stop Loss 🛑: Thief SL placed at 1.22500 (swing Trade) Using the 2H period, the recent / nearest low level.
SL is based on your risk of the trade, lot size and how many multiple orders you have to take.
Target 🎯: 1.6700 (or) Escape Before the Target
Scalpers, take note 👀 : only scalp on the Long side. If you have a lot of money, you can go straight away; if not, you can join swing traders and carry out the robbery plan. Use trailing SL to safeguard your money 💰.
📰🗞️Fundamental, Macro, COT, Sentimental Outlook:
GBP/USD "The Cable" Forex Market market is currently experiencing a bullish trend,., driven by several key factors.
📊 Fundamental Analysis
The British government's upcoming budget may introduce a "more flexible fiscal policy," boosting GDP by 0.5% in 2025/26, according to Pantheon Macroeconomics . This could lead to higher interest rates and support the pound.
📊 Macroeconomics
The UK's economic growth is expected to slow down, but the Bank of England may maintain higher interest rates to control inflation. This could impact the GBP/USD pair
📊 COT Report
The latest COT report shows that large speculators have increased their net long positions in the GBP/USD pair, indicating a bullish sentiment
📊 Market Sentiment
The market sentiment for GBP/USD is currently bullish, with 60% of traders expecting a rise in prices. However, some analysts warn that the pair may be overbought
📊 Institutional and Retail Banks Positioning
Institutional traders are currently net long on GBP/USD, while retail traders are net short. This divergence in positioning could lead to a potential bullish move in the pair.
📊 GBP/USD Trader Sentiment
- Bullish Traders: 62% (Institutional: 70%, Retail: 55%)
- Bearish Traders: 31% (Institutional: 20%, Retail: 40%)
- Neutral Traders: 7% (Institutional: 10%, Retail: 5%)
📊 Positioning
- Institutional Traders: Net Long (Ratio: 2.5:1)
- Retail Traders: Net Short (Ratio: 1.2:1)
- Leverage: Average leverage used by traders is 10:1
📊 Market Sentiment Indicators
- SWFX Sentiment Index: 1.23 (Bullish)
- OANDA Sentiment Tool: 61% Bullish, 39% Bearish
- FX Blue Trader Sentiment: 60% Bullish, 40% Bearish
Please note that these numbers are subject to change and might not reflect the current market situation. Always conduct thorough research and analysis before making any trading decisions.
Overall Outlook
Based on the analysis, the GBP/USD pair is expected to move in a bullish trend, with a 60% chance of an uptrend and a 40% chance of a downtrend. However, it's essential to monitor market news and events, as they can impact the pair's direction
⚠️Trading Alert : News Releases and Position Management 📰 🗞️ 🚫🚏
As a reminder, news releases can have a significant impact on market prices and volatility. To minimize potential losses and protect your running positions,
we recommend the following:
Avoid taking new trades during news releases
Use trailing stop-loss orders to protect your running positions and lock in profits
📌Please note that this is a general analysis and not personalized investment advice. It's essential to consider your own risk tolerance and market analysis before making any investment decisions.
📌Keep in mind that these factors can change rapidly, and it's essential to stay up-to-date with market developments and adjust your analysis accordingly.
💖Supporting our robbery plan will enable us to effortlessly make and steal money 💰💵 Tell your friends, Colleagues and family to follow, like, and share. Boost the strength of our robbery team. Every day in this market make money with ease by using the Thief Trading Style.🏆💪🤝❤️🎉🚀
I'll see you soon with another heist plan, so stay tuned 🫂

GBP/USD Longs from 1.22400 to fill market gapI expect GBP/USD to start the week with a bullish move, as price has gapped down significantly, altering my initial perspective from Sunday. This gap has also led to a break of structure to the downside.
Looking at the current price action, I’ve identified a clean 3-hour demand zone nearby. Price has already shown an initial bullish reaction from this level, but if it fails to hold, there is a deeper 4-hour demand zone where we could also expect a reaction.
Confluences for GU Buys:
- The price gap has left a significant imbalance that needs to be filled.
- Price is currently in a 3-hour demand zone that previously caused a Break of Structure (BOS),
making it a valid POI.
- There is a large pool of liquidity to the upside that needs to be taken.
- The setup aligns well with the DXY correlation.
Note: If price reacts as expected, I will look for potential shorting opportunities around the 1.2400 region, where a 2-hour supply zone is located.
Have a great trading week ahead, everyone!

GBPUSD ANALYSISFrom the gap in the market coming into a new week we could see the market make a push to the down side, but right now i'm currently sitting on the fence as to how the market can trade for the early parts of this week i.e monday .

Time to turn around? GBPUSD"That's GBP, the price go up if it's USD" = Central Cee, 21 Savage
Looks like these two rappers may be onto something here, reaching the 1.618 resistance, we may see the dollar rise against the pound again causing GBP to continue falling.
GBPUSD has currently pierced it's way out of the trend channel, let's see how this plays out.

Market Analysis: GBP/USD Falls Into The RedMarket Analysis: GBP/USD Falls Into The Red
GBP/USD failed to climb above 1.2500 and trimmed all gains.
Important Takeaways for GBP/USD Analysis Today
- The British Pound is showing bearish signs below 1.2400.
- There is a short-term declining channel forming with resistance near 1.2280 on the hourly chart of GBP/USD at FXOpen.
GBP/USD Technical Analysis
On the hourly chart of GBP/USD at FXOpen, the pair started a fresh decline from the 1.2470 zone. As mentioned in the previous analysis, the British Pound struggled to extend gains and declined below the 1.2360 support level against the US Dollar.
There was a clear move below the 1.2320 level. The pair even settled below the 1.2300 level and the 50-hour simple moving average. The pair tested the 1.2250 support zone.
A low was formed at 1.2249 and the pair is now consolidating losses. On the upside, the GBP/USD chart indicates that the pair is facing resistance near 1.2280 and a short-term declining channel. The next major resistance is near the 1.2320.
A close above the 1.2320 resistance zone could open the doors for a move toward the 50% Fib retracement level of the downward move from the 1.2471 swing high to the 1.2249 low at 1.2360.
Any more gains might send it toward the 61.8% Fib retracement level of the downward move from the 1.2471 swing high to the 1.2249 low at 1.2385. If not, the pair could resume its decline below 1.2250. On the downside, there is a key support forming near 1.2220.
If there is a downside break below the 1.2220 support, the pair could accelerate lower. The next major support is near the 1.2150 zone, below which the pair could test 1.2050. Any more losses could lead the pair toward the 1.2000 support.
Trade on TradingView with FXOpen. Consider opening an account and access over 700 markets with tight spreads from 0.0 pips and low commissions from $1.50 per lot.
This article represents the opinion of the Companies operating under the FXOpen brand only. It is not to be construed as an offer, solicitation, or recommendation with respect to products and services provided by the Companies operating under the FXOpen brand, nor is it to be considered financial advice.

GBPUSDHey Traders, what you think of this trade?
Price had 61.8% retracement.
Will it Break the High and go bullish or Low and bearish. Think in probabilities.
My analysis on GBPUSD Buy with a micro lot for Long till 1.3000, Strict Risk 1:3.
Notes for Success:
Timeframes Matter: Align entry/exit with higher-timeframe trends.
Adapt: Adjust targets if volatility spikes (e.g., news events).
Disclaimer: Always include “Not financial advice. Trade at your own risk.”
Comment your analysis below. Thank you

GBPUSD is in the Buying Direction after Testing SupportHello Traders
In This Chart GBPUSD HOURLY Forex Forecast By FOREX PLANET
today GBPUSD analysis 👆
🟢This Chart includes_ (GBPUSD market update)
🟢What is The Next Opportunity on GBPUSD Market
🟢how to Enter to the Valid Entry With Assurance Profit
This CHART is For Trader's that Want to Improve Their Technical Analysis Skills and Their Trading By Understanding How To Analyze The Market Using Multiple Timeframes and Understanding The Bigger Picture on the Charts

EURUSD and GBPUSD Analysis TodayHello traders, this is a complete multiple timeframe analysis of this pair. We see could find significant trading opportunities as per analysis upon price action confirmation we may take this trade. Smash the like button if you find value in this analysis and drop a comment if you have any questions or let me know which pair to cover in my next analysis.

GBPUSD took support from 4h bullish channel – Targeting $1.265Market Context
Instrument: GBPUSD
Timeframe: 4h
Key Trend: Reversal from short 4h downtrend
Catalyst: support from 4h bullish channel + Elliott wave 4 completion.
Technical Analysis
Patterns/Levels: Price broke above the $1.2400 strong support of a 4h bullish channel.
Indicators: MACD bullish crossover; RSI above 50.
Entry Analysis
Entry Zone: 1.24250.
1.2645 (4h key resistance, Caution if fail to break).
Confirmation: support above $1.2400 on the 4h chart.
Exit Analysis
TP1: $1.2575 (prior swing high).
TP2: $1.265 (Wave 5 target).
Risk Management
Stop Loss: $1.2393 (below Support 1.2400).
Risk-Reward: 1:4.
Conclusion
“The support from 4h bullish channel signals a trend reversal.
Targeting $1.2650 with a tight SL ensures favourable risk/reward.”
Notes for Success:
Timeframes Matter: Align entry/exit with higher-timeframe trends.
Adapt: Adjust targets if volatility spikes (e.g., news events).
Disclaimer: Always include “Not financial advice. Trade at your own risk.”

GBPUSDThe GBP/USD pair rose as the US Dollar weakened after slower-than-expected GDP growth of 2.3% for Q4 2024.
Jobless claims fell to 207K, signaling strong labor demand and supporting the Fed's cautious rate stance.
Investors now eye December’s PCE data for further inflation insights.

GBPUSD top-down analysis Hello traders, this is a complete multiple timeframe analysis of this pair. We see could find significant trading opportunities as per analysis upon price action confirmation we may take this trade. Smash the like button if you find value in this analysis and drop a comment if you have any questions or let me know which pair to cover in my next analysis.

GBP/USD SELL IDEA (R:R=9.9)Selling GBP/USD now. A wonderful BAT formation just formed on 4 hour chart. Already forming lower highs and lower lows on smaller timeframes.
Stop Loss is: 125.332
1st Target: 1.23830
2nd Target: 1.23416
3rd Target: 1.22990
4th Target: 1.21600
Hope everyone is able to take advantage of this analysis! :)

GBPUSD: 2000+ Pips Buying Opportunity! Dear Traders,
Hope you are doing great, we have an excellent buying opportunity on GU which worth up to 2000 pips. Please wait for price to make correction and enter accordingly. Use accurate risk management.

GBPUSD: A 1300+| Pips Swing Move One Not To Miss! USD has dominated the market which ultimately taking price of some of the pair to record low and at discounted zone. Although, we should wait for price to breakthrough the inducement line and then enter with accurate risk management.
Team Setupsfx_
