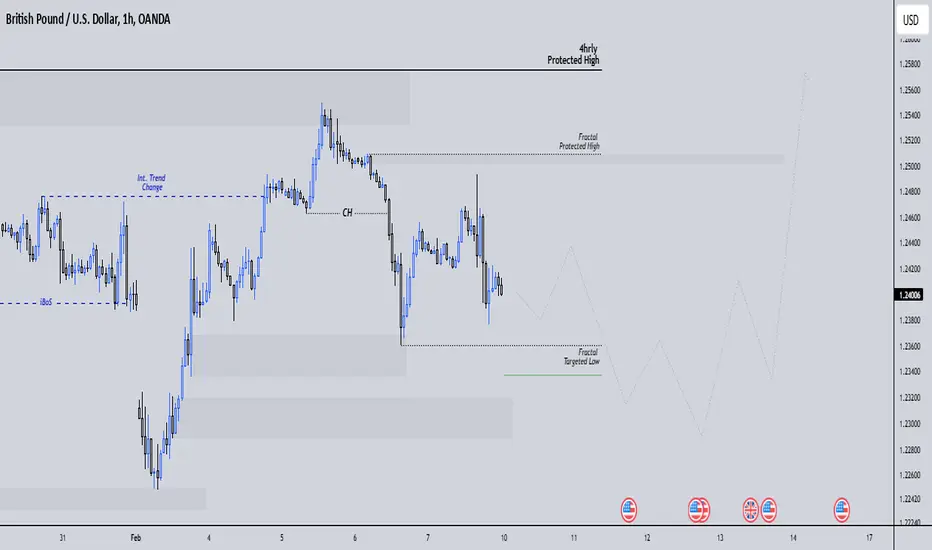
GBPUSD - Analysis and Potential Setups (Intraday- 10.02.25)Overall Trend & Context:
The OANDA:GBPUSD pair is in an overall downtrend on the higher time frames and lower time frames are in alignment.
Technical Findings:
Price broke below all EMA's - is now consolidating below.
Keep an eye on LTF supply levels between 1.24635 - 1.24530 (within 4h supply).
Bullish price action appears inherently weaker against the bears.
Potential Scenarios:
For now I will only be considering shorts.
Trade is active at 1.24150.
Gbpusdshort

GBPUSD Selling Opportunities Daily Swing Structure = Bullish
Daily INternal Structure = Bearish.
Narrative Based on Internal Structure.
We are Pro-trend.
But, we are coming from a strong demand zone.
From a daily perspective, GBPUsd is really not that clear.
It is possible that the demand zone could SPONSOR a move that breaks the Swing Protected High.
In short, this demand zone could be the genesis of phase C moves.
_______________________________________
4HRS
Swing structure = Bearish
Internal Structure = Bullish
We know that internal structure was bullish to facilitate the swing pullback.
We also know that internal trend changed from bullish to bearish hich signaled to us that the pullback phase was over.
The moment internal trend changed from bullish to bearish, the demand zones left behind were now reaction points.
However, Price tapped into demand zone created on Jan 21, and immediate reversed breaking internal change and causing an internal trend change from bearish to bullish.
We know that after every break of structure (iBoS, CHoCH or BoS) we should expect a pullback from the reaction points.
The moment internal trend changed from bearish to bullish, every demand zone left behind (STB Zones, Orderblocks Breakers etc etc) becomes reaction points.
That brings us to where we are.
The orderflow that we should follow is the fractal orderflow that we continue selling the currency until the fractal market structure changes from bearish to bulllish.
The moment fractal structure switches, that signals to us that the internal pullback is over.
GBPUSD LONG: NFP MISSUS January non-farm payrolls +143K vs +170K expected. As a result, we expect the dollar to show some weakness going into the end-of-the-week trading. We are looking for GBPUSD longs as we can see based on the our, the technicals are in support of the fundamentals.

NFP FRIDAY: GBPUSD ANALYSISIn the last video that i posted, i mentioned that we should be expecting a pullback from the demand zone. (Please refer to that video).
What i never mentioned and i actually overlooked it was the STB(SELL TO BUY) wick zone that was slightly below our zone of interest.
Price tapped into it and immediately reversed perfectly. If you were able to get into the buy trade, kudos. For those of us who waited for price to pullback into our supply zone, to sell, this is what NFP did.
Well there is still a chance we may get involved in the market but i'm a bit skeptical. If you managed to catch those sells, Congrats, i would still continue holding the sells until we get to the midrange of the Internal structure, at least 1.23386 there about.
That's it..... I'll see you on Monday. Happy weekend Fam

GbpUsdI found this Leve very interesting 🤔 couple with the fact that I have a Bias for short on GbpChf it seems appropriate.
Check my other insights on my page.
Boost if you find this insightful 🫴

Gbpusd 📉 GBP/USD Elliott Wave & ICT Analysis - Long-Term Bearish Outlook
🟢 Key Observations from the Chart:
1. Macro Structure:
The pair completed a corrective B wave at 1.3050 before reversing sharply.
Wave (1) of the new bearish cycle has likely been established, with support found at 1.2096.
2. Wave (2) in Progress:
Price is currently in a relief rally, forming wave (2).
Ideal retracement zone for wave (2) lies between 1.30 - 1.34, aligning with key liquidity zones & potential fair value gaps (FVG).
A rejection from this zone will confirm the start of wave (3).
3. Projected Wave (3) Decline:
Wave (3) should be the strongest leg downward, targeting 1.13 - 1.10 initially.
Further breakdown may see sub-wave extensions reaching 1.00 and beyond.
This aligns with major institutional liquidity resting below the parity level (1.00).
4. Wave (4) Retracement:
A corrective pullback is expected after a strong wave (3) selloff.
Potential lower high formation between 1.13 - 1.15 before resumption of the final selloff.
5. Final Wave (5) Drop:
Ultimate bear target lies in the 0.95 - 0.92 region, marking the end of a full ABC cycle.
ICT models suggest deep liquidity pools beneath 1.00, making a drop below this level highly probable.
---
📌 Trading Plan & Execution Strategy
💰 Short Entries:
🔹 Sell Limit: 1.30 - 1.34 (Wave 2 Completion Zone)
🔹 Stop Loss: Above 1.35 (Invalidation of Bearish Bias)
🔹 Take Profit 1 (TP1): 1.20 (Break of Structural Low)
🔹 Take Profit 2 (TP2): 1.13 (End of Wave 3)
🔹 Take Profit 3 (TP3): 1.00 (Liquidity Target)
🔹 Take Profit 4 (Final TP): 0.95 - 0.92 (Wave 5 Completion)
✅ ICT Confluence:
Liquidity Pools: Sell-side liquidity below 1.20 & 1.00
Breaker Blocks & Order Blocks: Resistance zone at 1.30 - 1.34
FVG Gaps: Aligning with Elliott Wave wave (2) retracement targets
---
🎯 Summary:
GBP/USD has entered a long-term bearish cycle after failing at 1.30 - 1.34 resistance.
Expect wave (3) to deliver the strongest downside move, targeting 1.13 - 1.10 first.
Final bear target sits below 1.00, where a multi-year cycle low could be formed.
ICT & Elliott Wave align perfectly for a strong sell bias, making this a high-confidence short setup.
🚨 Bearish Confirmation: If price rejects 1.30 - 1.34 zone, expect strong sell momentum!

A Possible Sell for GBPUSDPlease refer to the video that I just published to better understand this idea.
But, my idea is, GBPUSD at the moment hasn't really given a clear directional bias.
We were previously following the bearish internal structure (4hrs and 1HR) but Yesterday we gapped tapping into a daily (4H and 1HR) demand zone. Then immediately shooting and causing an internal trend change as illustrated on the chart.
The reason why I support selling the GBPUSD at the moment (I actually think is the strongest outcome) is based on the simple fact that we expect a pullback after every break of structure. We have three zones to consider that may initiate the pullback as illustrated above.
As such, we keep our eyes open, but even as we sell, at the moment I wouldn't be too ambitious with the sell targets.

Time to turn around? GBPUSD"That's GBP, the price go up if it's USD" = Central Cee, 21 Savage
Looks like these two rappers may be onto something here, reaching the 1.618 resistance, we may see the dollar rise against the pound again causing GBP to continue falling.
GBPUSD has currently pierced it's way out of the trend channel, let's see how this plays out.

GBPUSD Bearish Continuation – Targeting 1.22100OANDA:GBPUSD is trading within a descending channel, indicating the continuation of the bearish trend. The price recently rejected the upper boundary of the channel, which aligns with a key resistance zone. This confirmed rejection suggests the potential for further downside, with the next target around the 1.22100 level.
The bearish scenario assumes that the price respects the descending channel and maintains its downward momentum. A clear move below minor support zones along the way could further confirm this bearish continuation. However, a break above the channel would invalidate this setup and indicate potential bullish pressure.
Let me know your thoughts or if you have an alternative perspective!

EURUSD and GBPUSD Analysis TodayHello traders, this is a complete multiple timeframe analysis of this pair. We see could find significant trading opportunities as per analysis upon price action confirmation we may take this trade. Smash the like button if you find value in this analysis and drop a comment if you have any questions or let me know which pair to cover in my next analysis.

Cable preparing for a boom or CAP?GBPUSD seems to be promising on continuing with its long trend, Aggressive traders may take trades at market execution

GBP/USD SELL IDEA (R:R=9.9)Selling GBP/USD now. A wonderful BAT formation just formed on 4 hour chart. Already forming lower highs and lower lows on smaller timeframes.
Stop Loss is: 125.332
1st Target: 1.23830
2nd Target: 1.23416
3rd Target: 1.22990
4th Target: 1.21600
Hope everyone is able to take advantage of this analysis! :)

GBPUSD TRADE SETUPPotential Trade Setup on GBPUSD
The price has successfully retest a very strong resistance zone, as we can see that the Trend remains bearish and the set Trendline keeps the price on the lower part of the market.
The price is developing, and I am waiting for a retest of the previously broken support and used as resistance before I look for a SHORT trade.
A BUY opportunity is at the top above the weekly Low at 1.2593.
You may find more details in the chart!
Thank you and Trade Responsibly!
❤️PS: Please support with a like or comment if you find this analysis useful for your trading

GBPUSD ANALYSIS IS READY (READ THE CAPTION)This chart represents a technical analysis of the GBP/USD currency pair on a 1-hour timeframe. Here’s a detailed breakdown of the analysis:
1. Current Price Level: The price is trading around 1.24152, as shown by the highlighted blue "BUY" box.
2. Resistance Zone:
A horizontal yellow line marks the key resistance zone around 1.2460–1.2547. This is where the price might struggle to move higher.
A stop-loss level is clearly indicated at 1.25474, suggesting this is the invalidation point for short positions.
3. Support Zone:
There is a clearly marked Target Zone at 1.22016, which serves as the price's potential downward target if the bearish scenario unfolds.
The yellow horizontal lines below the current price represent support areas where buyers might re-enter the market.
4. Bearish Scenario:
The blue arrows show a projected downward movement, indicating a possible price rejection from the resistance zone and a decline toward the 1.22016 target zone.
The analysis suggests a head-and-shoulders pattern, with the red curve marking the "head" and signaling a bearish reversal.
5. Volume Profile: The bars on the right indicate trading activity at various price levels, showing a concentration of volume near current levels, which may act as resistance.
This analysis seems to favor a bearish outlook, expecting a price drop after rejection at resistance. However, it is also safeguarded by a stop-loss to manage risk if the price breaks above the resistance.

GBPUSD Sell ProjectionPrice bounced from a key level, weekly fair value gap. I observed a bearish break of structure and I'm confident the current bulls are sponsored by a retracement to sweep buyside liquidity before price expands lower to the sellside. Go short!

GBPUSD ShortHello there,
GBP tired ???
pair GBPUSD has formed double top pattern , so for that reason i think pattern will continue to be completed.
Good luck !

GBP USD Trade Setup 4-Hour TimeframeOn the 4-hour timeframe, GBP USD has formed a bearish break and retest pattern, which aligns with the 0.50–0.618 Fibonacci retracement levels.
Clean 👌🏻🔥

GBP USD Trade Setup Daily Timeframe
On the daily timeframe, GBP USD has broken below a key support level, which has now turned into resistance. and the price is currently rejecting this level.
We will focus on selling opportunities by analyzing the lower timeframes for entry patterns and confirmation.

Ghost Traders FX GBP/USD Trend Continuation [SHORT]News volume has failed to create disrupt the bearish structure and trend, liquidity remains targetable on the sell side with buyside liquidity swept last night.
I don't see the DXY reversing bearish just yet but I believe we are close.
My Bias is Short as price seems very likely to target 1.203 before any major trend reversal.
Trade Record for GTFX stands at 126 wins, 17 breakevens, 7 losses with a 94%+ W/R & +2670 pips gained.

GBP/USD Shorts from 1.22800 back downMy idea for GBP/USD (GU) this week is slightly different from the others. Currently, GU is positioned between significant liquidity zones, with the most immediate valid POI being the 50-minute supply zone located above the Asian high. I expect the price to sweep that liquidity before reacting to the supply zone and targeting the trendline liquidity below.
After the liquidity sweep and a break of structure, a new supply zone is likely to form. However, at this stage, price action is less clear compared to how EUR/USD (EU) is moving. Therefore, I’ll exercise extra caution in my confluences and avoid overly ambitious take-profit targets.
Confluences for GU Sells:
Significant liquidity below in the form of a trendline that needs to be taken.
A clean 50-minute supply zone sitting above a pool of liquidity.
GU remains bearish overall on higher time frames.
The POI is at an extreme point within the current structure.
DXY remains bullish, supporting this bearish outlook for GU.
Note: If the price breaks the supply zone and then forms a break of structure to the upside, I’ll shift my focus to buy opportunities, similar to my plan for EU.
Have a great trading week, everyone!

GBPUSD is in the Selling Direction after breaking SupportHello Traders
In This Chart GBPUSD HOURLY Forex Forecast By FOREX PLANET
today GBPUSD analysis 👆
🟢This Chart includes_ (GBPUSD market update)
🟢What is The Next Opportunity on GBPUSD Market
🟢how to Enter to the Valid Entry With Assurance Profit
This CHART is For Trader's that Want to Improve Their Technical Analysis Skills and Their Trading By Understanding How To Analyze The Market Using Multiple Timeframes and Understanding The Bigger Picture on the Charts

GBPUSD HTF Bearish Structure & Possible Trade Opportunity 👀 👉 Analyzing the GBPUSD weekly chart reveals a bearish market structure, with a clear lower high and lower low signaling a downtrend. I expect further downside potential following a pullback. In this video, we explore the trend, price action, market structure, and a possible trade setup. ⚠️ This video is for educational purposes only and should not be considered financial advice.

GBPUSD - Short active !!Hello traders!
‼️ This is my perspective on GBPUSD.
Technical analysis: Here we are in a bearish market structure from 4H timeframe perspective, so I look for a short. I expect bearish price action as price rejected from bearish OB + institutional big figure 1.23000. As well we have hidden divergence for sell.
Like, comment and subscribe to be in touch with my content!
