XAUUSDHello Traders! 👋
What are your thoughts on GOLD?
Gold remains below the key resistance zone, experiencing choppy and range-bound movements since last week. As long as the price stays below this resistance level, we expect a potential decline towards the identified support levels.
A break below $2895 could increase selling pressure and open the door for lower targets.
What’s your outlook on gold? Do you think resistance will break?
Don’t forget to like and share your thoughts in the comments! ❤️
Harmonic Patterns

S&P500 - Donald Trump Is Crashing Markets!S&P500 ( TVC:SPX ) is starting a correction:
Click chart above to see the detailed analysis👆🏻
Since Donald Trump was elected the markets have been super volatile and clearly not too easy to trade. But now it seems like bears are slowly taking over the entire U.S. stock market after we just saw a drop of -10% within a couple of days and a correction becomes more and more likely.
Levels to watch: $6.100, $4.800
Keep your long term vision,
Philip (BasicTrading)

Gold is on a relentless hunt for the $2,720 levelGold is on a relentless hunt for the $2,720 level, navigating through a well-defined ascending channel where the upper boundary has acted as long-term resistance and the lower boundary as dynamic support. The price has respected this structure, with multiple touches reinforcing its integrity. However, a recent double top near the upper boundary signals potential bullish exhaustion, increasing the probability of a downside move. If the price remains below this key level, further declines are likely, with $2,720 emerging as a crucial support zone—aligned with the golden pocket on the Fibonacci retracement, making it a prime area for a reaction.
The Alternative Scenario: The New Economy's Bullish Case
Despite the bearish structure, gold in the new economy presents an alternative bullish outlook. A smaller bullish channel has formed between $2,789 and $2,855, suggesting that buyers are still in control within this range. If this mini uptrend holds, it could fuel another breakout attempt above recent highs, invalidating the bearish scenario and positioning gold for a renewed push toward higher levels.
For now, gold is at a crossroads, with $2,720 as the primary target on the downside—but if buyers defend this level or sustain the new bullish channel, the uptrend may persist in the evolving economic landscape.

11.03.25 Morning ForecastPairs on Watch -
OANDA:XAGUSD
FX:NZDCAD
FX:GBPNZD
A short overview of the instruments I am looking at for today, multi-timeframe analysis down to what I will be looking at for an entry. Enjoy!

GBPJPY: Inverse Head and Shoulders PatternGBPJPY: Inverse Head and Shoulders Pattern
In our previous analysis, GBPJPY was developing the right shoulder of the inverse head and shoulders pattern and has since reached the first target.
The situation with the Bank of Japan (BOJ) remains confusing, as their actions have lacked clear direction. Over the past weeks, BOJ has intervened multiple times in the market, causing significant fluctuations in JPY pairs and resulting in many failed patterns. This volatility has been driven by President Trump's accusations of JPY manipulation due to its perceived weakness.
Currently, GBPJPY has confirmed another pattern and appears poised for a short-term rise. If GBPJPY continues its bullish movement, it will encounter a strong resistance zone near 191.90. A breakthrough above this level will solidify the pattern, potentially driving GBPJPY further to 194.30 and 197.80 in the coming days.
You may find more details in the chart!
Thank you and Good Luck!
❤️PS: Please support with a like or comment if you find this analysis useful for your trading day❤️
Disclosure: I am part of Trade Nation's Influencer program and receive a monthly fee for using their TradingView charts in my analysis.

ETH next move revealed ! fasten your seatbelt....Hello Traders! 🐺
I've been in this market for the past six years, and if there's one thing I've learned, it's this: The bull market is just getting started! 🚀
We haven't seen any real signs of a bear market yet. I know some of you might be thinking, "Come on, this was the top!"—but hold on! Stay with me until the end, and I’ll break it all down for you in detail. Let’s dive in! 🔥
Before we begin, let’s recall an old but powerful market narrative:
"The market is designed to take the most money from the most people, most of the time!"
But what does this really mean? And more importantly, how can we use this to our advantage in our trading strategy? 🤔
Stick around—I’m about to break it down! 🔥🚀
In the world of trading, many people chase quick gains—but let’s be real, the only "free money" is found in a mousetrap! 🐭💸
Whales and big players understand this mindset. That’s why, before any major move, they shake out weak hands—but why?
The answer is simple:
1️⃣ If weak hands don’t get shaken out, they’ll likely sell too early in pursuit of short-term profits, creating selling pressure that prevents the price from rising.
2️⃣ Whales need to buy at lower prices, and as we all know—one trader’s loss is another trader’s gain! 💰
Let’s dive into the ETH chart—because that’s why you’re here, right? 😉
Looking at the chart, we’re currently in the final dip before the real pump, according to the Wyckoff method. In my opinion, this presents a great opportunity to buy the dip and position yourself for solid gains. 💰🚀
Are you ready for what’s coming?
also don't forgot to like and follow 😎🙏
🐺 KIU_COIN 🐺

Dogecoin - New All Time Highs Will Come!Dogecoin ( CRYPTO:DOGEUSD ) still remains bullish:
Click chart above to see the detailed analysis👆🏻
If you look at the chart above, you can see almost only green mark ups. That's because despite the recent drop, Dogecoin remains in a very bullish market and is overall clearly heading higher. If this break and retest now plays out, we will even see new all time highs in the future.
Levels to watch: $0.2, $0.5
Keep your long term vision,
Philip (BasicTrading)

GBP/USD Strength Persists, but Watch for Reversal at 1.30Similar to EUR/USD, GBP/USD experienced a strong rally starting in March, breaking above the key resistance level in the 1.2775 zone.
Over the past three days, the pair has consolidated well above the broken resistance level, suggesting that another upward spike is likely.
However, the 1.30 level is both a significant technical and psychological barrier. If the price reaches this zone, a correction could follow.
In conclusion, I’m closely watching the pair, and if we see a spike toward 1.30, I will look for selling opportunities.
Disclosure: I am part of Trade Nation's Influencer program and receive a monthly fee for using their TradingView charts in my analyses and educational articles.

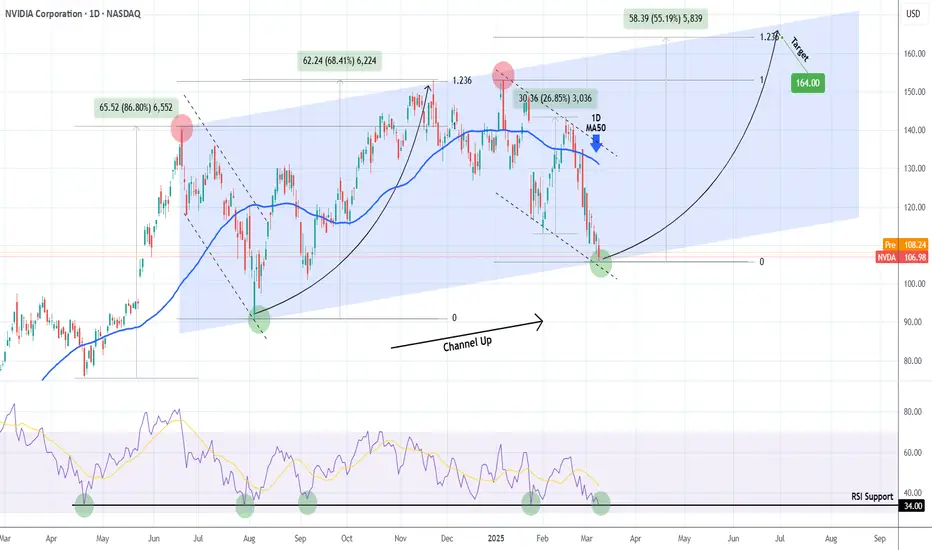
NVIDIA 9-month Channel Up bottomed! Is it a buy??NVIDIA Corporation (NVDA) has been trading within a Channel Up pattern for almost 9 months (since the June 20 2024 High). The correction since the start of January is technically the pattern's Bearish Leg and yesterday it hit the bottom (Higher Low trend-line).
Last time it did so was on August 05 2024 and an instant rebound followed. That was also the time the 1D RSI was on the 34.00 Support, just like today. In fact every time in the past 11 months that this RSI Support was tested, the price rebounded aggressively by at least +26.85%.
Since the previous Higher High rebound peaked on the 1.236 Fibonacci extension, our Target on the medium-term will be $164.00.
-------------------------------------------------------------------------------
** Please LIKE 👍, FOLLOW ✅, SHARE 🙌 and COMMENT ✍ if you enjoy this idea! Also share your ideas and charts in the comments section below! This is best way to keep it relevant, support us, keep the content here free and allow the idea to reach as many people as possible. **
-------------------------------------------------------------------------------
💸💸💸💸💸💸
👇 👇 👇 👇 👇 👇
BITCOIN Is this the last defense before the narrative changes?Bitcoin (BTCUSD) got yet again increasingly volatile during the weekend and is approaching the 1W MA50 (blue trend-line). As mentioned on the title, this is "the last defense" for BTC as so far this price action hasn't diverged a bit from the Channel Up of the 2015 - 2017 Bull Cycle but a break and 1W candle close below it, would jeopardize that.
** The key 1W MA50 **
In fact the only times that Bitcoin closed below its 1W MA50 during a Bull Cycle and the Cycle continued was of course during the March 2020 COVID global market flash crash and November 18 2019. But the current Bull Cycle is nothing like in 2019 - 2021, it doesn't have the initial overextension of the Libra hype (May - June 2019) or Elon's early 2020 hype nor of course the pandemic shutdown. On the contrary it is incredibly similar with 2015 - 2017 with the only difference being that, thanks to the ETF launch in January 2024, the market marginally breached the previous All Time High (ATH) earlier.
** Symmetry playing out **
So back to the similarities between those two Cycles. The Cycle count indicates that we are at the end of the (blue) Bull Rectangle in March 2017 (847 days) when the price almost tested the 1W MA50 and then started the (green) Parabolic Phase to new ATHs (217 days). Even in terms of 1W RSI and MACD, the two fractals are similar, with the RSI being on its 2nd 'Buy the dip Volatility Phase' bottom and the MACD on its 2nd Bullish Cross.
** How high can it get? **
Now as to how high the new Cycle Top can be, can be anybody's guess, but if it repeats the less aggressive 2021 Top, it could be on the 1.618 Fibonacci extension, i.e. around $170k, while if it repeats the (much more unrealistic for such short period of time in terms of market cap) 2017 Top, it could be on the 2.382 Fib ext, i.e. around $520k. The worst case scenario is to have Fib extension Tops on a decreasing rate, in which case the 1.5 - 1.382 levels are next, giving us a potential target range of 120k - 145k, which would be almost a Double Top similar to November 2021.
So what do you think? Will the 1W MA50 come to Bitcoin's rescue yet again or the narrative will change this time? Feel free to let us know in the comments section below!
-------------------------------------------------------------------------------
** Please LIKE 👍, FOLLOW ✅, SHARE 🙌 and COMMENT ✍ if you enjoy this idea! Also share your ideas and charts in the comments section below! This is best way to keep it relevant, support us, keep the content here free and allow the idea to reach as many people as possible. **
-------------------------------------------------------------------------------
💸💸💸💸💸💸
👇 👇 👇 👇 👇 👇

Nvidia - That's Officially The Brutal End!Nvidia ( NASDAQ:NVDA ) is breaking all structure:
Click chart above to see the detailed analysis👆🏻
Following previous cycles, Nvidia has been rallying for more than 2 years, creating an overall pump of approximately +1.000%. But now, everything is literally pointing to a significant towards the downside and with a potential drop of -30%, bears are totally taking over Nvidia now.
Levels to watch: $70
Keep your long term vision,
Philip (BasicTrading)

NASDAQ below its 1W MA50 after 2 years. Doom or recovery ahead??Nasdaq (NDX) broke below its 1W MA50 (blue trend-line) for the first time in 2 years (since week of March 13 2023). That is a strong long-term Support, in fact it is technically the first level to look for during cyclical bull trends. So how bad can a break and/or 1W candle closing below it?
As you can see on this multi-year chart on the 1W time-frame, since the 2008 Housing Crisis, the index has had a number of breaks below its 1W MA50. With the exception of the 2022 Inflation Crisis, which was a cyclical Bear Market like 2008, all of those breaks were short-lived and rebounded on the 1W MA100 (green trend-line) almost instantly.
In fact, the current technical pull-back resembles the June - August 2011 correction, which after breaking below the 1W MA50, it found support and rebounded on the 1W MA100 in 2 weeks. The rebound that followed rose by +38% in 7 months. If a similar development is followed, which is what we expect, we are looking at a potential end-of-year rally to 24900. This also took place on the 2019 rally.
What makes this 17-year recurring pattern even more interesting is that technical pull-backs such as the current, tend to take place when the 1W RSI Channel Down, a technical Bearish Divergence) hits 40.00 and makes a Lower Low (green circles).
-------------------------------------------------------------------------------
** Please LIKE 👍, FOLLOW ✅, SHARE 🙌 and COMMENT ✍ if you enjoy this idea! Also share your ideas and charts in the comments section below! This is best way to keep it relevant, support us, keep the content here free and allow the idea to reach as many people as possible. **
-------------------------------------------------------------------------------
💸💸💸💸💸💸
👇 👇 👇 👇 👇 👇

Short-Term Opportunity in NAS100: Rebound in Play?Since reaching its all-time high (ATH) three weeks ago, NAS100 has dropped approximately 3,000 pips, hitting a low near the 19,000 zone yesterday.
Currently, the CFD price is rebounding, and this recovery could extend into the New York trading session.
Although my overall correction target remains around 18,000, I anticipate a short-term relief rally at this stage.
From a short-term trading perspective, the 19,000 level could present a good entry opportunity. With a tight stop and a target slightly above 20,000, this setup offers a favorable risk-reward ratio.

Falling towards 61.8% Fibonacci support?The Aussie (AUD/USD) is falling towards the pivot and could bounce to the 1st resistance which acts as a pullback resistance.
Pivot: 0.6245
1st Support: 0.6184
1st Resistance: 0.6329
Risk Warning:
Trading Forex and CFDs carries a high level of risk to your capital and you should only trade with money you can afford to lose. Trading Forex and CFDs may not be suitable for all investors, so please ensure that you fully understand the risks involved and seek independent advice if necessary.
Disclaimer:
The above opinions given constitute general market commentary, and do not constitute the opinion or advice of IC Markets or any form of personal or investment advice.
Any opinions, news, research, analyses, prices, other information, or links to third-party sites contained on this website are provided on an "as-is" basis, are intended only to be informative, is not an advice nor a recommendation, nor research, or a record of our trading prices, or an offer of, or solicitation for a transaction in any financial instrument and thus should not be treated as such. The information provided does not involve any specific investment objectives, financial situation and needs of any specific person who may receive it. Please be aware, that past performance is not a reliable indicator of future performance and/or results. Past Performance or Forward-looking scenarios based upon the reasonable beliefs of the third-party provider are not a guarantee of future performance. Actual results may differ materially from those anticipated in forward-looking or past performance statements. IC Markets makes no representation or warranty and assumes no liability as to the accuracy or completeness of the information provided, nor any loss arising from any investment based on a recommendation, forecast or any information supplied by any third-party.

GOLD GOLD bulls took advantage of the fib level and daily support at 2880-2879 and attempting 2915-2917 supply ,the 2915-2917 is yesterday demand floor breakout on 4hour ,they will respect it where i see a correction into 2900-2904 to resume buying into 2935-2938 and my higher zone of sell is in the chart for reference...this free idea and i don't charge any money from anybody or paid group.

XAUUSD Strategy AnalysisCurrently, the overall gold market is on the weaker side. However, we should by no means chase short positions at low levels. Instead, we should wait for a rebound and look for opportunities to trade.
Resistance levels: 2925
Support levels: 2886
I will share accurate trading strategies every day, and the accuracy rate of the trading signals reaches 90%. Click on the link below the article to obtain the accurate signals.

Harmonic Potentials On SPY & VIX Signal Huge ReversalUsing a harmonic pattern detection script developed by reees alongside RSI with a 15 minute timeframe, we see that AMEX:SPY has a huge upside potential to ~$588 while the TVC:VIX is showing that it has a high chance to sell off. With the RSI break above its moving average for AMEX:SPY and below the moving average for TVC:VIX , the patterns potential completion is strengthened. Usually, based on historical data, when both these instruments show an anti-symmetric pattern potential, it typically has a high chance of succeeding and reaching the potential price zone.

The Next Few Weeks Determine Bitcoin's Outlook (Testing Channel)We have been respecting an upward channel since fall of 2022 (16K).
Breaking down each year into a cycle, Fib levels show us that we see a bull run, then a retest.
I used Cycle B start/bottom based on the prior Cycle A's retracement, and so on. However, I didn't consider a Cycle to be at the official start/bottom unless the following candles demonstrated a break to the upside over the prior cycle high.
For example:
Cycle A (approx Oct '22 to Sept '23)
Fib bottom (0) 16K to top (100) 32K (approx 2x increase)
Retraced 38.2% (0.618) to 26K
Cycle B (approx Oct '23 to Sept '24)
Fib bottom (0) 26K to top (100) 75K (approx 3x increase)
Retraced 38.2% (0.618) to 55K
Cycle C (approx Oct '24 to Sept '25?)
Fib bottom (0) 55K to top (100) 109K (approx 2x increase)
Retraced 61.8% (0.382) to approx 78K
(STILL TESTING THIS LEVEL).
If BTC can break 109K before Sept '25, new upside levels at 1.618 (142K), 2.618 (195K), 3.618 (249K)*
If BTC drops below 75K, upward channel is invalidated, with support levels (prior cycle fibs) at 68K, 56K and 32K.

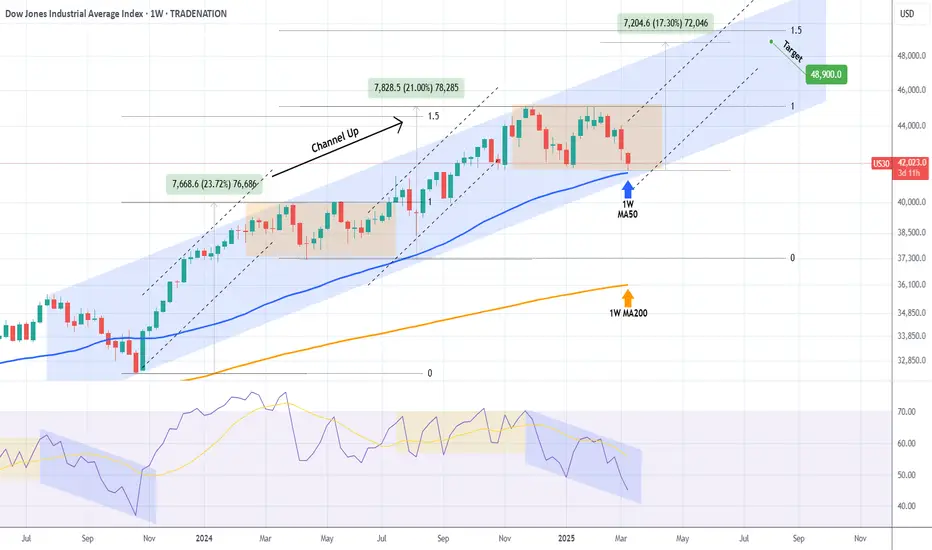
DOW JONES Can the 1W MA50 hold and spark an end-of-year rally?Dow Jones (DJIA) has been trading within a Channel Up pattern since the late July 2023 High. The decline of the last 30 days can be technically seen as the Bearish Leg that will price its new Higher Low bottom.
The price isn't only close to the Channel's bottom but also the 1W MA50 (blue trend-line), a level that has been supporting since the October 30 2023 bullish break-out. As a result, a 1W MA50 hit will be a potential double support test, with the 1W RSI also printing a Bearish Leg similar to the one that led to the October 2023 bottom.
On the other hand, the ranged price action since the late November 2024 High, resembles the sideways volatility of the first half of 2024. Both were initiated after Higher High pricings at the top of the Channel Up. The rallies that led to those tops have been +21.00% and +23.72% respectively.
If there is a decreasing rate on each Bullish Leg, then the new one should be +17.30% (i.e. -3.30% less than the previous one), which falls marginally below the 1.5 Fibonacci extension, which is where the November 2024 High was priced.
As a result, as long as Dow is closing its 1W candles above the 1W MA50, the 2-year Channel Up is more likely to push upwards again for its new Bullish Leg, potentially targeting 48900 (+17.30%).
-------------------------------------------------------------------------------
** Please LIKE 👍, FOLLOW ✅, SHARE 🙌 and COMMENT ✍ if you enjoy this idea! Also share your ideas and charts in the comments section below! This is best way to keep it relevant, support us, keep the content here free and allow the idea to reach as many people as possible. **
-------------------------------------------------------------------------------
Disclosure: I am part of Trade Nation's Influencer program and receive a monthly fee for using their TradingView charts in my analysis.
💸💸💸💸💸💸
👇 👇 👇 👇 👇 👇
XAUUSD: $2905 TO $2800 A thousand pips move! One not to miss! Gold is currently in distribution phase and is likely to drop further since price currently testing the supply area and might drop from the area that we have shown. Like and comment for more.
Want more then like and comment our ideas which will encourage us to post more.❤️

$SPY Bounce to 590s?Hey everyone, it's your boy pic. AMEX:SPY looks primed for a typical ABC correction to around 590 going into the second half of March. Chart lines up with NextPivot Indicator and FIB levels just as pretty as you please. Nice look with clear stops. Good luck!

IndusInd Bank Cypher / Shark formation-Can take it to 550 / 410On a Monthly time frame,
IndusInd Bank has shown Cypher / Shark formation.
Any monthly candle close below 780 will open gate for following targets,
780 / 650 / 550 / 410

ETH: Bullish Harmonic PatternETH: Bullish Harmonic Pattern
ETH has completed a bullish harmonic pattern and subsequently moved down to test the $2,000 price zone, which is a significant psychological level for Ethereum.
ETH is expected to recover as long as the price remains above $2,000. In the short term, I anticipate a possible retest of $2,195 and $2,280.
However, a movement below $2,000 could initiate a larger bearish wave, making this level crucial to watch.
You may find more details in the chart!
Thank you and Good Luck!
❤️PS: Please support with a like or comment if you find this analysis useful for your trading day❤️
