$NVDA Short OpportunitiyReasons I am bearish on NASDAQ:NVDA
4-hour trendline resistance
4-hour bearish order block
Entry: 131.98
Take Profit: 100.27 (scale profits on the way down)
Stop Loss: 140.80
Ictconcepts

Bitcoin’s Next Move: Bullish Momentum Building Toward 67,000 USDThe price has reacted to a higher-timeframe Order Block after completing a PO3 cycle, and has also completed an MMSM cycle. Currently, it's forming an MMBM. The target is set for prices above 67,000 USD.

Awaiting manipulationThe overall overview looks bullish, awaiting accumulation of sellers and manipulating them with the fake holding highs having them see it as resistance. then driving up to the $

WEEKLY FOREX FORECAST SEPT 7-11th: GBPUSD GBP | GBPUSD is at an OTE level currently, and may find support for higher prices. I am on the lookout for BUY setups, as I do not want to take shorts in this market until prices breaks below 1.3000.
Check the comments section below for updates regarding this analysis throughout the week.
Enjoy!
May profits be upon you.
Leave any questions or comments in the comment section.
I appreciate any feedback from my viewers!
Like and/or subscribe if you want more accurate analysis.
Thank you so much!
Disclaimer:
I do not provide personal investment advice and I am not a qualified licensed investment advisor.
All information found here, including any ideas, opinions, views, predictions, forecasts, commentaries, suggestions, expressed or implied herein, are for informational, entertainment or educational purposes only and should not be construed as personal investment advice. While the information provided is believed to be accurate, it may include errors or inaccuracies.
I will not and cannot be held liable for any actions you take as a result of anything you read here.
Conduct your own due diligence, or consult a licensed financial advisor or broker before making any and all investment decisions. Any investments, trades, speculations, or decisions made on the basis of any information found on this channel, expressed or implied herein, are committed at your own risk, financial or otherwise.

WEEKLY FOREX FORECAST SEPT 7-11th: EURUSD EURUSD is at an OTE level currently, and may find support for higher prices. I am on the lookout for BUY setups, as I do not want to take shorts in this market until prices breaks below 1.0940.
Check the comments section below for updates regarding this analysis throughout the week.
Enjoy!
May profits be upon you.
Leave any questions or comments in the comment section.
I appreciate any feedback from my viewers!
Like and/or subscribe if you want more accurate analysis.
Thank you so much!
Disclaimer:
I do not provide personal investment advice and I am not a qualified licensed investment advisor.
All information found here, including any ideas, opinions, views, predictions, forecasts, commentaries, suggestions, expressed or implied herein, are for informational, entertainment or educational purposes only and should not be construed as personal investment advice. While the information provided is believed to be accurate, it may include errors or inaccuracies.
I will not and cannot be held liable for any actions you take as a result of anything you read here.
Conduct your own due diligence, or consult a licensed financial advisor or broker before making any and all investment decisions. Any investments, trades, speculations, or decisions made on the basis of any information found on this channel, expressed or implied herein, are committed at your own risk, financial or otherwise.

ICT Concepts Nasdaq Weekly Bias is Bearish 14/18 Oct 2024Smart Money Concepts Used ICT 2022 Mentorship and Core Content Weekly Index Market is Bearish. It Is Not Investment Advice. Its All up to Your Experience And Risk Management

Gold Buy price has not shown up all Buy side liquidity taken price has shown Sell side bais but as we know gold is Bullish over Monthly to weekly to daily to H4 and from yesterday Gold is stuck between buy and sell side trend also we have mentioned Inverse Head & shoulder pattern on H1 TF also Gold is forming a Rising wedge over H4 TF so we are bullish over Gold for even next week gold only palys with emotions

BTCUSD SELLwe have swept PDH we have a unicorn setup with displacement to the downside we enter off the IMB stops at the high we target 1:2 RRR

Trading EURUSD | Judas Swing Strategy 01/10/2024The Judas Swing strategy is straightforward and can be incorporated into any trader's toolkit. It is a well-tested approach that has shown effectiveness when its guidelines are adhered to. The strategy offers a favorable risk-reward ratio, risking 1% to potentially achieve a 2% return. In this post we intend to walk you through a recent trade we took on EURUSD using this strategy.
We arrived at our trading desk at 08:25 EST, where we began by demarcating the zones for the trading period. This involves drawing vertical lines on the 00:00 and 08:30 EST candles. Following this, we mark the highs and lows within these zones, as they will serve as the liquidity pools for our trading session.
The subsequent step on the checklist is to observe whether the high or the low of this trading zone is breached, as it will guide our bias for the trading session. Five minutes later, the low of the zone was breached, indicating that we should be on the lookout for potential buying opportunities during this session.
Even with a bias for the session, we don't execute the trade blindly. The next step on our checklist is to wait for a break of structure to the buy side. This break of structure must leave a Fair Value Gap (FVG) behind.
Once the structure is broken and the fair value gap (FVG) conditions are met, the next step is to wait for the price to retrace back into the FVG. A trade should only be entered after the candle that moves into the FVG has closed. After 10 minutes, price retraced and closed within the Fair Value Gap, fulfilling all the conditions on our entry checklist, allowing us to execute our trade.
For stop placement, we use the lowest point of the price leg that broke the structure, provided it satisfies specific conditions. The minimum stop loss applied is 10 pips because a tight stop loss is not desirable, as it doesn't allow the trade sufficient room. In this instance, using the low would have resulted in a 4 pips stop; therefore, we extended it to a 10 pips stop loss with a 20 pips take profit and executed the trade.
It's important to note that we risked only 1% of our trading account, an amount we're comfortable with losing, thereby eliminating any emotional attachment to this trade. Consequently, we are at peace with the outcome of this trade, be it a win or a loss.
The result of this trade was a loss, which we accepted because we understand that the win rate for this strategy on EURUSD is around 50%, indicating that losses are inevitable with this strategy. However, as our winning trades typically outweigh our losses over time, this strategy should yield positive returns, making it unnecessary to focus on a single loss. Moreover, this post serves as a tutorial on how to trade using the Judas swing strategy and emphasizes that incurring losses is a normal aspect of trading.

A long Position 1HR Timeframe - wait for confirmation The idea was analyzed by ICT and the entry model uses two famous elements that were proven to be used for a successful entry.
The price is targeting the internal liquidity on the 1 HR fair value gap and followed by an order block on the one-hour time frame.
T rade Target: RR1:2.52
This is for educational purposes and not financial advice. Try it on a demo account or use backtesting if you missed the idea.
Good luck ;)

Could We Be Going Long???Daily: Monday's candle swept below Friday's low and closed bullish. Price is still extended at a higher high in the daily bullish trading range. Price can potentially move higher into the previous day's high.
4hr: The 4hr trading range is still bullish in the corrective phase back into the 4hr volume profile POC, but we can see a potential reversal for longs playing out if the price closes above 20286.50 on the 4hr
m15: If that happens I will look for a pullback sweeping sell side for long entry
Again, we let the price develop overnight before the NY session and updated in the morning to see if anything had changed.
Since NQ and ES move in the same direction I will be monitoring for divergence or convergence between the two

NAS100USD: Bearish Setup Targeting Weekly FVG!Greetings Traders!
Brief Description🖊️:
Currently, on NAS100USD, I am anticipating a potential bearish draw in price action. The M15 chart has shown the beginning of a bearish decline, and it’s crucial to follow the market's trend until signs of reversal appear. One key confluence is the respect of an H4 bearish order block, establishing a firm resistance zone.
Things I Have Seen👀:
H4 Bearish Order Block Resistance🟥: Price is respecting this zone, confirming it as strong resistance.
M15 Buy Stops Cleared✅: Price cleared M15 buy stops above the resistance before reversing, indicating smart money engineered liquidity before driving price lower.
M15 FVG & Bearish Order Block: These are the zones where I will be waiting for confirmation entries.
Bearish Targets🎯:
Weekly FVG (19,760.8): This is the primary target for the bearish continuation.
What's Important Now❗
Monitor price action around the M15 FVG and bearish order block for confirmation before entering. Ensure to conduct your own analysis to validate this outlook.
Best Regards,
The_Architect

Okay what's my bias on EU?Price action lately is kinda tweaking. But to my research, I am still looking forward to a bullish trend toward the DOL I marked last week. Tho it showed SMT divergence with GU so yall gotta be careful.
Peace.
Hope I have been helping you guys

XAU, our opp :skull:Well, about XAUUSD, I noticed it broke ATH multiple times, cuz of war and government stuff.
I think long term, it will retrace back to the weekly FVG I marked.
But be careful with the internal liquidity down there, that's all.
Peace.
Hope I can help anyone.

Let The Price Develop Daily: Last week, the price extended higher until Thursday staying in the daily higher high range
Friday's price closed lower potentially starting a corrective phase this week
4hr: The 4hr trading range is still bullish but has now started the corrective phase back into the 4hr volume profile POC, There is a bullish imbalance sitting around the 20,138.00 area that could act as potential support, but we would need confirmations for longs
m15: Since the 4hr is in correction, the m15 is bearish, and we can see potential short-term selling. I will be watching 20,255.00 to 20,221.00 levels for shorts.
Of Course, let the price develop overnight before the NY session when I will update to see if anything has changed.
Since NQ and ES move in the same direction I will be monitoring for divergence or convergence between the two

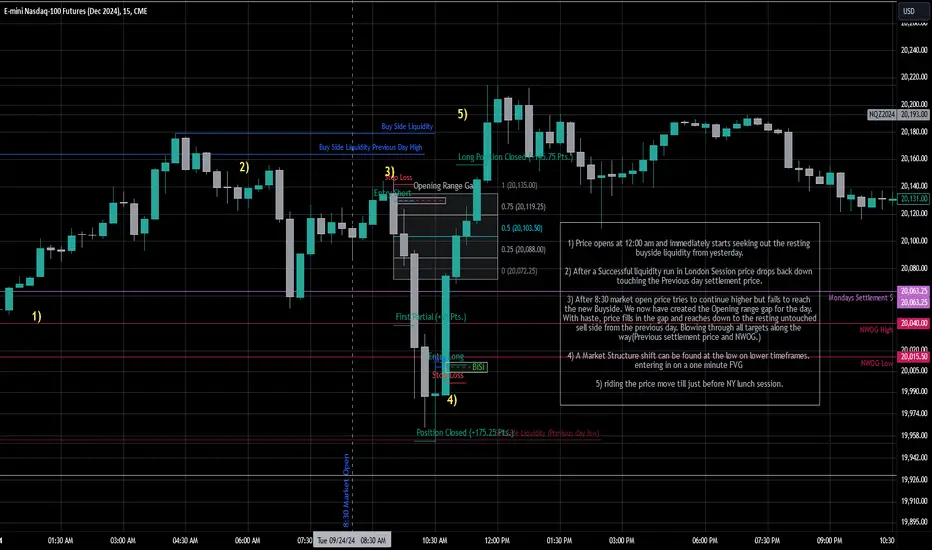
Tuesday Surf Session (NQZ2024)1) Price opens at 12:00 am and immediately starts seeking out the resting buyside liquidity from yesterday.
2) After a Successful liquidity run in London Session price drops back down touching the Previous day settlement price.
3) After 8:30 market open price tries to continue higher but fails to reach the new Buyside. We now have created the Opening range gap for the day. With haste, price fills in the gap and reaches down to the resting untouched sell side from the previous day. Blowing through all targets along the way(Previous settlement price and NWOG.)
4) A Market Structure shift can be found at the low on lower timeframes. entering in on a one minute FVG
5) riding the price move till just before NY lunch session.
This is not trade advice just for my own studying and journaling.
My best trade of the year:This was my best trade of the year.
Its no surprise, the way it lined up:
1hrRJ (previous day session)
Above Asia
LL Confirmation
15minOB Entry
DXY Correlation

Tricky Spot Thursday's candle closed above the prior day's high, reaching the weekly SIBI, overnight in the Asian session the price rallied, consolidated in London, and Reversed In the NY Session
4hr market structure is still bullish but at the top of the range creating a bearish reversal with high volume that created a bearish SIBI retesting value area high or the 4hr trading range/4hr Fixed Volume profile the 4hr bullish bars that traded away from POC showed an increase in volume but the bearish volume was higher
m15 has two potential areas from long at 20,271.00 or at 20,140.00
but I'm being mindful of the 20,406.00 to 20,362.00 level that can act as resistance causing longs to get squeezed out of their positions
I will review what happens overnight
Since NQ is typically correlated with ES I will monitor both for direction confirmation and divergences and convergences

A SWING BULLISH SCENARIO FOR THE POUND?DOLLAR (GBPUSD) PAIRClearly price is in an upward trajectory as price recently gave us a break of structure from July 2023 high which was a pivot point and a strong high for price . Previously we saw price gave us a break of structure to the downside from the highs that were created in may of 2021 around 1.4247 and the low that gave a BOS in sep of 2022 around 1.0343 which prompted price to trade back into premium zone of these two ranges. Price tapped into 0.705 fib level around 1.0309 in July of 2023 and immediately rejected which is normal if price is meant to continue downward. but price sold and found support around 1.0204 in Oct of 2023 which technically means a trendline is activated to support price suggesting market participants expect a possible trending market to the upside . Now recently price has violated 2023 high which was supposed to be intact if we are bearish, thus confriming the possibilitiesof an uptrend. possible next supply zone for price will be equal 2021 highs or monthly bearish ob around 2021 highs. If the consequent encroachment of the ob fails to resist price then price will either use 2021 highs as draw on liquidity to retrace back into fib OTE levels or just break above, either ways that zone is GU's next line of defense.

I took another profit at 65650BINANCE:BTCUSDT.P
Now I cut 80% of my position and keeping 20% for the terminus target.

Well... what about USDJPY?There will be two scenario.
Either price take that Daily High as liq grab(or inducement) to fall, if that is the case there should be some of these sign:
Price consolidate when it about to come to that high, quick grab and fall strong.
If not, it would just go straight to the DOL, which i prefer would happen.
Make sure to do partials.
Peace

Bullish into Weekly SIBIWednesday's candle closed above the prior day's high, reaching the weekly high as well as the previous month's high, we could potentially see the price continue to rally into weekly sibi
4hr market structure is still bullish but after the rally, the price has now closed above 4hr swing-high
4hr Fixed Volume profile shows the POC is at the high of a price and now price action is moving away from that area in a bullish fashion
m15 has two potential areas from long at 20,221.00 or at
if the Asian session continues to expand we will have to see how London's action is traded especially if the price reaches the w-sibi first in the overnight session which could result in a NY session reversal
Since NQ is typically correlated with ES I will monitor both for direction confirmation and divergences and convergences

Eye For Longs wiith Caution Tuesday's candle closed above prior day high, as well as reaching weekly high
4hr market structure is still bullish but after rally price failed to close above 4hr swing high
4hr Fixed Volume profile shows the POC is at the highs on the 4hr price attempted to move away from POC in a bullish fashion but could be a weak move due to the failed closure
I want to see what develops over night to get a clearer picture
but i do see a potential area for longs at 20,097.00 or 20,060.00
Since NQ is typically correlated with ES I will monitor both for direction confirmation and divergences and convergences
