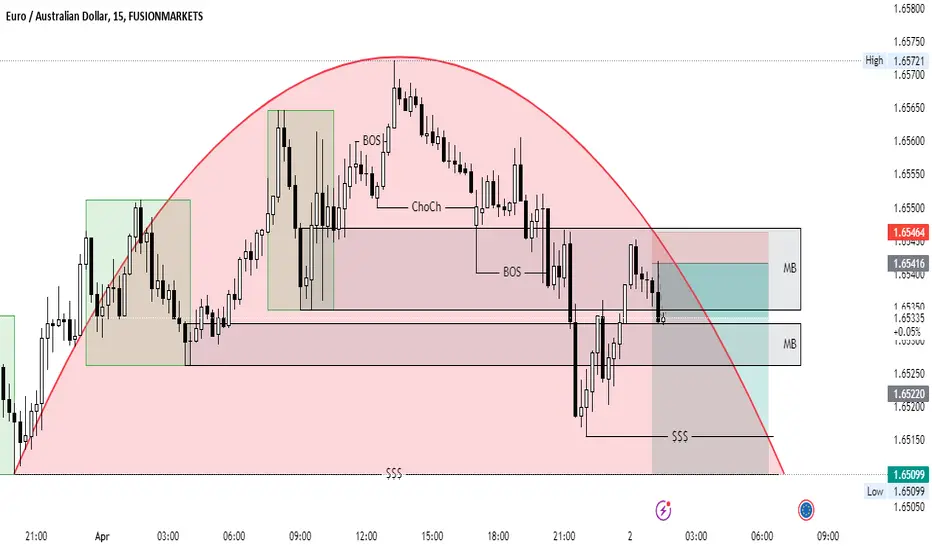
I think its doing Drop Base RallyThis is not a financial idea or something. Im just learning ICT concepts and testing. Do not use this chart
Ictconcepts

Anticipating DXY's Next Move: A Week Ahead AnalysisLast week, I was expecting DXY to tap into the buy-side liquidity, which it accomplished on Monday. Consequently, I mostly stayed on the sidelines as it met my target. Looking forward to the coming week, considering DXY has taken out its February high and is currently trading within the monthly BPR and fair value gap and at the OTE (Optimal Trade Entry) level, my anticipation aligns with the bearish seasonal for April.
Given this, I foresee bearish price action in the upcoming week. Presently, on the weekly timeframe, DXY find itself trap in a PD arrays, necessitating further displacement for confirmation. Additionally, on the four-hour chart, the market maker sell model is poised to come into play.
As we analyze the weekly candle, the open-high-low-close (OHLC) configuration suggests a bearish outlook for the week ahead.
#dxy #forextrader #tradingcards #MarketOutlook

EurUsd hindsightDollar 4hr Rejection/Volume Confluence
Previous Day 1 hour NYK Bearish OB
London Killzone
CPI News
The Perfect Trade.

GBPUSD: Shift to Bullish Order Flow (CPI High Impact News)GBPUSD has recently shifted to a bullish institutional order flow, prompting us to identify key areas of interest conducive to the bullish bias . Currently, we're observing a mitigation block situated at premium prices , serving as an initial entry point for our bullish trajectory. Alternatively, should the premium point not materialize, we await a dip into the discount sell stops , offering viable buying opportunities post-confirmation.
This bullish sentiment is reinforced by a low resistance liquidity zone, strategically positioning us to capitalize on favorable trading conditions. By aligning our strategies with areas of low resistance, we enhance our chances of success in navigating the market dynamics.
Today, we're also expecting the CPI News release , which may inject high volatility into the market , potentially favoring bullish movements . Stay tuned for updates.
Please watch my GBPUSD analysis from long-term to short-term below.
Kind Regards,
The_Architect

NAS100USD: New York Session Buy OpportunityCurrently, on NAS100USD, we find ourselves within a H4 Bullish Order Block, coinciding with a H1 bullish breaker block. This alignment suggests a continuation of the bullish momentum, aiming for the H4 Premium Buy Stops. Notably, there are relatively equal highs, presenting significant liquidity, which indicates a probable draw by the market.
Kind Regards,
The_Architect

#XTIUSD/USOIL: Will bull take price to $100?Dear Traders,
Hope you are doing great, US OIL we can see a strong bullish impulse in coming months, in coming months we can target US OIL to hit 79.00 region first then $85.. and final target will be $100. Plus, wait for price to breakthrough the bearish trend line and once it does you can take safe entry. If you want to take higher risk you can enter now with a accurate risk management.
Sellers exhausted and we can see in daily timeframe as price have failed to break through recent LOWER LOW. This is a good sign for us when we are eying for big target.
Please like and comment if you agree with the idea ;)

GBPUSD Weekly Outlook: Analyzing Potential Trends and IdeasIn this video, I'll conduct a comprehensive analysis of GBPUSD , examining it from a High Timeframe (HTF) perspective down to our Low Timeframes (LTF) . This approach will provide insights into what to expect in trading for the upcoming week.
Additionally, I'll delve into an analysis of the DXY to further enhance our understanding of market dynamics. Stay tuned for valuable insights and strategies.
Kind Regards,
The_Architect

I'm Back: EURAUD ShortMARKET PHASE
OANDA:EURAUD is in a long term downtrend (daily) with a short term corrective structure that has been taking place (4 hour).
AREA OF VALUE
Price continued to break new highs within this corrective structure. Eventually, price reached an area where sellers stepped in, resulting in a buildup of liquidity (buy stops, longs, short stop losses) above the corrective structure swing highs. Price violently moved up to trigger the buy stops (liquidity) to pair against the sell orders needed to take price down. Price then started it's initial move down and actually sustained selling pressure for some time. Due to the velocity of the downward move, priced gapped around 1.64394. During this morning, price hit 1.64394 a couple times and sold off aggressively, supporting our thesis. Our sell limit order was filled and we are now in a short with the following parameters:
TRADE
Sell Limit: 1.64394
Stop Loss: 1.64534
Take Profit: 1.64114

EURGBP LongMARKET PHASE
OANDA:EURGBP is in a long term uptrend (daily) with a short term corrective structure that has been taking place (4 hour).
AREA OF VALUE
Price continued to break lows within the corrective structure until it began to hold the bottom. There was a buildup of liquidity (sell stops, shorts, long order stop losses) below the corrective structure swing lows. Price violently moved down to trigger the sell stops (liquidity) to pair against the buy orders needed to take price up. Price has now started it’s initial move up but due to the velocity of the upward move, it's gapped orders around 0.85773. Price has retraced back to this level to meet the demand multiple times and is met with extreme buying pressure. We can now expect a strong push upwards in the direction of the larger trend.
TRADE
I've entered my long position on OANDA:EURGBP as follows:
Buy Limit: 0.85773
Stop Loss: 0.85733
Take Profit: 0.85853

GBPNZD ShortMARKET PHASE
OANDA:GBPNZD is in a long term downtrend (daily) with a short term corrective structure that has been taking place (4 hour).
AREA OF VALUE
Price continued to break new highs within this corrective structure. Eventually, price reached an area where sellers stepped in, resulting in a buildup of liquidity (buy stops, longs, short stop losses) above the corrective structure swing highs. Price violently moved up to trigger the buy stops (liquidity) to pair against the sell orders needed to take price down. Price then started it's initial move down and actually sustained selling pressure for some time. Due to the velocity of the downward move, priced gapped around 2.09800. During this morning, price hit 2.09800, and began selling off, supporting our thesis. Our sell limit order was filled and we are now in a short with the following parameters:
TRADE
Sell Limit: 2.09800
Stop Loss: 2.10100
Take Profit: 2.09200

XAUUSD SCENARIOHi guys, I'm back with fresh analysis on gold.
if you haven't check my last analysis please do, price moved up from 2281 level for more than 700 pips. which was amazing.
Major institutions are still long on gold(based on COT data) and is still making new highs, so buying on demand levels is sensible.
First level is 2330 which is a broken resistance now acting as support also around level 2328 there is a tiny demand level, beneath that 2318 and last but not least 2308- 2302.
once price reaches these levels you could take long trades with confirmation on lower time frame.
And for those who want to take short trades 2346-2350 would be our supply zone but be really careful with shorts since fundamentals are bullish.
* As always add your intuition and logic into this and do consider risk management.
*Be honorable

DXY short term bearish with ICT Unicorn Model ft. ICT ConceptM15 Unicorn Breaker
M15 FVG inside Breaker
M15 -OB
Inside H1 FVG
Look for entry at M5
Extpect targets H4 BPR (Below)

EUR/CAD Looking an MMSM.In this analysis i am looking for an MMSM after the Daily FVG has been achieved, thus finishing the MMBM. Now the main thing is to refine the entry point so that we are not poorly positioned to seek a higher RR until the next Sellside Liquidity.
All analysis was done based on ICT concepts.

EURCHF:🟢Is it bullish...?!🟢(Details on caption)This is a beautiful price action.
We can see a clear market maker-buy model here.
Smart money reversal and distribution phase one is already done, now we should wait to intermediate low form and then buy.
Now, I can see the steel side liquidity formed above and inside the FVG which is a high-probability scenario for buy.
If the price continues to create a higher high and higher low, we should wait for the price to grab the liquidity below the low and then look for a buying opportunity in a lower time frame.
💡Wait for the update!
🗓️08/04/2024
🔎 DYOR
💌It is my honor to share your comments with me💌

Two insane 1:30 RR Trades in one day.USDCAD Had 2 amazing trades today.
One brilliant trade per Killzone.
They are always here every day.
Are you logging price movement?
Are you training yourself to see it?
2% gain a week is just the start.

GOLD: Possible Downtrend to continue till $2180! Gold created a record HH and it is very likely price is likely to remain extremely bullish in upcoming days. Now, in our price can drop around 2180$ a perfect time for correction to occur, if price do not respect our entry and make it invalid then it would be tough to find a accurate entry to either buy or sell.

USDCAD Wednesday London Killzone TradeWonderful Price action, and Precision Trade taken place here.
Wednesday Reversal
London Killzone
USD Convergence
PDHs Taken

EURUSD: Trading Plan For The Coming WeeksHey Folks. Here is my trading plan and idea for EURUSD for the weeks ahead.
As it is clear the price is moving in positive ranges in 4-hour time frame. In the last Positive range, by mitigating the "Decision Block" and Creating a new HH, there is a level of liquidity in the range and I am waiting for it to be hunted. After Hunting the level there are 3 places I look forward to Buy:
1. The Nearest Extreme Flip in Discount Area of the Current Range if and only if I see Reverse Pattern in 15m chart.
2. The most extreme block of the Current range since there is an inducement level(FVG) near it if and only if I see Reverse Pattern in 15m chart.
3. If market drops deeper I will look forward to buy, after Hunting the weak low of the first positive range, following the reverse pattern in 15m chart in the first positive range's extreme flips.

DXY SELL TRADEFrom technical analysis we can see a huge expansion to the upside after the release of the NFP data .
what i would like to see is the candle reaching 105.550 level liquidity void on daily chart to consider a short
MY TRADE
SELL 105.550
TAKE PROFIT 97.000
SL 106.550
TERMS AND CONDITIONS APPLY
USE PROPER RISK MANAGEMENT

AUDUSDI have analyzed the AUDUSD market and noticed a significant increase due to recent news. The US dollar has weakened, causing the Australian dollar to rise in value, particularly in regards to gold. This is because the Australian dollar is closely linked to gold, and we can expect further growth. It's advisable to wait for a price correction to the support level before entering into a purchase deal. Good luck!

Navigating Market Dynamics: Anticipating Bullish Expansion Navigating Market Dynamics: Anticipating Bullish Expansion and Managing Risk
As anticipated last week, we witnessed a bullish expansion in DXY, aligning perfectly with our projections. Looking ahead to the coming week: #MarketAnalysis #BullishExpansion
We've closed above the midpoint of Ifvg, signaling a potential upward trend. DXY is poised to absorb buy side liquidity, potentially extending into the next week, with the aim of achieving a bullish expansion characterized by OLHC (Open Low High Close). #DXY #BullishOutlook
This strategy entails to take the previous week's low and seizing opportunities presented by a bullish fair gap to drive prices upward—a move we anticipate. #TradingStrategy #MarketForecast
It's crucial to recognize the importance of daily bullish order blocks, in harmony with the weekly fair value gap. #RiskManagement #TradingSignals
With significant events like NFP looming this week, it's prudent to exercise careful risk management. Anticipating a touch and subsequent upward momentum, we must remain vigilant. #NFP #MarketVolatility

EURUSD LONG SETUP - 2nd April 2024- I want to see a bullish session.
- Market profile bullish
- REHs at Asia’s high.
- Price broke below Asia’s low before London open.
