Bitcoin can Reverse Sharply After this CorrectionHello traders, I want share with you my opinion about Bitcoin. The market structure for Bitcoin has turned decidedly bearish in the short term, following a significant breakdown from its recent triangle consolidation pattern. This corrective phase began after a failed rally to a new all-time high near 126000, which led to a prolonged and volatile period of price action, including a sharp drop to 102000. Currently, following the resolution of the recent triangle to the downside, the price of BTC is in a clear downward movement. In my mind, this final decline is a capitulation move that is heading towards a major area of historical support. I expect that the price will fall into the main buyer zone. I think that a strong and confirmed reversal from this zone will signal that the entire corrective phase is complete and that buyers are ready to re-take control for the next major trend. This would present a significant long opportunity. Therefore, I have placed my TP for this reversal scenario at the 116000 level, targeting a key area of prior price action and a logical first objective for a new rally. Please share this idea with your friends and click Boost 🚀
Disclaimer: As part of ThinkMarkets’ Influencer Program, I am sponsored to share and publish their charts in my analysis.
LONG

AUDUSD Eyes 0.64500 Support as Bullish Structure Holds FirmHey Traders,
In today’s session, we’re closely monitoring AUDUSD for a potential buying opportunity around the 0.64500 zone. The pair continues to trade within a broader uptrend, and the current pullback appears to be a healthy correction toward a key support and resistance confluence near 0.64500.
A sustained reaction from this level could reaffirm the bullish structure, opening the door for a continuation toward recent highs if momentum aligns with a weaker USD backdrop.
Trade safe,
Joe.

XAUUSD Long: Path to 4280 After Successful RetestHello, traders! The price auction for XAUUSD has been in a powerful and sustained bullish phase, with the market structure being clearly defined by a major ascending trend line. This uptrend has demonstrated significant strength, breaking through multiple key resistance levels such as 3820 and 4055, confirming that buyers are in full control of the market.
Currently, the auction has entered an acceleration phase. The price has broken out above its long-term ascending trend line, a significant event that suggests the bullish momentum is increasing. The market is now in a clear expansion phase, trading in new high territory after leaving the prior structure behind.
My scenario for the development of events is a classic breakout and retest of this major trend line. I believe the price will make a corrective pullback to test the broken trend line from above, confirming it as new support. In my opinion, a successful bounce from this line would validate the acceleration and trigger the next impulsive wave higher. The take-profit is therefore set at 4280. Manage your risk!

Gold Eyes 4,200 as Pullback Near 4,070 Sets Stage for Next BreakHey Traders,
In today’s session, we’re monitoring XAUUSD for a buying opportunity around the 4,070 zone. Gold remains in a strong uptrend, and after setting a fresh all-time high, price is now pulling back toward key trend support.
This area has been acting as a critical demand zone, and a bullish reaction here could trigger the next leg higher — potentially toward the 4,200 mark.
With safe-haven demand still elevated and DXY under pressure, the broader context continues to favor further upside in Gold.
Trade safe,
Joe.

GBPUSD Will Go Up From Support! Long!
Please, check our technical outlook for GBPUSD.
Time Frame: 4h
Current Trend: Bullish
Sentiment: Oversold (based on 7-period RSI)
Forecast: Bullish
The market is trading around a solid horizontal structure 1.327.
The above observations make me that the market will inevitably achieve 1.334 level.
P.S
Overbought describes a period of time where there has been a significant and consistent upward move in price over a period of time without much pullback.
Like and subscribe and comment my ideas if you enjoy them!

USDCHF Sellers In Panic! BUY!
My dear friends,
My technical analysis for USDCHF is below:
The market is trading on 0.7991 pivot level.
Bias - Bullish
Technical Indicators: Both Super Trend & Pivot HL indicate a highly probable Bullish continuation.
Target - 0.8026
About Used Indicators:
A pivot point is a technical analysis indicator, or calculations, used to determine the overall trend of the market over different time frames.
Disclosure: I am part of Trade Nation's Influencer program and receive a monthly fee for using their TradingView charts in my analysis.
———————————
WISH YOU ALL LUCK

AUDCHF: Bullish Continuation & Long Trade
AUDCHF
- Classic bullish formation
- Our team expects growth
SUGGESTED TRADE:
Swing Trade
Buy AUDCHF
Entry Level - 0.5184
Sl - 0.5177
Tp - 0.5200
Our Risk - 1%
Start protection of your profits from lower levels
Disclosure: I am part of Trade Nation's Influencer program and receive a monthly fee for using their TradingView charts in my analysis.
❤️ Please, support our work with like & comment! ❤️

USDCHF Is Going Up! Long!
Please, check our technical outlook for USDCHF.
Time Frame: 9h
Current Trend: Bullish
Sentiment: Oversold (based on 7-period RSI)
Forecast: Bullish
The market is approaching a significant support area 0.800.
The underlined horizontal cluster clearly indicates a highly probable bullish movement with target 0.809 level.
P.S
Please, note that an oversold/overbought condition can last for a long time, and therefore being oversold/overbought doesn't mean a price rally will come soon, or at all.
Like and subscribe and comment my ideas if you enjoy them!

EURGBP Will Grow! Buy!
Here is our detailed technical review for EURGBP.
Time Frame: 1h
Current Trend: Bullish
Sentiment: Oversold (based on 7-period RSI)
Forecast: Bullish
The market is on a crucial zone of demand 0.870.
The oversold market condition in a combination with key structure gives us a relatively strong bullish signal with goal 0.871 level.
P.S
The term oversold refers to a condition where an asset has traded lower in price and has the potential for a price bounce.
Overbought refers to market scenarios where the instrument is traded considerably higher than its fair value. Overvaluation is caused by market sentiments when there is positive news.
Like and subscribe and comment my ideas if you enjoy them!

EUR/GBP - Multi time frame Analysis🔥 EUR/GBP — Fun but Deeper MTF Plan 🔥
Bias
Bullish across HTFs. Weekly + Daily demand stacked (0.8680–0.8700 riding on top of 0.8580–0.8620). Liquidity trendline above = magnet 🎯
Technical Breakdown
Weekly : Rising wedge grind, BOS history intact. As long as 0.8580 holds, topside liquidity at 0.8780–0.8800 is the draw.
Daily : Fresh reaction from 0.8680–0.8700 demand; higher-low structure pointing to 0.8750–0.8770 first stop.
1H : Sweep → MSS over 50EMA. Grey 1H POI 0.8690–0.8705 = sweet dip zone. If deeper, last defensive line is 0.8680 (daily base).
Execution (Scenarios)
A) Quick tag & go (primary):
Buy 0.8690–0.8705 → TP1 0.8745, TP2 0.8758, TP3 0.8775–0.8785 (liquidity sweep).
SL: 0.8672 (clean under daily base). R:R ≈ 1:2–1:3.
B) Deeper discount (secondary):
If we flush the POI, watch 0.8680–0.8688 for a wick + reclaim → same targets.
SL: 0.8665.
Risk Management
Risk 0.5–1% per idea. Scale out 30/40/30 at TP1/TP2/TP3.
If 1H closes below 0.8680, step aside—bull script broken short-term.
No chasing above 0.8750; wait for a pullback or a clean breakout-retest.
Trader Checklist ✅
HTF bias aligns? ✔️
Price into 1H POI or daily base? ✔️
M5/M15 shift back to bullish on entry? ✔️
Spread/news clean? ✔️
Then send it 🚀

BITCOIN – WAIT FOR ARBITRAGE TO BALANCE SPOT MARKETSTraders,
What a week it’s been. A lot of people got rekt, and I hope you were on the right side of the move. If not, it’s fine: this is how markets reset. I’ve been getting a lot of questions about what comes next, so here’s my current view.
The Situation
Binance/USDT wicked down to 102,000
Binance/USD wicked to 107,485.59
Coinbase/USD wicked to 107,000
That’s roughly a $5,000 difference, or about 5%, which is huge for major spot markets.
Under normal conditions, spreads between top venues like Coinbase and Binance are usually below 1% (Bitwise, 2019 SEC Study on Real Bitcoin Trading Volume - for the nerds interested ;)).
Why It Matters
Both Binance and Coinbase printed round-number lows (102k and 107k).
Round-number lows are considered “bad lows” because they attract clustered stop-loss orders and create obvious liquidity pools underneath.
Studies on market microstructure (e.g., Osler 2003; Kamps & Klein 2018) confirm that price clustering at round numbers is a real behavioral bias in FX and crypto markets.
Real market bottoms are messy, chaotic, and rarely form at clean, even levels.
These “perfect” lows often get revisited or swept later as the market clears liquidity and finds true balance.
How the Flush Works in Spot Markets
Even though spot markets don’t have leverage liquidations, they still experience stop cascades and panic selling.
When price breaks below a clean low, it triggers stops, sending a surge of sell orders into thin liquidity.
Market makers step in to absorb those orders and rebuild liquidity from a more stable base.
This is what traders call a spot flush — the market removing weak hands and resetting liquidity.
Conceptually, it’s the same as a liquidation flush in futures, just without forced margin calls.
What Arbitrage Does
Arbitrage keeps prices between exchanges in check.
When Bitcoin trades cheaper on Binance than on Coinbase, arbitrage traders buy on Binance and sell on Coinbase.
This pushes the cheap venue’s price up and the expensive one down until they align.
Makarov & Schoar (2020, NBER) showed that cross-exchange price deviations in Bitcoin are temporary and mean-reverting, driven by arbitrage capital restoring equilibrium.
Kaiko research (2021–2023) also found that USD and USDT pairs often decouple during stress events, especially when stablecoin liquidity or banking rails get disrupted, and later realign once volatility settles.
That’s exactly what we’re seeing now: a temporary dislocation that arbitrage will eventually close.
What I Expect
Binance already swept liquidity down to 102k.
Coinbase still has a clean 107k low that hasn’t been tested.
To rebalance both exchanges, I expect Coinbase to trade within 1% of the Binance 102k low, meaning roughly 103k–104k.
That would bring both markets back into alignment and complete a proper spot flush.
This isn’t a guaranteed move, but it’s a logical rebalancing target supported by historical arbitrage behavior.
What Could Happen Before That
We could still see Bitcoin move back toward 118k–120k before a potential drop.
After major liquidation events, markets often retrace sharply as liquidity rebuilds and shorts get squeezed.
A move higher doesn’t invalidate the idea of a later sweep; it could just be part of the natural reset phase before the market finds true equilibrium.
What I’m Watching
The spread between Coinbase/USD and Binance/USDT narrowing from around 5% to about 1%.
Coinbase breaking below 107k and testing the 104–102k zone.
A liquidity sweep followed by a strong reclaim and visible buy volume.
If we move up first, I’ll watch price behavior around 118k–120k for signs of exhaustion.
My Plan (Not Financial Advice)
I’m staying patient and letting the market mechanics reset.
If Coinbase trades into the 103k–102k zone, that’s my “let’s see what’s going on now” trigger.
That doesn’t mean I’ll instantly go long — it means I’ll start watching the data:
Volume and delta (are buyers stepping in?)
Strength of reclaim (is the recovery fast and decisive?)
Order book depth (is liquidity returning?)
What is Open Interest doing?
Do we see absorption? Or maybe a continuation pattern even?
Only if those metrics confirm strength will I consider entering.If not, I’ll stay flat and wait for the next confirmation.
So, TLDR;
Both Binance and Coinbase printed clean, round-number lows that are likely to be swept again. Arbitrage will eventually bring the spot markets back into balance, which should pull Coinbase closer to Binance’s 102k low. We might even see a push toward 120k first as liquidity resets. Either way, patience is key: let arbitrage, liquidity, and order flow do their job before taking any position.
And remember: Patience in trading isn’t about doing nothing, it’s about waiting for the odds to align in your favor. Chasing every move might feed the ego, but patience compounds the account. The market always rewards the trader who can sit still when everyone else is reacting.
Trade safe!

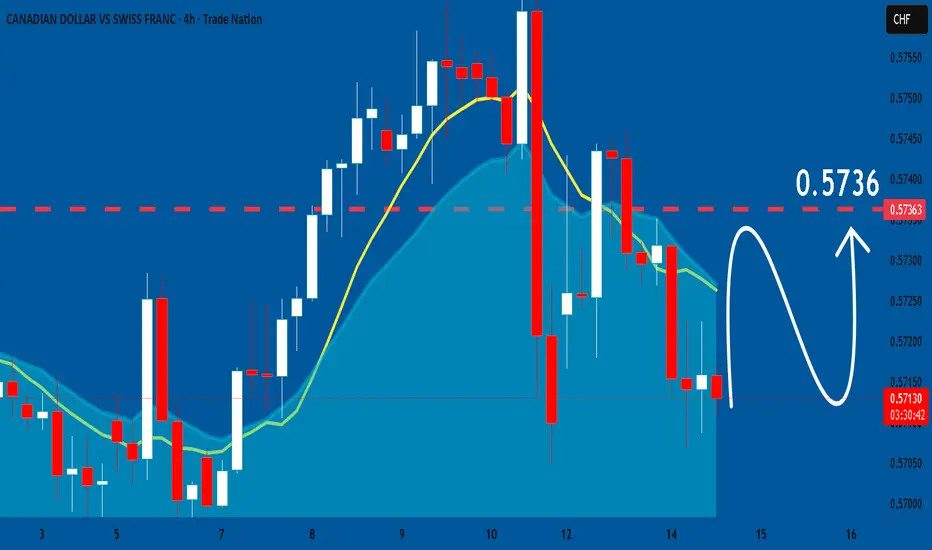
CADCHF: Growth & Bullish Forecast
Remember that we can not, and should not impose our will on the market but rather listen to its whims and make profit by following it. And thus shall be done today on the CADCHF pair which is likely to be pushed up by the bulls so we will buy!
Disclosure: I am part of Trade Nation's Influencer program and receive a monthly fee for using their TradingView charts in my analysis.
❤️ Please, support our work with like & comment! ❤️
GOLD Will Move Higher! Buy!
Please, check our technical outlook for GOLD.
Time Frame: 8h
Current Trend: Bullish
Sentiment: Oversold (based on 7-period RSI)
Forecast: Bullish
The market is approaching a significant support area 4,069.35.
The underlined horizontal cluster clearly indicates a highly probable bullish movement with target 4,202.88 level.
P.S
We determine oversold/overbought condition with RSI indicator.
When it drops below 30 - the market is considered to be oversold.
When it bounces above 70 - the market is considered to be overbought.
Like and subscribe and comment my ideas if you enjoy them!

AUD/CHF BULLS WILL DOMINATE THE MARKET|LONG
AUD/CHF SIGNAL
Trade Direction: long
Entry Level: 0.518
Target Level: 0.524
Stop Loss: 0.514
RISK PROFILE
Risk level: medium
Suggested risk: 1%
Timeframe: 4h
Disclosure: I am part of Trade Nation's Influencer program and receive a monthly fee for using their TradingView charts in my analysis.
✅LIKE AND COMMENT MY IDEAS✅

GBPJPY Will Go Up! Long!
Take a look at our analysis for GBPJPY.
Time Frame: 1h
Current Trend: Bullish
Sentiment: Oversold (based on 7-period RSI)
Forecast: Bullish
The market is approaching a key horizontal level 201.854.
Considering the today's price action, probabilities will be high to see a movement to 202.612.
P.S
The term oversold refers to a condition where an asset has traded lower in price and has the potential for a price bounce.
Overbought refers to market scenarios where the instrument is traded considerably higher than its fair value. Overvaluation is caused by market sentiments when there is positive news.
Like and subscribe and comment my ideas if you enjoy them!

BTCUSD: Price can Rebound Up from Support line of PennantHello everyone, here is my breakdown of the current Bitcoin setup.
Market Analysis
Bitcoin has been through an incredibly volatile cycle. After reversing from a major low near the 109400 Support, we saw a powerful rally that led to a new ATH around 126000. Since that peak, the market has been in a deep and complex corrective phase.
Currently, this correction has taken the shape of a large pennant or wedge pattern. The price is consolidating and coiling within this structure. After a recent test of the upper boundary, the price is now pulling back towards the ascending support line for what I see as a critical test.
My Scenario & Strategy
I view the current pullback to the support line as a healthy correction and a logical place for buyers to show interest and defend the structure. A confirmed and strong bounce from this dynamic support would be the key signal for me that the pullback is over and the market is ready to challenge the highs again.
Therefore, the strategy is to watch for this bounce. A successful rebound is expected to lead to a rally that will break the intermediate Resistance at 117300. The primary target for the subsequent move is 118600, which aligns with the resistance line of the pennant.
That's the setup I'm tracking. Thank you for your attention, and always manage your risk.

AUDNZD Technical Analysis! BUY!
My dear friends,
Please, find my technical outlook for AUDNZD below:
The price is coiling around a solid key level - 1.1328
Bias -Bullish
Technical Indicators: Pivot Points Low anticipates a potential price reversal.
Super trend shows a clear buy, giving a perfect indicators' convergence.
Goal - 1.1361
Safe Stop Loss - 1.1311
About Used Indicators:
The pivot point itself is simply the average of the high, low and closing prices from the previous trading day.
Disclosure: I am part of Trade Nation's Influencer program and receive a monthly fee for using their TradingView charts in my analysis.
———————————
WISH YOU ALL LUCK

USOIL LONG FROM SUPPORT
USOIL SIGNAL
Trade Direction: long
Entry Level: 58.07
Target Level: 63.04
Stop Loss: 54.76
RISK PROFILE
Risk level: medium
Suggested risk: 1%
Timeframe: 9h
Disclosure: I am part of Trade Nation's Influencer program and receive a monthly fee for using their TradingView charts in my analysis.
✅LIKE AND COMMENT MY IDEAS✅

GBPCAD Is Going Up! Buy!
Please, check our technical outlook for GBPCAD.
Time Frame: 1h
Current Trend: Bullish
Sentiment: Oversold (based on 7-period RSI)
Forecast: Bullish
The market is trading around a solid horizontal structure 1.867.
The above observations make me that the market will inevitably achieve 1.872 level.
P.S
The term oversold refers to a condition where an asset has traded lower in price and has the potential for a price bounce.
Overbought refers to market scenarios where the instrument is traded considerably higher than its fair value. Overvaluation is caused by market sentiments when there is positive news.
Like and subscribe and comment my ideas if you enjoy them!

EURUSD On The Rise! BUY!
My dear friends,
My technical analysis for EURUSD is below:
The market is trading on 1.1559 pivot level.
Bias - Bullish
Technical Indicators: Both Super Trend & Pivot HL indicate a highly probable Bullish continuation.
Target - 1.1580
Recommended Stop Loss - 1.1547
About Used Indicators:
A pivot point is a technical analysis indicator, or calculations, used to determine the overall trend of the market over different time frames.
Disclosure: I am part of Trade Nation's Influencer program and receive a monthly fee for using their TradingView charts in my analysis.
———————————
WISH YOU ALL LUCK

NZDJPY Expected Growth! BUY!
My dear followers,
This is my opinion on the NZDJPY next move:
The asset is approaching an important pivot point 86.487
Bias - Bullish
Technical Indicators: Supper Trend generates a clear long signal while Pivot Point HL is currently determining the overall Bullish trend of the market.
Goal - 87.374
About Used Indicators:
For more efficient signals, super-trend is used in combination with other indicators like Pivot Points.
Disclosure: I am part of Trade Nation's Influencer program and receive a monthly fee for using their TradingView charts in my analysis.
———————————
WISH YOU ALL LUCK

NZDJPY Will Go Higher! Buy!
Here is our detailed technical review for NZDJPY.
Time Frame: 2h
Current Trend: Bullish
Sentiment: Oversold (based on 7-period RSI)
Forecast: Bullish
The market is testing a major horizontal structure 86.456.
Taking into consideration the structure & trend analysis, I believe that the market will reach 87.323 level soon.
P.S
Please, note that an oversold/overbought condition can last for a long time, and therefore being oversold/overbought doesn't mean a price rally will come soon, or at all.
Like and subscribe and comment my ideas if you enjoy them!

EURCHF: Bullish Continuation is Highly Probable! Here is Why:
Balance of buyers and sellers on the EURCHF pair, that is best felt when all the timeframes are analyzed properly is shifting in favor of the buyers, therefore is it only natural that we go long on the pair.
Disclosure: I am part of Trade Nation's Influencer program and receive a monthly fee for using their TradingView charts in my analysis.
❤️ Please, support our work with like & comment! ❤️
