30% Bitcoin correction to circa $72kOn the above 2 day chart price action has printed 100% gain since September. A number of reasons now exist for a bearish outlook in the near term. They include:
1) Price action failed support.
2) RSI and MFI failed support.
3) Strong bearish divergence with price action. 10 oscillators price negative divergence with price action at this time.
4) The $72k forecast is the 50% Fibonacci level.
5) What will happen to overbought alt tokens? Nothing good.
Is it possible price action continues to print higher highs like most Youtube shills are calling for? Sure.
Is it probable? No.
Ww
Oscillators

Sentiment Cycle Indicator (PAID)Take a look at how the Sentiment Cycle Indicator is performing on the BTC 15-minute chart. As expected during the weekend (Saturday and Sunday), BTC experienced lower volume. Despite this, the indicator managed to capture some key moves beautifully, even in the challenging sideways market.
In a sideways market, identifying the right direction is often difficult, but the Sentiment Cycle Indicator excelled at pinpointing those moves. When you compare the generated signals with the volume at the bottom of the chart, you’ll notice how accurately it captured those moments.
For instance, the most recent sell signal was generated at 97,094, and BTC hit a low of 95,685, resulting in a 1,400+ point move. Following that, the signal shifted to a buy signal, which has already been confirmed. Additionally, the neutral background color on the chart (white, in my case) effectively highlights periods of sideways movement, reinforcing the indicator’s capability to detect such market conditions.
This demonstrates the true power of the Sentiment Cycle Indicator. It not only provides reliable buy and sell signals but also helps identify sideways markets with ease. It’s a robust tool for navigating different market conditions with confidence.

Divergence Trading Explained For Beginners -DAX Pullback TradeTrading divergence in the Forex or Stock market can be an important tool. Learn how to identify divergences & practically apply them to your technical analysis to increase your edge & profits in the financial markets.
In this video you'll learn
What is a bullish and bearish divergence
How to use divergence to spot potential reversals in the market
How to use volume to identify key levels of reversals
How to measure out a "Kill Zone"
What are tweezer tops & tweezer bottoms & why they are important
How to use the Fibonacci retracement tool
How to use the Relative Strength Index (RSI Indicator)
Your Trading Coach - Akil

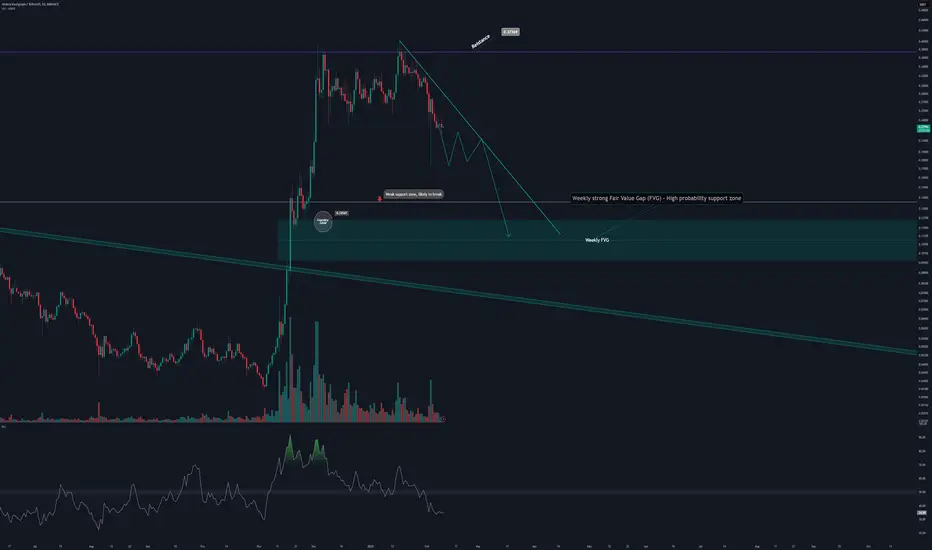
HBARUSDT Approaching Key Weekly Zone with Potential Reversal SetBINANCE:HBARUSDT HBARUSDT is approaching a weak support zone, which shows a higher probability of breaking due to insufficient strength. Below this lies a weekly strong Fair Value Gap (FVG), which is a critical level for potential price reversal and continuation of the bullish trend.
If the price enters this weekly FVG zone, it could signal a high-probability buying opportunity for traders anticipating a rebound. On the other hand, failure to hold this zone could lead to further downside.
Keep an eye on price action near the key levels for confirmation of potential entries. Always ensure to have clear stop-loss levels and realistic profit targets in place.
Best regards,
Happy trading!
170% rally for Koma INU ??Requested TA, more than once.
On the above daily chart price action has dropped over 80% since early December. A number of reasons now exist for a long position, they include:
1) Price action and RSI resistance breakouts.
2) Volume, a lot of new volume. See MFI breakout.
3) Reversal / hammer candle.
4) Resistances as shown, first 170% above. After that, blue sky.
Is it possible for price action to correct further? Sure.
Is it probable? No.
Ww
Type: trade
Risk: high, tiny market cap
Timeframe for long: sooner than you think
Forecast: 170%

Current bitcoin bullflag has a target of 144kBeen consolidating inside this one for some time now and its been creating a lot of uncertainty in the market lately as most people have been distracted by the bearish h&s pattern on the Daly chart and haven’t zoomed out to the higher time frames to realize this whole time we’ve ust been consolidating inside this bullflag. The stochrsi has already been reset for awhile on the Daly time frame and is about to be fully reset here on the weekly time frame too sugget we will resume the uptrend in the near future. *not financial advice*

Google Gapping Down. GOOGLWhen gaps occur in an overstretched market in the opposite direction to the trend, these tend to become areas of resistance and do not get filled. Here, the price action prior to the gap flipped the VZO, BB %pct and Ehlers StochRSI. Adding fuel to the fire, vWAP and US are in tandem acting like resistances to downward price action.

Bullish on the Euro Dollar. USDEURSwitching to FOREX, momentum and volatility reversal is evident on this pair technically. There is a confirmation by MIDAS line cross ~ actually a triple cross of MIDAS, vWAP and US lines by that engulfing bullish candle. If this is not a switch of modality then its a whipsaw.

Reversal on Mondelez Looking Favorable. MDLZA clear Elliott 5 wave impulse down is complete, along with classical divergences on the momentum indicator. Willing to bet that this is a reversal with MIDAS line cross and US/vWAP acting as resistance in synchronicity. Interestingly, there's a double harmonic that formed in the more long term aspect - a deep Bat and a butterfly within deep bat. VZO and Ehlers Stoch/RSI are divergent, so disregarding the readings in this instance.

Resilient Silver: Charting a Bullish Path ForwardCurrently hovering just above the intersection of minor horizontal and uptrend support, with momentum indicators such as RSI (14) and MACD continuing to generate bullish signals, a potential long setup is emerging in silver.
Bulls could consider establishing longs above $31.75, with a tight stop beneath this level or the minor uptrend established on January 27. Potential targets include the February 7 high of $32.65 and $33.10.
Although the evening star pattern completed last week signalled downside risks, they failed to materialise on Friday despite tricky market conditions triggered by the US payrolls report and escalating trade tensions. Even with higher US bond yields and a stronger dollar, silver remained resilient, reinforcing the merits of the setup being considered.
Good luck!
DS

Head and shoulders with open gapThis is not a good look. Just putting it nice. I see a gap full coming up.

KASPA accumulation from ETH strategy, continued..I was waiting to sell about 25 more ETH to accumulate ~1 million Kaspa if KAS/ETH hits ~0.000025 or lower; base on the orange measured move drawn and circled (at the bottom thick yellow support line).
However, it appears a bullish is starting to form on the FG{50/15} histogram, and the previous daily candle on the 7Feb2025 engulfs the previous red candle on the 6Feb2025.
If KAS/ETH is able to break above the golden pocket (dashed horizontal thick yellow line), and then subsequently breaks above the top of the narrowing wedge (defined by thin white lines), then it is likely for KAS to continue above the 50 Fib retrace level and to the top of the thick yellow long-term resistance level.
Note: Here the Fib levels were redrawn, as comparted to my earlier published analysis.
If KAS/ETH breaks below the golden pocket at the 65% retrace lvl, then opportunity to accumulate KAS from ETH at or below 0.000025 ETH per KAS will then become likely.

Shorting BlackRock Back to Stone Age. BLKEllioticians will have fun with this one, because this is a debatable chart wave-wise. Now what else is going on here technically? Volumes, volatility stochastics and momentum are downgoing. Bollinger Bands are no doubt showing something bearish undergoing as well. US/vWAP cross and resting above candles as well. This is a constellation that can't be not taken seriously.

Sentiment Cycle Indicator (PAID)The Sentiment Cycle Indicator has been performing beautifully, as demonstrated on the BTC chart. Here’s how it works and why it’s such a powerful tool for traders:
• The green background indicates a buy signal, while the red background signifies a sell signal. These signals are designed to identify key momentum shifts in the market.
• Not only does it generate buy and sell signals, but it also highlights sideways markets—marked by the absence of a background color. This helps traders know when not to trade, avoiding unnecessary risk.
Key Features:
• Momentum Detection: The indicator successfully captures momentum from tops and bottoms, as seen in the BTC chart. Significant moves were identified with precision.
• Sideways Market Filtering: During sideways movements, when the sentiment is unclear, the indicator provides no background color, ensuring you avoid low-probability trades.
• Customization: The settings are fully customizable, allowing you to adjust the indicator to focus on stronger trends or cover more sideways zones for sure-shot entries.
• Beginner-Friendly: The straightforward design makes it easy to interpret. Even beginners can trade confidently with clear buy/sell signals and background colors.
Currently, BTC has been moving sideways for the last 45 minutes, as indicated by the lack of background color. The next signal could be a buy or sell, but the indicator is well-equipped to capture the move.
This is the power of the Sentiment Cycle Indicator —simple, effective, and highly adaptable for all market conditions.
Thank you for your time! If you’d like to know more about this indicator or need assistance, feel free to message me. 🚀

Bank of America Wave Analysis – 7 February 2025
- Bank of America reversed from resistance level 47.80
- Likely to fall to support level 46.00
Bank of America recently reversed down from the resistance zone located between the major resistance level 47.80 (which also stopped the earlier minor impulse wave 1 at the end of last year) and the upper weekly Bollinger Band.
The previous downward reversal from the resistance level 47.80 created the daily Japanese candlesticks reversal pattern Evening Star.
Given the strength of the resistance level 47.80 and the bearish divergence on the daily RSI, Bank of America can be expected to fall to the next support level 46.00.

Amazon Wave Analysis – 7 February 2025
- Amazon reversed from the resistance area
- Likely to fall to support level 226.60
Amazon recently reversed down with the downward gap from the resistance area between the pivotal resistance level 240.00 (which has stopped the previous waves iii and i), the resistance trendline of the daily up channel from August and the upper daily Bollinger Band.
The downward reversal from the resistance area started the active short-term correction ii.
Given the strength of the resistance area near the resistance level 240.00 and the overbought daily Stochastic, Amazon can be expected to fall to the next support level 226.60.

Dow Jones Wave Analysis – 7 February 2025
- Dow Jones reversed from the resistance level 45000.00
- Likely to fall to support level 44000.00
Dow Jones index recently reversed down from the strong resistance level 45000.00 (which has been reversing the price from November) coinciding with the upper daily Bollinger Band
The downward reversal from the resistance level 45000.00 created the daily Japanese candlesticks reversal pattern Dark Cloud Cover after the index created Bearish Engulfing at the end of January.
Given the strength of the resistance level 45000.00 and the overbought daily Stochastic, Dow Jones index can be expected to fall to the next support level 44000.00 (low of the previous correction (2)).

GBPUSD BULLISH CRABHarmonic Pattern Trading Strategy:
1. Combine patterns with 2-3 confirmations (e.g., MA, BB, RSI, Stoch) for increased accuracy.
2. Implement proper risk management.
3. Limit exposure to 3% of capital per trade.
4. Exercise caution: Not every Harmonic Pattern presents a good trading opportunity.
5. Conduct thorough diligence and analysis before trading.
Disciplined approach = Enhanced edge.


TGT SellTGT Sell on Daily/2hr combo. Trend line pointing us to a sell, also our indicator is showing us a good entry opportunity for a Nice R/R.


META & COST are overboughtMETA & COST are overbought. With a RSI by 80 and trading above it's outer ATR band of 3x standard deviations. Once momentum fizzles out, gravity will bring META & COST back down to SMA20. So here's a straightforward trading idea.
META levels:
ATR 23
SMA 20 = 653
SMA50 = 623
SMA100 = 598
SMA200 = 545
COST levels:
ATR 20
SMA 20 = 965
SMA50 = 963
SMA100 = 932
SMA200 = 882
META short trade idea:
short 715
stop 725
profit 655
COST short trade idea:
short 1060
stop 1070
profit 965
META options data:
2/21 expiry
Put Volume Total 20,489
Call Volume Total 25,697
Put/Call Volume Ratio 0.80
Put Open Interest Total 105,207
Call Open Interest Total 131,858
Put/Call Open Interest Ratio 0.80
3/21 expiry
Put Volume Total 8,533
Call Volume Total 19,062
Put/Call Volume Ratio 0.45
Put Open Interest Total 101,527
Call Open Interest Total 110,511
Put/Call Open Interest Ratio 0.92
4/17 expiry
Put Volume Total 4,053
Call Volume Total 5,625
Put/Call Volume Ratio 0.72
Put Open Interest Total 32,737
Call Open Interest Total 53,495
Put/Call Open Interest Ratio 0.61
COST options data:
2/21 expiry
Put Volume Total 4,458
Call Volume Total 5,217
Put/Call Volume Ratio 0.85
Put Open Interest Total 11,521
Call Open Interest Total 12,621
Put/Call Open Interest Ratio 0.91
3/21 expiry
Put Volume Total 3,210
Call Volume Total 3,064
Put/Call Volume Ratio 1.05
Put Open Interest Total 25,964
Call Open Interest Total 22,294
Put/Call Open Interest Ratio 1.16
4/17 expiry
Put Volume Total 592
Call Volume Total 1,388
Put/Call Volume Ratio 0.43
Put Open Interest Total 10,602
Call Open Interest Total 8,988
Put/Call Open Interest Ratio 1.18

EURUSD Technical Forecast on NFP 07.02.2025Overall Trend & Context:
The EURUSD pair is in an overall downtrend on the higher time frames and has recently been consolidating on the lower times.
Fundamental Considerations for the NFP:
Consensus Forecast (High Probability) - Most analysts forecast a gain in the 169K–170K range, which lines up with recent trends. A neutral result would suggest that the labor market is still solid.
Stronger-than-Expected Outcome (Medium Probability) - If the report comes in well above consensus (eg: above 190K jobs), it could reinforce expectations for a more hawkish stance by the Federal Reserve.
Weaker-than-Expected Outcome (Low Probability) - A result below expectations (eg: fewer than 135K jobs) might trigger a reassessment of the US economic outlook, we will need to watch the markets and prepare for dynamic shifts.
Technical Findings:
Weekly - Bearish and trading well below EMA's.
Daily - Bearish & showing signs of 25 EMA rejection. Previous distribution is holding price at bay.
4 Hour - Strong supply levels holding and trading below the 200 EMA.
1 Hour - Close to overbought levels and LTF distribution is holding.
Important Notes:
DXY is at a previous demand which proved to be a challenge to break through in the past.
GBPUSD & EURUSD can have variations in the short term correlation but the technicals both align, which reinforces our EURUSD narrative.
USDJPY technicals remain bullish on the long term however, the short term is in a downtrend and has reached a daily demand - we could potentially see a bullish reaction from here (based on DXY strength and the negative correlation with EURUSD)
Potential Scenarios & Probabilities:
If the lows at 1.03800 fail we may need to adjust our entry zones based on where liquidity and supply are found.
If price reaches the weaker supply level closer to the release of the NFP we can enter, however there is a chance we could get stuck in some drawdown if supply isn't strong enough to push through.
HIGH PROFILE NEWS RELEASES ARE DOUBLE EDGED IF YOU'RE NOT CAREFUL. YOU DO NOT NEED TO BASE YOUR ENTIRE TRADING CAREER ON IT. STAY OUT IF YOU'RE NOT COMFORTABLE TRADING NEWS.
AS TRADERS, YOUR PRIMARY JOB IS TO PROTECT YOUR CAPITAL - WITHOUT CAPITAL YOU CAN'T MAKE ANY MOVES.
Trade smart.
Hope you all make money if you're trading today!
Apex out!
OANDA:EURUSD FX:EURUSD FOREXCOM:EURUSD OANDA:USDJPY TVC:DXY OANDA:GBPUSD PEPPERSTONE:GBPUSD FX:USDJPY
