XRP could be going to $5 if we gain and hold $1.70!Hello!
XRP has tested this monthly/yearly level before. Last time it rejected as it was the first test of major resistance. Now a couple years later we are testing $1.70 again. If we gain this level and hold, I see XRP blowing through all time highs. My yearly and monthly projections have price going to $5. Not saying it will do that, but I think there is high likely it will if we hold $1.70. I am not long as I haven't traded crypto in a couple years. I normally would never long a crypto that is up as much as XRP the past month, but the chart is looking prime for higher if we hold here on the monthly and possibly the yearly. I will update on the close of the yearly in a month.
Community ideas

$SOL back to $79 to $111If you look at the chart, you can see that every time we've touched the blue trend line, price has bounced off of it and gone higher.
If price bounces here and forms a lower low, then I think the setup is there to finally break the trend line to the downside and head lower.
If price breaks below that trend line , then I think the structure of the chart turns bearish and that price falls into the box on the chart between $79-111.
Let's see how it plays out over the coming weeks.

$BTC - Sunday Market Outlook🔸
Bitcoin remains in a sideways range ( GETTEX:89K -$110K) before a potential breakout toward $140K by the end of 2025. Whales and institutions are accumulating, while retail traders remain distracted.
🔸 Key Support Zone at GETTEX:89K - GETTEX:92K
Market has provided seven long opportunities in this range.
Whales are accumulating, while retail traders are panic-selling.
🔸 Upside Target: $140K
OTC supply is drying up, with only 140,000 BTC left in January.
ETFs bought 50,000 BTC in January alone, indicating strong accumulation.
Once OTC supply depletes, a FOMO-driven rally could push BTC to new highs.
🔸 Risk Level at $85K
Short-term volatility possible due to market makers creating FUD.
Major support at $85K, any breakdown below could delay the next leg up.
🔸 Action Plan:
✅ Open long positions in the GETTEX:89K - GETTEX:92K range.
✅ Buy dips like Monday’s crash to strengthen positions.
✅ Maintain long positions
✅ Stay bullish despite market noise—smart money is accumulating.
🚨The next leg up is loading. Patience & strategy will define the winners!

TradeCityPro | Bitcoin Daily Analysis #1👋 Welcome to TradeCityPro!
This is the first analysis in the Bitcoin series on the channel, which will be uploaded daily. In this series, we will analyze futures triggers that can provide us with positions on the same day. Therefore, most of the analyses will be conducted in lower timeframes.
✨ However, in today’s analysis, I will also cover Bitcoin in higher timeframes since this is the first analysis and needs to be comprehensive.
📅 Weekly Timeframe
In the weekly timeframe, we see a strong uptrend where the last leg started from the 54,900 bottom and moved up to the 104,700 resistance. The candle volume has been mostly bullish, aligning with the uptrend.
🔍 Currently, the price is resting below the 104,700 resistance, and the last weekly candle, which closed just yesterday, resembles a rolling pin, indicating indecision among buyers and sellers as the price moved both up and down but ultimately closed in a range.
💥 In RSI, there are two crucial support levels. The first is at 61.85, which RSI is currently near, and if it reacts positively to this level, a new bullish momentum could enter the market. The next support is at 43.90, a critical level for market momentum. As long as RSI stays above this level, bullish momentum remains in the market.
🔼 For the next bullish leg to start, RSI likely needs to enter the overbought zone, attracting more buyers and initiating the next wave. In terms of price action, breaking the 104,700 resistance would be the best trigger for the next move.
⚡️ On the other hand, the price has so far corrected to the 0.236 Fibonacci level near 90,000 and still has the potential for further corrections. If it continues, the next support levels are at the 0.382 and 0.618 Fibonacci zones, which overlap with 81,800 and 70,000, respectively.
📣 Since this series will have daily updates and we will analyze the weekly timeframe after each weekly candle closes, I won’t discuss lower supports or higher resistances until the time is right.
📅 Daily Timeframe
In the daily timeframe, the price is ranging between 91,925 and 106,612. As seen, the price has been rejected from the range high for the second time and has dropped to 96,312.
🧩 Bearish momentum has been decreasing since reaching the 96,312 support, and a rounding formation is gradually forming. A positive aspect is that if Bitcoin establishes a bottom in this zone and moves toward the range high again, it will create a higher low compared to the 91,925 support, increasing the chances of a breakout to the upside.
📊 The volume of the last red candles in the bearish leg has been quite low. In the two recent green candles from yesterday and today, the volume is also very low, meaning the price might soon start its movement. So, it’s best to move to lower timeframes to find a suitable futures trigger.
⌛️ 4-Hour Timeframe
In this timeframe, I won’t analyze much but will instead focus on identifying futures triggers.
🔽 For a short position, the setup is quite clear. There is a solid trigger at 95,798, which the price has tested multiple times, making it a reliable trigger. Since this short position is being opened within the range and near the range low, it should be taken quickly and secured at low risk-to-reward ratios like 2 or 3. It is not an ideal trigger for a long-term trade.
📈 For a long position, the first trigger was the breakout of 97,304, which has already happened, and the price has confirmed above this level. If you haven’t taken a position on this breakout, you can enter on a pullback if a suitable candle forms or if there’s a trigger in lower timeframes. Keep in mind that this trigger is the riskiest, so enter with minimal risk.
✔️ The next long trigger is at 98,937, which is more reliable. If the price stabilizes above this level, we can expect a bullish leg toward the range high.
⌛️ 1-Hour Timeframe
In this timeframe, as seen, the price is pulling back to the 97,304 level while engulfing the previous red candles. RSI is also stabilizing above 64.12. If the candle closes as it is, a long position will be suitable. The key resistance level is at 99,730.
📉 For a short position, the trigger remains similar to the 4-hour timeframe. However, since the price has faked this level in this timeframe, we should wait for another reaction at this area to confirm the actual trigger point.
⭐️ Now, let's analyze the dominance charts. A full dominance analysis will be provided separately. The Total2 analysis will be posted tonight, and the USDT.D and BTC.D analyses will be done tomorrow, but for now, they will be reviewed in the 1-hour timeframe.
⌛️ BTC.D Analysis
In the 1-hour timeframe, we see Bitcoin dominance increasing after reaching the 61.34 bottom, which has contributed to Bitcoin’s recovery following the fake breakdown at 95,798.
👑 If dominance stabilizes above 62%, more money will flow into Bitcoin. In this scenario, if the market moves upward, Bitcoin will rise more than most altcoins, and if the market drops, Bitcoin will decline less than others. The main resistance is at 62.66.
💫 On the other hand, if dominance falls below 61.34, less money will enter Bitcoin. In a bullish market, Bitcoin will underperform altcoins, and in a bearish market, Bitcoin will drop more significantly.
⌛️ Total2 Analysis
In the 1-hour timeframe, the 1.22 level in Total2 overlaps with 97,304 in Bitcoin. However, as seen, Total2 is still below this support and hasn’t confirmed above it yet. The reason is the increasing Bitcoin dominance, causing altcoins to move less than Bitcoin.
☀️ The main resistance in Total2 at this timeframe is 1.28, which is also the key long trigger.
🔽 For a short position, Total2 offers a better trigger than Bitcoin. If Total2 breaks below 1.16 while Bitcoin dominance increases, shorting altcoins will be a better option than Bitcoin.
⌛️ USDT.D Analysis
As seen, the candle has closed below the 4.51 support in this index, and it has more overlap with Bitcoin than Total2.
✔️ The trigger for an increase in USDT dominance is 4.64, which would lead to a market decline. The alignment of this trigger with the short triggers in Total2 and Bitcoin could provide strong confirmation for those trades.
🔑 For a long position, breaking below the 4.40 support in this index would be a good signal. The main support is currently at 4.22, and if this level is broken, the market could begin its next bullish leg.
📝 Final Thoughts
This analysis reflects our opinions and is not financial advice.
Share your thoughts in the comments, and don’t forget to share this analysis with your friends! ❤️

XRP's downfall in order!BINANCE:XRPUSDT
Ripple's gonna decrease cause of the head and shoulder pattern.
The pattern's has not been completed yet! after the break out happens,the price shall reach the next support which is around 1.3990!
⚠️ Disclaimer:
This is not financial advice. Always manage your risks and trade responsibly.
👉 Follow me for daily updates,
💬 Comment and like to share your thoughts,
📌 And check the link in my bio for even more resources!
Let’s navigate the markets together—join the journey today! 💹✨

Zomato: A downside Wave 3 confirmation below 224 See my previous posts, in hourly time frame, if price enter 224-223 territory, then probably a downside wave 3 confirms. If this happens a sharp fall can be seen.

T USDT Simple AnalyisisBuying Condition-- If Weekly Candle closes above 0.015
Stoploss Condition-- If Weekly Candles closes below 0.015
Just Very Simple Myth
Targets are shown in the graph with Red lines TP-01 and TP-02

[02/10] SPX – GEX Until the First Weekly ExpirationThe SPX opened with a huge gap-down in both the futures and CFD markets. After the previous two Fridays, there was a massive gap-down in the premarket each time. Everyone was expecting the same scenario again, but it seems the market quickly recovered from the put support at the 6000 level, and we are now steadily moving toward the positive GEX range.
Although we are still in the transition zone (where it’s easy to switch between positive and negative GEX territory), we may soon reach the HVL level at 6060, which, if I had to guess, might be adjusted during today’s premarket update.
The GEX levels align with the technical foundations:
🟢 6090–6100 to the upside is a bullish take-profit zone, and our purely positive GEX range is fairly narrow. If buying pressure is strong, above 6100 we could see a very strong positive gamma squeeze upward.
🔴 To the downside, “armageddon” could begin if the put support around 6010–6000, which held the sell-off this morning, fails to hold. The next target in a negative gamma squeeze could be 5950, followed by 5900.
The transition range is quite wide, and the market is expecting a volatile week (though I believe that from now on it’ll expect volatility every day for the next four years...).
The transition zone is sure to narrow by Friday. It’s worth paying attention to the premarket update around 6:45 AM, about three hours before the market opens!
If the red zone extends very deep afterward (for example, if it’s red below the HVL level all the way to the put support at around 5950), it indicates a significant downside risk compared to any potential rally—which I don’t think will change unless we get a breakout above 6100.
🔶 So, be cautious with those bullish horns—below 6100, we can’t talk about a confirmed breakout to the upside.

Strong Downtrend in EURJPY—Here’s My Trade Plan!In this video, we take a quick look at the EURJPY currency pair, which is currently in a strong downtrend. On the four-hour timeframe, we can clearly see lower highs and lower lows. However, price has now reached a key support zone on the weekly and daily timeframes. While my bias remains bearish, I’ll be watching for a retracement toward previous swing highs for a potential entry, as the pair is trading into a significant liquidity pool and is likely to react at this level. This is not financial advice.

$TRUMP: if you have not sold yet, you are late.$TRUMP won’t last forever—mark my words.
Of course, things could change if someone injects billions to prop it up, but that seems unlikely. Here’s a quick reality check:
- Trump is a politician, not your buddy.
- "Make America Great Again" really means "Make the U.S. Dollar Great Again"—don’t get fooled.
- Vampires crave blood, and politicians crave money—you’re not on their team.
They’ll rug you with a smile, and you’ll still come back for more. Why? Because deep down, you want to believe you're not like them, right?
Take your profits and invest in meaningful projects—ones that pay people, drive research and development, and build the future of this incredible industry. Don’t waste your energy on hype.

GBP/JPY "The Guppy" Forex Market Bullish Heist Plan🌟Hi! Hola! Ola! Bonjour! Hallo!🌟
Dear Money Makers & Thieves, 🤑 💰🐱👤
Based on 🔥Thief Trading style technical and fundamental analysis🔥, here is our master plan to heist the GBP/JPY "The Guppy" Forex market. Please adhere to the strategy I've outlined in the chart, which emphasizes long entry. Our aim is the high-risk Red Zone. Risky level, overbought market, consolidation, trend reversal, trap at the level where traders and bearish robbers are stronger. 🏆💸Be wealthy and safe trade.💪🏆🎉
Entry 📈 : "The heist is on! Wait for the breakout (193.400) then make your move - Bullish profits await!"
however I advise placing Buy limit orders within a 15 or 30 minute timeframe. Entry from the most recent or closest low or high level should be in retest.
Stop Loss 🛑: Thief SL placed at 191.600 (swing Trade) Using the 2H period, the recent / nearest low level.
SL is based on your risk of the trade, lot size and how many multiple orders you have to take.
Target 🎯: 199.000 (or) Escape Before the Target
Scalpers, take note 👀 : only scalp on the Long side. If you have a lot of money, you can go straight away; if not, you can join swing traders and carry out the robbery plan. Use trailing SL to safeguard your money 💰.
📰🗞️Fundamental, Macro, COT, Sentimental Outlook:
GBP/JPY "The Guppy" Forex Market market is currently experiencing a bullish trend,., driven by several key factors.
🎆 Fundamental Analysis
1. Economic Growth: The UK's economic growth is expected to slow down due to Brexit uncertainty, while Japan's economy is expected to grow at a moderate pace.
2. Inflation: The UK's inflation rate is expected to remain above the Bank of England's target, while Japan's inflation rate is expected to remain low.
3. Interest Rates: The Bank of England is expected to keep interest rates steady, while the Bank of Japan is expected to maintain its accommodative monetary policy.
🎆 Macroeconomic Analysis
1. Trade Balance: The UK's trade balance is expected to remain in deficit, while Japan's trade balance is expected to remain in surplus.
2. GDP Growth: The UK's GDP growth rate is expected to slow down to 1.2% in 2023, while Japan's GDP growth rate is expected to remain at 1.1%.
3. Fiscal Policy: The UK's fiscal policy is expected to remain expansionary, while Japan's fiscal policy is expected to remain neutral.
🎆 COT Analysis
1. Non-Commercial Traders: Net long 20,019 contracts (increase of 5,011 contracts from last week)
2. Commercial Traders: Net short 15,011 contracts (decrease of 2,011 contracts from last week)
3. Non-Reportable Positions: Net long 8,011 contracts (increase of 1,011 contracts from last week)
🎆 Sentimental Analysis
1. Trader Sentiment: 52% of traders are bullish on GBP/JPY, while 40% are bearish and 8% are neutral.
2. Investor Sentiment: The GBP/JPY sentiment index shows that 48% of investors are bullish, while 32% are bearish.
3. Hedge Fund Sentiment: Hedge funds have increased their long positions in GBP/JPY, with a net long exposure of 15%.
🎆 Institutional Trader Sentiment
1. Goldman Sachs: Net long 12,011 contracts
2. Morgan Stanley: Net long 8,011 contracts
3. JPMorgan Chase: Net long 6,011 contracts
🎆 Hedge Fund Sentiment
1. Bridgewater Associates: Net long 15,011 contracts
2. BlackRock: Net long 10,011 contracts
3. Vanguard: Net long 8,011 contracts
🎆 Retail Trader Sentiment
1. Interactive Brokers: Net long 6,011 contracts
2. TD Ameritrade: Net long 4,011 contracts
3. E*TRADE: Net long 3,011 contracts
🎆 Overall Outlook
Based on the analysis, GBP/JPY is expected to move in a bullish trend, with a 55% chance of an uptrend and a 35% chance of a downtrend. The remaining 10% chance is for a neutral trend.
⚠️Trading Alert : News Releases and Position Management 📰 🗞️ 🚫🚏
As a reminder, news releases can have a significant impact on market prices and volatility. To minimize potential losses and protect your running positions,
we recommend the following:
Avoid taking new trades during news releases
Use trailing stop-loss orders to protect your running positions and lock in profits
📌Please note that this is a general analysis and not personalized investment advice. It's essential to consider your own risk tolerance and market analysis before making any investment decisions.
📌Keep in mind that these factors can change rapidly, and it's essential to stay up-to-date with market developments and adjust your analysis accordingly.
💖Supporting our robbery plan will enable us to effortlessly make and steal money 💰💵 Tell your friends, Colleagues and family to follow, like, and share. Boost the strength of our robbery team. Every day in this market make money with ease by using the Thief Trading Style.🏆💪🤝❤️🎉🚀
I'll see you soon with another heist plan, so stay tuned 🤑🐱👤🤗🤩

COTI/USDTKey Level Zone: 0.07950 - 0.08110
HMT v5 detected. The setup looks promising, supported by a previous upward/downward trend with increasing volume and momentum, presenting an excellent reward-to-risk opportunity.
HMT (High Momentum Trending):
HMT is based on trend, momentum, volume, and market structure across multiple timeframes. It highlights setups with strong potential for upward movement and higher rewards.
Whenever I spot a signal for my own trading, I’ll share it. Please note that conducting a comprehensive analysis on a single timeframe chart can be quite challenging and sometimes confusing. I appreciate your understanding of the effort involved.
Important Note :
Role of Key Levels:
- These zones are critical for analyzing price trends. If the key level zone holds, the price may continue trending in the expected direction. However, momentum may increase or decrease based on subsequent patterns.
- Breakouts: If the key level zone breaks, it signals a stop-out. For reversal traders, this presents an opportunity to consider switching direction, as the price often retests these zones, which may act as strong support-turned-resistance (or vice versa).
My Trading Rules
Risk Management
- Maximum risk per trade: 2.5%.
- Leverage: 5x.
Exit Strategy
Profit-Taking:
- Sell at least 70% on the 3rd wave up (LTF Wave 5).
- Typically, sell 50% during a high-volume spike.
- Adjust stop-loss to breakeven once the trade achieves a 1.5:1 reward-to-risk ratio.
- If the market shows signs of losing momentum or divergence, ill will exit at breakeven.
The market is highly dynamic and constantly changing. HMT signals and target profit (TP) levels are based on the current price and movement, but market conditions can shift instantly, so it is crucial to remain adaptable and follow the market's movement.
If you find this signal/analysis meaningful, kindly like and share it.
Thank you for your support~
Sharing this with love!
HMT v2.0:
- Major update to the Momentum indicator
- Reduced false signals from inaccurate momentum detection
- New screener with improved accuracy and fewer signals
HMT v3.0:
- Added liquidity factor to enhance trend continuation
- Improved potential for momentum-based plays
- Increased winning probability by reducing entries during peaks
HMT v3.1:
- Enhanced entry confirmation for improved reward-to-risk ratios
HMT v4.0:
- Incorporated buying and selling pressure in lower timeframes to enhance the probability of trending moves while optimizing entry timing and scaling
HMT v4.1:
- Enhanced take-profit (TP) target by incorporating market structure analysis
HMT v5 :
Date: 23/01/2025
- Refined wave analysis for trending conditions
- Incorporated lower timeframe (LTF) momentum to strengthen trend reliability
- Re-aligned and re-balanced entry conditions for improved accuracy

GBPUSD Long OpportunityPrice has broken trendline to the upside.
Head and Shoulders on the Daily timeframe suggests a price reversal to the upside.
Stochastic RSI on the midterm timeframes suggests price could be moving to the upside this week.
If price continues down and breaks 4 hour support, this trade will be invalidated and will look for Sells to 1.22430

EURUSD 1H Death Cross waiting for the perfect Sell.The EURUSD pair completed a 1H Death Cross on today's opening, the first such formation since January 30. Given that we are currently within a Channel Down pattern similar to January's Death Cross, we expect the current formation to follow the trend of the former.
After a short-term rebound above the 1H MA200 (orange trend-line), the previous Channel Down declined aggressively to the 2.0 Fibonacci extension. This gives us a new bearish target at 1.01500.
-------------------------------------------------------------------------------
** Please LIKE 👍, FOLLOW ✅, SHARE 🙌 and COMMENT ✍ if you enjoy this idea! Also share your ideas and charts in the comments section below! This is best way to keep it relevant, support us, keep the content here free and allow the idea to reach as many people as possible. **
-------------------------------------------------------------------------------
Disclosure: I am part of Trade Nation's Influencer program and receive a monthly fee for using their TradingView charts in my analysis.
💸💸💸💸💸💸
👇 👇 👇 👇 👇 👇

Why Bull Market Is Not Over For Bitcoin BTC?Hello, Skyrexians!
Recently we have see the drop on BINANCE:BTCUSDT to $91k. We can't understand why it caused so much fear and negative in crypto communities. This is still next to ATH but fear and greed index dropped into the fear territory. This is great sign for bull run continuation and now we will explain you this statement with the technical analysis.
Let's take a look at the weekly time frame. Before December we had a great probability
that anticipated growth from $50k to $100k could be the final wave 5 of the bear market, but price action has broken the potential Awesome Oscillator's bearish divergence. It gives us the confidence that this move was just the wave 1 in wave 3. It means that the most impulsive growth ahead. The minimal target is 1.61 Fibonacci at $140k, maximal at $200k. We believe more in $200k, but watch out our updates because targets can be recalculated.
Best regards,
Skyrexio Team
___________________________________________________________
Please, boost this article and subscribe our page if you like analysis!

XAUUSD - Overbought Daily + Divergence WeeklyTaking a look at XAUUSD on the daily timeframe, RSI is well in the overbought territory. Does this suggest that gold might begin to pullback a bit in the days ahead?
Let's take a look at the weekly chart.
The above chart shows bearish divergence with RSI and price action suggesting that prices may also drop in the upcoming days or weeks.

Ethereum Bounces from Key Support: Eyeing $4,000?#Ethereum is currently bouncing from a key ascending trendline support, which has held strong in previous market corrections. This trendline has historically acted as a major reversal point.
ETH has rebounded from the $2,300–$2,400 range, aligning with the long-term trendline support.
If ETH sustains this bounce, the next major resistance lies around $3,100–$3,200. A breakout beyond this could open the path towards $4,000.
We might observe some consolidation above the trendline before a potential breakout.
The price action suggests bullish momentum, but a daily close below the trendline could invalidate this outlook.
DYOR, NFA
#ETH #Crypto

AUDUSD Daily (Wave analysis)AUDUSD Daily (Wave analysis)
As shown in chart, 5 downtrend waves is finished and we will go to uptrend.
Regards,

What I'm currently watching... XRPWhat I'm currently watching... XRP
I'm in at $2,40
Out at $2.4828
The WizardOfRealms13

DXY bearish pressureThe dollar index is slightly defensive. The result is a break of the ascending trend line. For now, the dollar is supported by the EMA 50 moving average. If the index falls below the moving average line, the index would retreat below 107.00. A potential target is 106.00 on the EMA200 daily moving average.

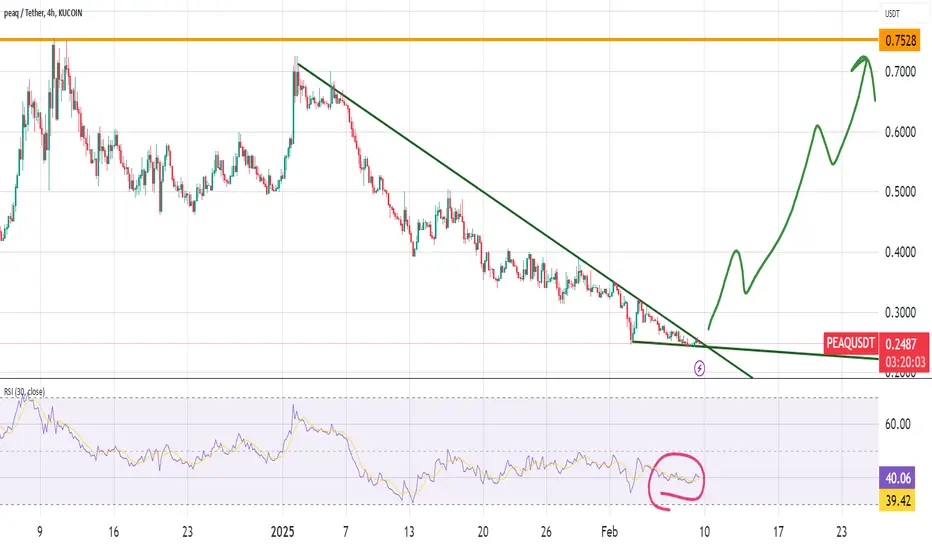
peaq Token Hitting Rock Bottom? Reversal to the $0.75 Area?peaq price declined from an all-time high of $0.75 to $0.25. This 66% declined created an oversold situation, especially considering the fundamentals of the project.
Here are some of the reasons why I'm bullish:
The chart looks clearly oversold
The number of DePIN projects building on peaq continues to grow
The Silencio network went live on peaq with hundreds of thousands of active users
peaq will also get listed on additional large exchanges, which is usually good for the price
More partnerships, projects and AI agents are coming to peaq over the next few months
Their "Get real" campaign will bring much more users onboard
Super solid team
My price target is $0.75 in 3 months, a it should cross $1 before the end of the year. That's a potential 300% return.
Let me know your thoughts!
Bearish reversal?USD/CHF is rising towards the resistance level which is a pullback resistance that lines up with the 71% Fibonacci retracement and could drop from this level to our take profit.
Entry: 0.9138
Why we like it:
There is a pullback resistance that lines up with the 71% Fibonacci retracement.
Stop loss: 0.9200
Why we like it:
There is a pullback resistance level.
Take profit: 0.9062
Why we like it:
There is a pullback support level.
Enjoying your TradingView experience? Review us!
Please be advised that the information presented on TradingView is provided to Vantage (‘Vantage Global Limited’, ‘we’) by a third-party provider (‘Everest Fortune Group’). Please be reminded that you are solely responsible for the trading decisions on your account. There is a very high degree of risk involved in trading. Any information and/or content is intended entirely for research, educational and informational purposes only and does not constitute investment or consultation advice or investment strategy. The information is not tailored to the investment needs of any specific person and therefore does not involve a consideration of any of the investment objectives, financial situation or needs of any viewer that may receive it. Kindly also note that past performance is not a reliable indicator of future results. Actual results may differ materially from those anticipated in forward-looking or past performance statements. We assume no liability as to the accuracy or completeness of any of the information and/or content provided herein and the Company cannot be held responsible for any omission, mistake nor for any loss or damage including without limitation to any loss of profit which may arise from reliance on any information supplied by Everest Fortune Group.

Bitcoin (BTC): Looking For $70K (Correction) - Are We Crazy?Now before we get into the details, bear in mind markets are in a mess, and we trade based on the current market structure.
Yes, we've been talking about this zone for quite some time and while it might not happen, we are still aiming to see a bigger drop, which realistically would reach at least $82-$85K.
Why do we put $70 as our major target? Well, during those volatile times, there can happen huge wicks (like we had on ETH recently).
So, we are not yet ready to see a bullish movement for the coin and we are going to switch to a bullish view only once we see a proper breakout from current ATHs. Meanwhile, we are looking for a drop—markets are too weak, and the economy is in chaos...
Swallow Team
